

Introduction
The chicken is extensively used as an animal model in myopia research, largely because the growth of its eye is very sensitive to experimental changes in visual experience. If chickens wear spectacle lenses, their axial eye growth is rapidly adjusted to achieve a match to the new focal plane (Schaeffel et al., Reference Schaeffel, Glasser and Howland1988). A striking finding was that this adjustment is controlled by the retina since it can also be observed after accommodation has been eliminated (Schaeffel et al., Reference Schaeffel, Troilo, Wallman and Howland1990) and after the optic nerve has been cut (Wildsoet & Wallman, Reference Wildsoet and Wallman1995). The perhaps most puzzling observation was, however, that the retina seems to be able to determine the sign of imposed defocus and triggers axial eye growth changes in the appropriate direction, depending on the sign of defocus (Diether & Schaeffel, Reference Diether and Schaeffel1999; Wallman & Winawer, Reference Wallman and Winawer2004). How this information is extracted from the retinal image in only 2–3 min (Zhu & Wallman, Reference Zhu and Wallman2009) is still unresolved. It is known that accommodation can also use directional cues under certain experimental conditions (Kruger et al., Reference Kruger, Mathews, Aggarwala and Sanchez1993; Wilson et al., Reference Wilson, Decker and Roorda2002), but accommodation may also be driven by trial and error—as suggested by the continuous fluctuations of the accommodation tonus during fixation of an object (Charman & Heron, Reference Charman and Heron1988).
In the chicken retina, glucagon-containing amacrine cells produce the transcription factor ZENK in correlation with the sign of imposed defocus. If the focal plane is in front of the photoreceptor layer, ZENK is upregulated, both at the mRNA (Simon et al., Reference Simon, Feldkaemper, Bitzer, Ohngemach and Schaeffel2004) and at the protein level (Fischer et al., Reference Fischer, McGuire, Schaeffel and Stell1999; Bitzer & Schaeffel, Reference Bitzer and Schaeffel2002). In the opposite case, it is downregulated when the focal plane is behind the photoreceptor layer. A few minutes of exposure to defocus are sufficient to trigger these changes (Simon et al., Reference Simon, Feldkaemper, Bitzer, Ohngemach and Schaeffel2004). Other amacrine cells do not show selectivity to the sign of defocus and respond only to changes in contrast, like dopaminergic amacrine cells (Ohngemach et al., Reference Ohngemach, Hagel and Schaeffel1997; Megaw et al., Reference Megaw, Boelen, Morgan and Boelen2006). Even though the information on the sign of defocus seems to be generated at the level of a subset of amacrine cells, it remains unclear whether this information is carried on to the retinal ganglion cells. Experiments in which retinal ganglion cells were silenced by intravitreal tetrodotoxin injections in chicks show that myopia can still be induced (McBrien et al., Reference McBrien, Moghaddam, Cottriall, Leech and Cornell1995). On the other hand, after destruction of most of the ganglion cells and many other neurons in the inner retina by intravitreal quisqualic acid, the ability of the retina to respond to the sign of imposed defocus was lost, although myopia could still be induced by diffusers (Bitzer & Schaeffel, Reference Bitzer and Schaeffel2004). The loss of the capability of the eye to compensate for the sign of imposed defocus could be due to the fact that important inputs to the glucagonergic amacrine cells were removed (Bitzer & Schaeffel, Reference Bitzer and Schaeffel2004). However, it could also indicate that ganglion cells are necessary to induce growth inhibition or acceleration.
The threshold for eye growth to respond to imposed defocus is surprisingly low (1 D; Schmid & Wildsoet, Reference Schmid and Wildsoet1997), and it is clear that eye growth can compensate both positive and negative defocus (Wallman & Winawer, Reference Wallman and Winawer2004). While it is clear that the information on the sign of defocus is available at the level of some amacrine cells, it is not clear whether this information is also available at the level of the ganglion cells. Therefore, in this study, we measured spatial resolution, spatial adaptation, contrast sensitivity, and sensitivity to defocus of chicken retinal ganglion cells in vitro for comparison to behavioral data and to find out whether the responses of ganglion cells can encode defocus and its sign.
Materials and methods
Experimental procedures
Chickens were kept under a 12/12 h light/dark cycle; food and water were supplied ad libitum. Twenty-two 2- to 6-day-old chicks were used for the experiments. The success rate for reliable recordings was, unfortunately, low. Only five retinas produced reliable responses over a long time so that the extensive contrast sensitivity functions could be measured. The experiments were approved by the Commission for Animal Welfare of the Medical Faculty of the University of Tuebingen.
For the preparation, the chicks were dark-adapted for at least half an hour, then decapitated, and the eyes enucleated. The eyes were transferred to a dish filled with warmed perfusate (37°C; for its contents, see below). Eyes were hemisected with a razor blade and the vitreous was removed with tweezers. A squared piece of retina of 4 × 4 mm was cut out with a razor blade. The retina was then placed on a “Thin-microelectrode array” (“MEA,” 8 × 8 electrode layout, 60 electrodes with a spacing of 200 μm, electrode diameter 30 μm, with integrated reference electrode; Multi Channel Systems, Reutlingen, Germany), with the ganglion cell layer down, facing the electrodes. To ensure proper attachment of the tissue to the glass surface of the MEA, its surface was coated prior to the experiment with nitrocellulose diluted in methanol (Stett et al., Reference Stett, Barth, Weiss, Haemmerle and Zrenner2000). After evaporation of the methanol, the retina was flattened on the nitrocellulose coating on the MEA. After attachment, the sclera was carefully removed within a minute. It was found that it was most critical that the retinal pigment epithelium was not damaged. If this could not be prevented during removal of the sclera, the retina lost its light sensitivity, probably due to the demise of the photoreceptors. The MEA carried a glass ring, forming a perfusion chamber over the recording area. The perfusion medium contained (in mM) 100 NaCl, 30 NaHCO3, 50 Glucose, 6 KCl, 2 MgCl2, 2 CaCl2, and 1 NaH2PO4. The perfusate was continuously bubbled with a gas mixture of 95% O2 and 5% CO2. The pH was in a range of 7.2–7.4. Osmotic pressure of the perfusate is a particularly critical variable (Egert, Reference Egert1995). A value of 325–328 mOsm resulted in the best recording results and kept the retina stable for many hours. With lower and higher osmolarities, the retinal ganglion cells often did not elicit any spikes. Osmotic pressure was monitored by an osmometer (Osmomat 030; Gonotec GmbH, Berlin, Germany) and, if necessary, adjusted by addition of glucose or distilled water. The temperature of the base plate of the MEA and the heating system in the perfusion cannula (PH01; Multi Channel Systems) was set to 37°C using a temperature controller (Thermostat HC-X; Multi Channel Systems). The flow rate of the perfusate was kept stable at a constant rate of 0.4 ml/min using a peristaltic pump (Minipuls3; Gilson, Middleton, WI). There were several reasons why the number of recorded ganglion cells remained limited. First, not all the 60 electrodes provided good signals. Second, some retinal ganglion cells displayed poor spiking activity or their responses showed no correlation to the optical stimulation. Only if the spike rates of the retinal ganglion cells were clearly modulated by light stimuli (periodic Ganzfeld light/dark changes at 0.5 Hz were used for testing), the preparation was accepted for the following experiments. Third, the amplitudes of the spikes could be too low to be distinguished from electrode noise, presumably because the cell soma was not close enough to the tip of the electrode. Fourth, we found that the chick retina was very sensitive to changes in pH and osmolarity. And finally, a tight attachment of the tissue to the surface of the MEA was very important but was sometimes not perfectly achieved.
Stimuli
The optic stimuli were generated by a conventional cathode ray tube monitor (Eizo F520, 1024 × 768 pixel resolution, refresh rate 100 Hz). The screen content was projected onto the retina from below through the ganglion cell layer, as in the living eye. A CCTV lens (“LCSmf6f,” focal length 6 mm, f/# = 1.6; The Imaging Source, Bremen, Germany) replaced the optics of the natural chicken eye. The maximal luminance of the monitor, positioned at 65 cm distance, was 100 cd/m2 (measured with Minolta Luminance Meter LS-100, Konica Minolta Holding Inc., Chiyoda, Tokyo, Japan).
Visual stimuli were generated by custom-developed software, written in Microsoft Visual C++ 6.0. The stimulus was a checkerboard with variable field sizes and variable gray values for each field, presented with a gray level resolution of 8 bits (256 gray levels). All checkerboard patterns were presented at identical luminances (see below). The checkerboard’s phase was periodically reversed at 1 Hz. The software also provided a trigger signal with every phase reversal of the checkerboard.
Recordings
The signals from all 60 electrodes were recorded simultaneously with the recording software “MC_Rack” (Multi Channel Systems). A preamplifier incorporated into the “MEA 1060” (Multi Channel Systems) acted also as a band-pass filter from 200 Hz to 3 kHz, selecting only fast signals, like spikes. Sampling frequency was set to 10 kHz. The traces were plotted “on-line” on the monitor of a separate recording computer and stored on the hard disk drive for “off-line” analysis.
Analysis
Retinal ganglion cells responded to changes of the checkerboard stimulus with immediate increases in their spike rates. Only those recording channels of the MEA that showed spike activity were included into the analyses, while the others were switched off. Spikes were analyzed with the software “NeuroExplorer” (Nex Technologies, Littleton, MA). To reduce the impact of spontaneous activity, perievent histograms were used with a time window of 200 ms after each phase reversal of the checkerboard image. Ganglion cell responses were not further studied in terms of ON- or OFF-channels since our interest was focused on spatial resolution and contrast sensitivity.
Experiment protocols
Three stimulation protocols were used:
(1) To determine spatial resolution of the ganglion cells, the field sizes of the checkerboard were varied. The fundamental spatial frequencies were calculated from the angular subtense of the checkerboard field sizes at the level of the retina, resulting in the following values (in cycle/deg): 1.64, 1.79, 1.97, 2.18, 2.46, 2.81, 3.28, 3.93, 4.91, 6.55, 9.82, and 0. Michelson contrast of the checkerboard was kept maximal for the measurements of spatial resolution (RGB pixel value zero for the dark fields and 255 for the bright fields). Measurements of relative brightness of the dark and bright fields with a photocell yielded an equivalent contrast of close to 100% (see below).
(2) To determine contrast sensitivity, the RGB values of the checkerboard tiles were changed in steps of the possible pixel gray level values. To achieve isoluminance at all stimulus contrasts, the brightness of the screen was measured at all gray levels. The resulting calibration curve was used to calculate the true Michelson contrast of the checkerboards on the screen using the conventional equation: contrast = (L max − L min)/(L max + L min). Thus, all stimuli were presented with the same average luminance of the screen (33 cd/m2, measured with Minolta Luminance Meter LS-100).
(3) To determine the effects of defocus, trial lenses were placed in the projection beam about 5 mm in front of the CCTV lens, similar to glasses worn in front of the eye. Tested lens powers were −3, −2, −1, −0.75, −0.5, −0.25, 0, + 0.25, + 0.5, + 0.75, + 1, + 2, and + 3 D. Magnification changes with the different trial lens powers at the level of the retina were around 1% and were neglected.
Results
Spatial acuity of retinal ganglion cells
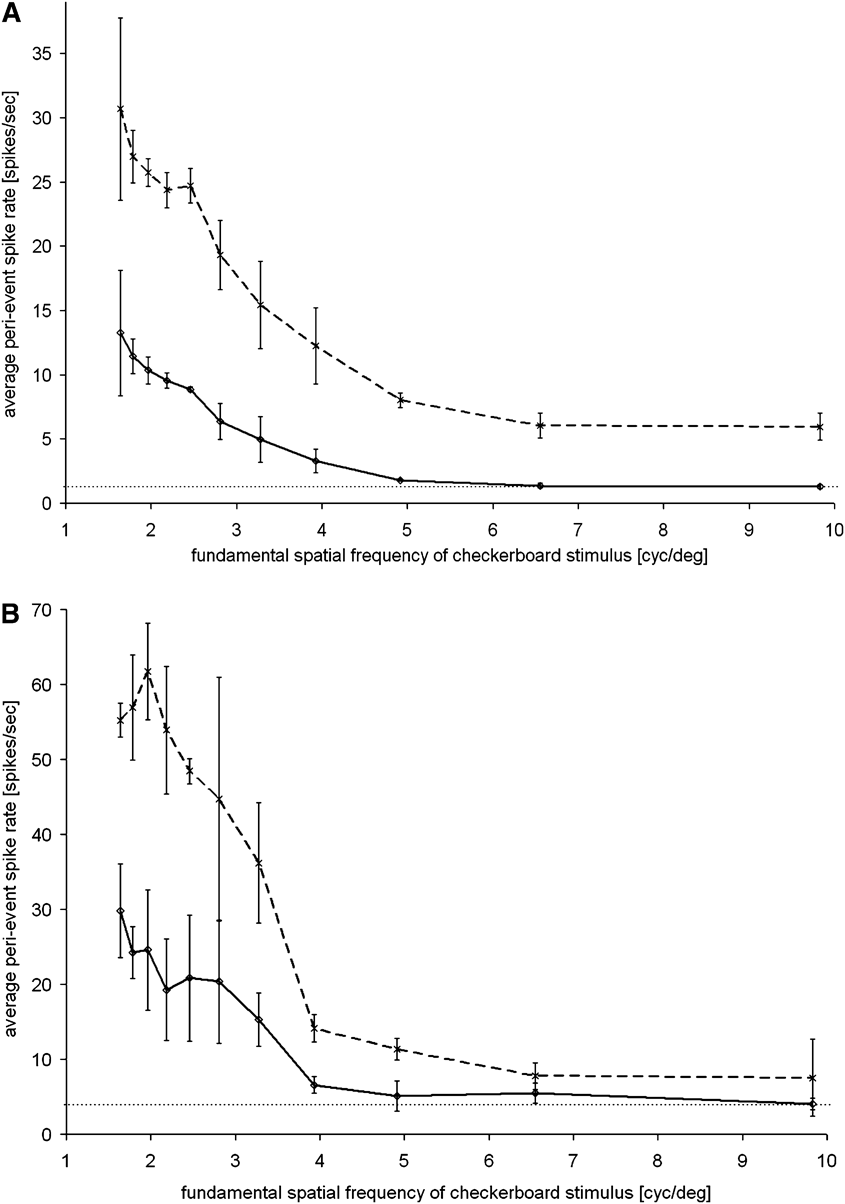
Mean perievent spike rates, recorded over the first 200 ms following the phase reversals of the checkerboard, are shown in Fig. 1A for one retina and in Fig. 1B for another. Ganglion cell responses were measured at each fundamental spatial frequency during three repeated stimulation sessions, which were randomly interrupted by stimulation sessions with other fundamental spatial frequencies. In total, 90 phase reversals were analyzed at each spatial frequency. The broken lines in both graphs (Fig. 1) show data from the best performing ganglion cell; the continuous lines show the averaged responses from all ganglion cells responsive to the stimulus. The dotted line at the bottom of the graphs marks the level of spontaneous activity, as measured at isoluminant gray, with spike rates from all electrodes averaged. Note that the level of spontaneous activity in the best performing ganglion cells was higher than the average spontaneous activity level.
Average perievent spike rates of retinal ganglion cells, following the first 200 ms after a phase reversal of a checkerboard, for 12 different fundamental spatial frequencies (cycle/deg). Results are shown for two retinas (A and B). Continued lines show the averaged responses of selected ganglion cells (A: 5 cells; B: 18 cells). Broken lines represent data from the “best-performing” ganglion cell in each of the preparations. The dotted lines indicate the levels of spontaneous activity, averaged over all ganglion cells. Error bars represent s.d.s Averaged ganglion cell responses reached the level of spontaneous activity at about 5 cycles/deg (A) or at about 4 cycles/deg (B). Individual cells showed responses at up to 5 cycles/deg. None of the ganglion cells showed responses above the level of spontaneous activity at spatial frequencies above 6.5 cycles/deg.

The highest spike rates were obtained at the lowest spatial frequencies in both preparations, and no signs of response saturation were observed for the lowest spatial frequency at 1.64 cycles/deg. In the higher spatial frequency range, spike rates approached the level of spontaneous activity at about 5 cycles/deg (Fig. 1A) or at about 4 cycles/deg (Fig. 1B). Individual cells showed responses at up to 5 cycles/deg in both figures. At the highest fundamental spatial frequencies that were presented (6.5 and 9.8 cycles/deg), none of the ganglion cells showed responses above the level of spontaneous activity.
Contrast sensitivity of retinal ganglion cells
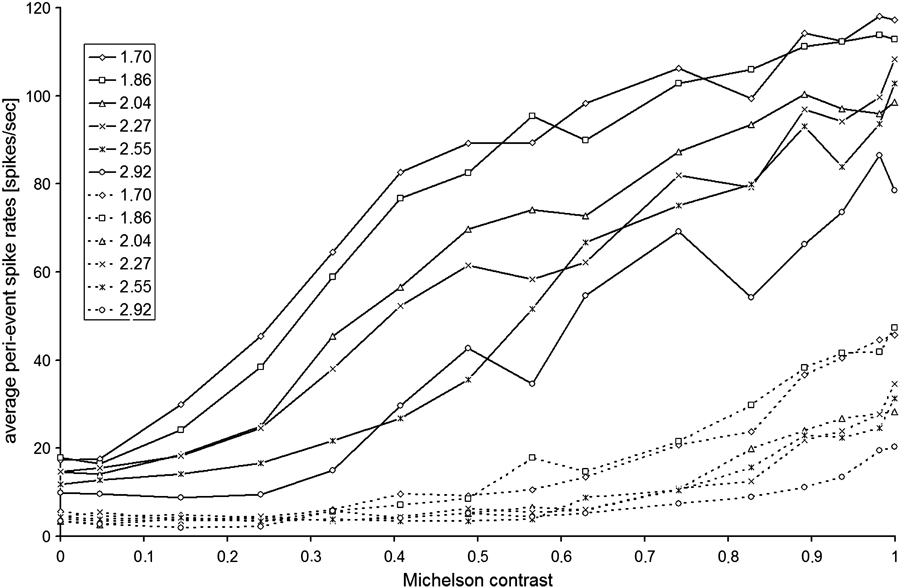
To study contrast sensitivity, the checkerboard pattern was presented with varying Michelson contrasts for six different fundamental spatial frequencies, ranging from 1.7 to 2.92 cycles/deg. Each measurement sequence provided the averaged spike rates following 30 phase reversals of the checkerboard, recorded for each tested contrast. Fig. 2 shows the averaged spike rates from two groups of ganglion cells. Cells were clustered into two groups, based on the linearity of their spike rates with increasing contrast (group A: higher correlation coefficient for a linear regression, n = 12; group B: higher correlation coefficient for exponential fit, n = 17). Linear contrast–response functions were accompanied by particularly high firing rates at higher contrasts. The spike rates (responses) recorded at zero contrast were taken as the levels of spontaneous activity. In group A, the threshold contrast was about 0.14 at the lower spatial frequencies of 1.70, 1.86, 2.04, and 2.27 cycles/deg. At a contrast of 0.05, the responses were no longer distinguishable from spontaneous activity. For higher spatial frequencies (2.55 and 2.92 cycles/deg), the threshold contrasts were higher. Cells in group B showed overall lower responses with a threshold contrast of 0.33 at low spatial frequencies (1.70 and 1.86 cycles/deg) and with higher threshold contrasts at higher spatial frequencies.
Average perievent spike rates in the first 200 ms after a phase reversal of the checkerboard, recorded from 29 retinal ganglion cells in one retina. Michelson contrasts were varied at 5 different spatial frequencies (contrasts are plotted on the abscissa, spatial frequencies (cycle/deg) are denoted in the symbol legend). Group A (continued lines): For the lower spatial frequencies of 1.70, 1.86, 2.04, and 2.27 cycles/deg, the threshold contrast was about 0.14. At higher spatial frequencies of 2.55 and 2.92 cycles/deg, threshold contrast was higher at about 0.33. Group B (dotted lines): For lower spatial frequencies of 1.7 and 1.86 cycles/deg, the threshold contrast was around 0.40.

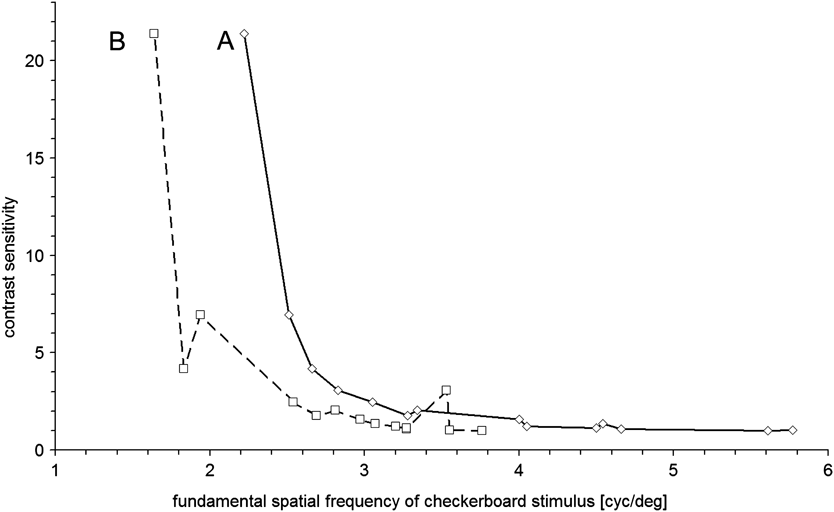
To determine conventional contrast sensitivity functions of ganglion cells in group A and B, the intersection of the linear regression of spike rate versus contrast with the level of spontaneous activity was determined for both groups of retinal ganglion cells and at each tested contrast. These functions are shown in Fig. 3, showing the reciprocal of the threshold contrast versus spatial frequency. In humans, the psychophysically determined contrast sensitivity function has an inverse U shape because the contrast sensitivity declines in the lower spatial frequency range due to cortical processing (Georgeson & Sullivan, Reference Georgeson and Sullivan1975). In the case of the ganglion cells responses, no decline was found in the tested lower spatial frequency range. It is likely that the peak of the contrast sensitivity function was located at even lower spatial frequencies but it was not located in the current study.
Contrast sensitivity functions of two groups of chicken retinal ganglion cells in vitro. Cells of group A (open diamonds): Note that contrast sensitivity is low for spatial frequencies above 3 cycles/deg but rises steeply for spatial frequencies below 3 cycles/deg. Cells of group B (open squares): These cells achieved a similar contrast sensitivity but at lower spatial frequencies, compared to group A. For instance, at 2.2 cycles/deg, both groups differed in their contrast sensitivity by a factor of 5. The highest contrast sensitivity that was measured in the current experiments was about 22 in both groups, equivalent to a contrast threshold around 5%. The higher variability of the data in group B traces back to the lower spike rates in this group (see Fig. 2).

Responses of retinal ganglion cells to defocus
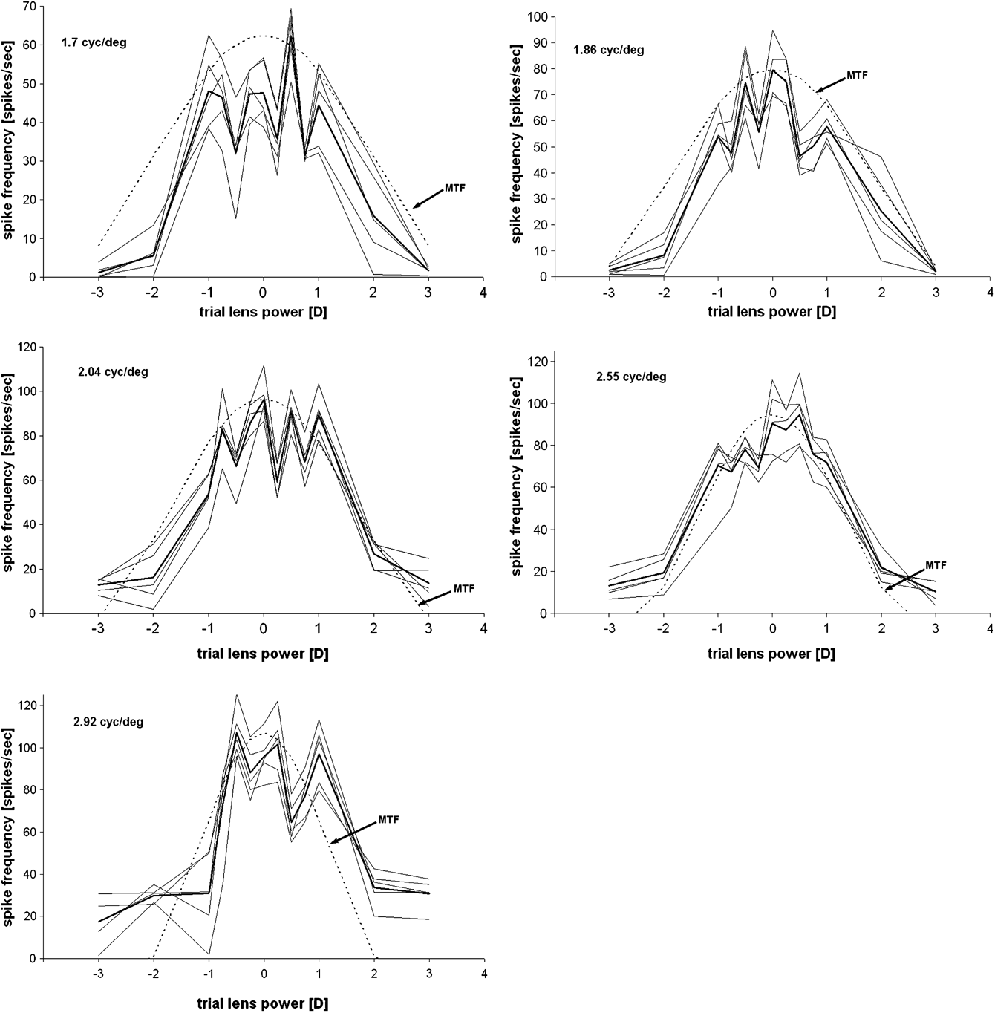
The image of the checkerboard on the retina was defocused in both directions using a set of trial lenses. Fig. 4 shows averaged perievent spike rates of a time window of 200 ms after phase reversal of the checkerboard pattern for five different spatial frequencies. As expected, the spike rates declined with increasing defocus. The major questions were (1) whether the ganglion cells had asymmetrical responses to defocus of different sign—which could suggest that they could distinguish between different signs of imposed defocus and (2) whether they could distinguish defocus from a general drop in contrast. The experiments gave a clear answer to both these questions. (1) At all five spatial frequencies tested, the decline of spike rates was symmetrical for both signs of defocus, indicating that the sign of defocus was not distinguished, and (2) the decline of spike rates for the spatial frequencies tested could be predicted from the first Bessel function for a diffraction-limited defocused optical system, the modulation transfer function (MTF, dotted lines in Fig. 4). Therefore, the ganglion cells seemed to respond only to the loss of contrast at the tested spatial frequencies. No specific detection mechanism for defocus was found.
Responses of five retinal ganglion cells to imposed defocus. Perievent spike rates during the first 200 ms following the phase reversal of the checkerboard stimulus are plotted against varying amounts of defocus, imposed by trial lenses of different powers (−3, −2, −1, −0.75, −0.5, −0.25, 0, +0.25, +0.5, +0.75, +1, +2, and +3 D), for five different fundamental spatial frequencies of the checkerboard (listed in the upper left corner of each figure). The thick lines represent the averaged spike rates. The dotted lines represent the respective MTFs, normalized to the maximum average spike rate. The decline of spike rate changes with increasing amounts of defocus is symmetrical for both signs and follows approximately the course of the MTF. This suggests that the responses of the ganglion cells were governed by the loss of contrast. There was no indication that any of the studied units was sensitive to the sign of imposed defocus. The slight asymmetries of the curves with respect to the zero defocus position were due to the problem of finding the best focus of the projection optics of the setup.

Fig. 4 also shows that the depth of focus declined with increasing spatial frequency as expected from the MTF for a defocused optical system. It should also be kept in mind that an artificial lens projected the checkerboard pattern onto the retina with presumably different optical aberrations, replacing the natural optics of the chicken eye. At least its focal length was close to the focal length of the natural optics of the chicken eye (Schaeffel et al., Reference Schaeffel, Glasser and Howland1988).
Spatial adaptation to the fundamental spatial frequency of the checkerboard
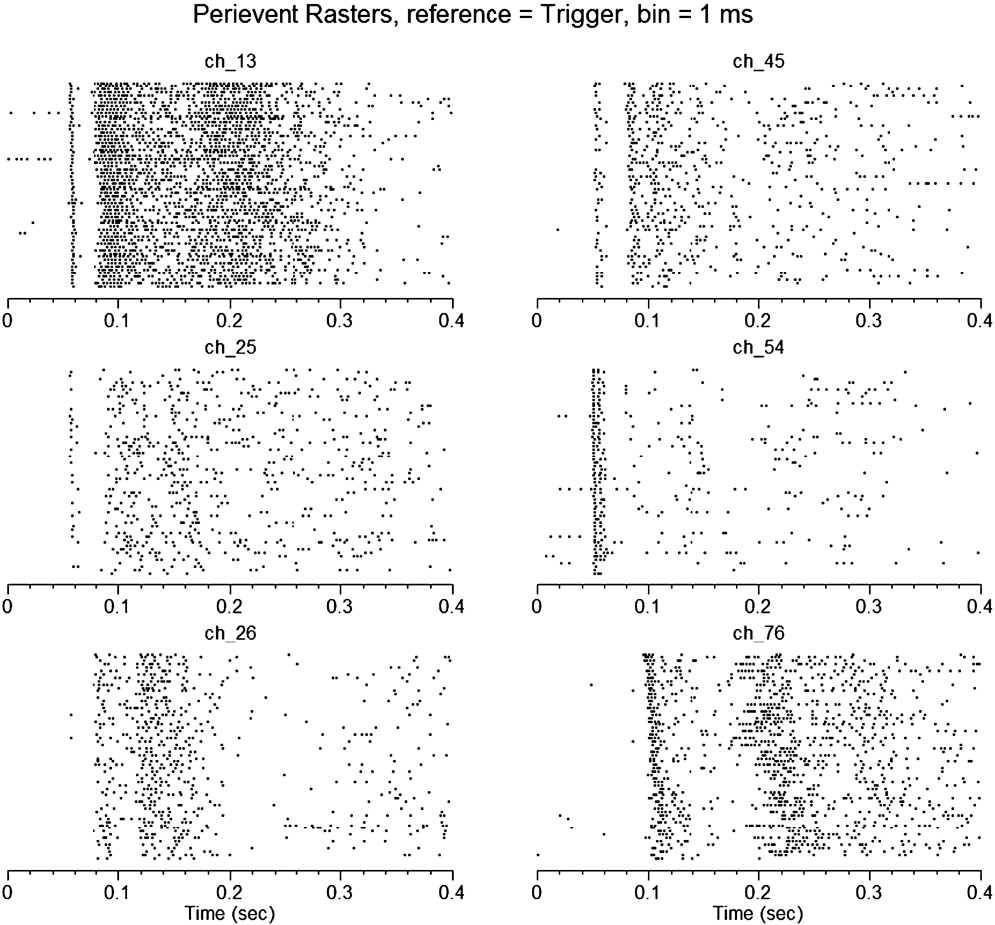
A few ganglion cells showed selective adaptation to the checkerboard stimulus. Examples are shown in Fig. 5. In these cases, the latencies of the recorded units to respond to the phase reversals increased over time, as shown for the recording electrode “ch_76.” This shift in latency was not observed for the five other ganglion cell units shown in Fig. 5. Unit “ch_76” also showed a generally longer latency compared to the other cells. There were no changes in total spike numbers over time in any of the units.
Increase in the latency of the responses of ganglion cells after continuous presentation of the same checkerboard pattern. Abscissa: Phase reversal and trigger event occurred at time point zero. Only the first 400 ms after the phase reversal of the checkerboard are shown. The checkerboard pattern was phase reversed every second over a period of 60 s, and the spikes for each trial are plotted below each other, with the first recording from 60 on the top, the last on the bottom. One single unit (ch_76) showed a strongly delayed response and the latency further increased over the time of the experiment. The earliest ganglion cell fired already 45 ms after the trigger signal. Other ganglion cells responded with varying time delays. A similar variability in latencies was observed in all recorded retinas.

Discussion
Spatial acuity of birds
Spatial acuity in birds is generally quite good. This is partially due to their large eyes and accordingly large retinal images. Among all vertebrates, eagles have been shown to have the highest visual acuity. The eyes of the wedge-tailed eagle (Aquila audax) remain diffraction-limited with a pupil size of 4–5 mm and 36 mm axial eye length, which permits a grating acuity of around 130 cycles/deg in a behavioral and anatomical study (Reymond, Reference Reymond1985). Lower spatial acuity was found, using pattern electroretinograms (PERG), in the American kestrel (Falco sparverius) (Gaffney & Hodos, Reference Gaffney and Hodos2003); this was expected based on their smaller eyes (axial length 14 mm with a grating acuity between 40 and 70 cycles/deg). In pigeon (Columbia livia), a spatial resolution of 18 cycles/deg was determined using full-field flash electroretinograms and PERGs (Porciatti et al., Reference Porciatti, Hodos, Signorini and Bramanti1991). A grating acuity of about 6 cycles/deg was described for the quail (Coturnix coturnix japonica) in a PERG study (Ghim & Hodos, Reference Ghim and Hodos2006).
A considerable amount of data is available on the behavioral–spatial resolution in the chicken, but large variability is also obvious. Over and Moore (Reference Over and Moore1981) found a spatial resolution of only 1.5 cycles/deg in a two alternative forced choice paradigm in 1-day-old chicks, whereas Demello et al. (Reference Demello, Foster and Temple1992) measured 4–6 cycles/deg in adult chicks. Johnson (Reference Johnson1914) found 7 cycles/deg in two gamecocks, which were 6 months old. More recently, Schmid and Wildsoet (Reference Schmid and Wildsoet1998) measured 7.7–8.6 cycles/deg in 8-day-old chicks and 6.0–7.7 cycles/deg in 2- to 4-day-old chicks using an optomotor drum, in which the head movements were visually tracked by human observers. In comparison, we found single retinal ganglion cells that responded to checkerboard patterns with a fundamental spatial frequency as high as 5 cycles/deg. At 6.5 cycles/deg and higher, no significant responses were recorded. Nevertheless, since the spatial resolution of ganglion cells in vitro approached the behavioral resolution in vivo, there is no need to assume a downstream “sharpening” mechanism to explain the slightly better grating resolution in vivo—the ganglion cells output almost reflects the performance of the intact animal.
Contrast sensitivity of birds
Humans have a contrast sensitivity of up to 250 at 5 cycles/deg, indicating that they can distinguish a brightness difference between two stripes of less than 0.5% (Campbell & Green, Reference Campbell and Green1965; Georgeson & Sullivan, Reference Georgeson and Sullivan1975). Monkeys, and even goldfish, have been shown to reach a contrast sensitivity of about 100 (De Valois & Morgan, Reference De Valois and Morgan1974; De Valois et al., Reference De Valois, Morgan and Snodderly1974; Merigan, Reference Merigan1976; Northmore & Dvorak, Reference Northmore and Dvorak1979).
Strikingly, contrast sensitivity is generally lower in birds. In the kestrel, a maximum contrast sensitivity of 30 was found at 10 cycles/deg (Hirsch, Reference Hirsch1982). Ghim and Hodos (Reference Ghim and Hodos2006) found, in six different bird species, a maximum contrast sensitivity between 10.72 (kestrel) and 6.04 (barn owls). Recent data from barn owls showed even lower contrast sensitivity in barn owls, a surprising finding, given their near perfect aberration-free optics (Harmening et al., Reference Harmening, Vobig, Walter and Wagner2007). Schmid and Wildsoet (Reference Schmid and Wildsoet1998) reported a minimal contrast threshold between 4 and 11% at 1.2 cycles/deg in 8-day-old chicks; higher and lower spatial frequencies resulted in lower contrast thresholds. The lowest spatial frequency tested in the current study was 1.7 cycles/deg—it could be that the contrast sensitivity would have been even higher at lower spatial frequencies.
The responses of retinal ganglion cells in vitro reflected nicely the behavioral observations on grating acuity and contrast sensitivity in the chicken. Contrast detection thresholds for the checkerboard stimulus were 14.4% above 2.5 cycles/deg and declined to 4.7% below 2.3 cycles/deg. Minimum contrast thresholds in chicks are comparable to PERG data from other avian species: American kestrel 10.72%, Japanese quail 9.85%, white carneaux pigeons 7.98%, red-bellied woodpecker 6.72%, common starlings 6.18%, and barn owls 6.04% (Ghim & Hodos, Reference Ghim and Hodos2006). In summary, low contrast sensitivities of 20 or less may be typical for birds and are certainly different from those found in primates (above 200 in humans at 5 cycles/deg; Campbell & Green, Reference Campbell and Green1965; Georgeson & Sullivan, Reference Georgeson and Sullivan1975). These data also suggest that no further contrast enhancement occurs upstream after the retinal ganglion cells in the optical tectum.
The reason for the overall low contrast sensitivity in birds is yet unknown. It was proposed for avian vision, in case of the eagle, to favor high resolution above contrast sensitivity, whereas mammals, as humans, favor rather contrast sensitivity than resolution (Reymond & Wolfe, Reference Reymond and Wolfe1981).
Responses to defocus
Our in vitro recordings of chicken retinal ganglion cells suggest that these cells did not differentiate between a general loss of contrast of the stimulus pattern and a selective loss of contrast at higher spatial frequencies due to imposed defocus.
It is known from immunohistochemical studies (Fischer et al., Reference Fischer, McGuire, Schaeffel and Stell1999; Bitzer & Schaeffel, Reference Bitzer and Schaeffel2002) that some of the upstream neurons, the glucagonergic amacrine cells, access this information in vivo, as shown by analyses of the expression of the transcription factor ZENK. Three major interpretations are possible (1) the retina in vitro may have completely lost the ability to discern defocus from a general drop in contrast and/or (2) the information on the sign of defocus is generated only at the level of some amacrine cells and used to emmetropize the eye but not transmitted to the retinal ganglion cells and the brain and/or (3) the natural optics of the chicken eye provides cues on the sign of defocus due to its optical aberrations. It should be mentioned that a defocused but otherwise perfect optical system provides exactly symmetrical loss in contrast for both signs of defocus. Without optical aberrations, there is no chance to recover the information on the sign of defocus.
None of these options can be completely excluded. With regard to (1), experiments by Bitzer and Schaeffel (Reference Bitzer and Schaeffel2004) have shown that a sign of defocus-dependent expression of ZENK in glucagonergic amacrine cells could no longer be elicited when the isolated retina was presented with defocused video movies, suggesting that the image processing for the sign of defocus detection was no longer functional. If defocus was imposed by spectacle lenses in anesthetized chickens, ZENK was also no longer regulated in correlation with the sign of defocus—even though the connections to the brain were functional, the optics natural and blood circulation preserved. With regard to (2), since we could not record from amacrine cells (which are also nonspiking and far away from the MEA electrodes), we cannot exclude this explanation. With regard to (3), it is known that human subjects have difficulties in determining the sign of defocus when viewing images through a microscope, without using trial and error. However, some evidence also exists (Wilson et al., Reference Wilson, Decker and Roorda2002) that the direction in which accommodation responds under strictly monocular conditions with all other depth cues removed is still significantly related to the sign of defocus—as long as the pupil size is large and the optical aberrations of the eye are available to provide an odd error cue. With regard to the current in vitro experiments, it should be kept in mind that the projecting lens was artificial and had different aberrations than the natural optics of the chick—although the natural chicken eye optics is very good and diffraction-limited, with very low levels of aberrations (Coletta et al., Reference Coletta, Marcos, Wildsoet and Troilo2003; Garcia de la Cera et al., Reference Garcia de la Cera, Rodriguez and Marcos2006; Kisilak et al., Reference Kisilak, Campbell, Hunter, Irving and Huang2006).
Taken together, it is possible that the chicken retinal ganglion cells could encode for defocus and its sign in vivo but not in vitro. What makes the difference in their connections in intact animals and in the retina in isolation? First, potentially important efferent connections from the brain are removed if the retina is isolated. Second, retinal structure is compromised and the photoreceptor alignment may be disturbed, causing different optical conditions. Third, the retinal networks may be operating out of its optimal range because the metabolic conditions are suboptimal and delicate information may no longer be generated. Furthermore, eye movements that normally cause retinal image slip with well-defined temporal patterns (Greschner et al., Reference Greschner, Bongard, Rujan and Ammermuller2002) are absent.
Finally, the recorded ganglion cells in this study might represent only a subset of retinal ganglion cell types represented in the chick retina. There are 17 types of retinal ganglion cells known up to now in the primate retina (Field & Chichilnisky, Reference Field and Chichilnisky2007). The “traditional” retinal ganglion cell types, the ON and OFF parasol (magnocellular) and ON and OFF midget (parvocellular) cells, provide 70% of all ganglion cells. Small bistratified retinal ganglion cells amount to another 10%. The remaining 20% consist of large bistratified cells, giant sparse cells, and 10% or even more not yet described cell types.
In the current study, the recorded retinal ganglion cells could be clustered into two groups, depending on the shapes of their contrast–response functions (either more linear or more exponential). In how far these clusters reflect a similarity to the functional separation of the magnocellular and parvocellular ganglion cells in the mammalian retina needs to be tested in further experiments. Extracellular recordings from primate retinal ganglion cells were performed by Kaplan and Shapley (Reference Kaplan and Shapley1986) who show a plot just like our Fig. 2 (impulses/s vs. contrast, their fig. 2). It is clear that their fig. 2 shows a fundamental finding because two different classes of retinal ganglion cells were described for the primate retina, based on the contrast sensitivity functions. A key difference to their fig. 2 is, however, that they determined contrast sensitivities at the “optimal spatial frequency for each cell” (which means, at a different spatial frequency for each cell), rather than at defined spatial frequencies, as we did (our Fig. 2).
Furthermore, Croner and Kaplan (Reference Croner and Kaplan1995) plot the “typical primate ganglion cell responses” (impulses/s, extracellular recordings) versus spatial frequency (cycle/deg) on log-log coordinates at an unknown fixed contrast (their fig. 1A). Interesting in their plot is that the cell responses decline again at lower spatial frequencies, with a peak response at about 7 cycles/deg. This finding suggests that we may not have localized the peak of the contrast sensitivity function in our recordings because we did not (yet) find any decline in responses at the lower spatial frequencies that we tested.
Pioneering work on the electrophysiology of avian ganglion cells was presented by Miles (Reference Miles1972) who studied ganglion cell receptive field properties in chick. However, the only study in which it was attempted to classify chicken retinal ganglion cells based on their firing rates was by Liu et al. (Reference Liu, Zhou, Gong and Liang2007). Here, response latencies were studied following full-field white light stimulation, and ganglion cells were classified into those that had shorter latencies than 10 ms or longer than 30 ms. Latencies measured in this study were considerably shorter than in our study (above 45 ms), but a full-field white light stimulation of 12.18 nW/cm2 is also different from our checkerboard with a screen luminance of 33 cd/m2. Accordingly, it may also stimulate different ganglion cell types. Unfortunately, the two “intensities” cannot be converted into each other because no details on the f/# of the projection lens were provided in Liu et al. (Reference Liu, Zhou, Gong and Liang2007).
To be able to safely exclude that none of the chicken ganglion cells encode for defocus and its sign, more retinal ganglion cells need to be studied and their responses analyzed in detail and potentially clustered in different classes.
Effective defocus imposed on the level of the retina and trial lens power
Since the trial lenses used to defocus the image on the retina could not be positioned in the principle plane of the projection optics, their “effective” power might have been different from their real power. In fact, using a standard equation to determine the total power of thin lenses placed behind each other [total power = power1 + power2 − distance (m) × power1 × power2] suggests surprisingly little effect of the trial lens. For a power of the projection lens system of 160 D (6 mm focal length), a 3 D trial lens placed at 7-mm distance would add only about 0.5 D. However, using the ray tracing software Zemax (ZEMAX Development Corporation, Bellevue, WA) with thick lenses showed that the thin lens approximation is not appropriate and can give entirely different values. Even though the details on the internal optics of the projection lens remain unknown, the simulation showed that the trial lens could have an effective power of about 3 D, as intended. Some direct measurements were also done, placing the trial lens in front of the projection lens system and measuring the shift in the focal plane. The shift matched about the expected 3 D, which is also in line with responses seen in the retinal ganglion cells for the various amounts of imposed defocus.
Another potentially important question is whether the ganglion cells could have “seen” the checkerboard pattern with the defocus imposed. A more extensive simulation could involve that the point spread function of a defocused 6-mm f/1.6 lens is determined and applied to the checkerboard pattern. The receptive fields of the ganglion cells, with estimated diameters (since we do not have direct measurements of their structure and size), must be randomly positioned at various sampling positions and their output be predicted from the contrast they are exposed to. Spike rates can then be compared to the actual recordings. Even without such a simulation, the following can be stated:
(1) The receptive field sizes of the ganglion cells with the highest resolution (5 cycles/deg) must be between 0.2 and 0.3 deg.
(2) With 3 D of defocus (the maximum defocus tested here), the cutoff spatial frequency that is imaged by a lens with an aperture of 3.75 mm (determined from the focal length F = 6 mm and the aperture f/# = 1.6) would only be about 1.9 cycles/deg. Therefore, the fundamental spatial frequency of 5 cycles/deg would no longer be resolved. It can be seen in Fig. 4 that the responses had disappeared with a defocus of only 1–2 D, when the checkerboard stimulus with a fundamental spatial frequency of 2.92 cycles/deg was presented. Therefore, there was no obvious contradiction between the measured and calculated responses of the ganglion cells.
Spatial adaptation
Finally, single retinal ganglion cells seem to adapt to a repeating pattern if they are presented over a period of time (1 min). Adaptation was reflected in an increase of the latency of the spike bursts, following the phase reversal of the checkerboard. The spike rate itself was not affected. This may reflect a more demanding spatial processing since the adaptation was selective for a certain spatial frequency of the pattern. Adaptation to certain spatial frequencies was demonstrated psychophysically in humans (Blakemore & Campbell, Reference Blakemore and Campbell1969; Georgeson & Sullivan, Reference Georgeson and Sullivan1975) but not yet at the level of retinal ganglion cells in the chicken. The only study on adaptation in chicken retinal ganglion cells, also performed with a MEA from Multi Channel Systems, focused on luminance-related changes in contrast sensitivity (Chen et al., Reference Chen, Zhou, Gong and Liang2005). In our study, only a few cells showed spatial adaptation (Fig. 5), confirming the notion that “the functions of retinal ganglion cells are as diverse as their morphology” (Field & Chichilnisky, Reference Field and Chichilnisky2007).
Acknowledgments
This study was supported by the German Research Council (DFG Scha 518/13-1). We thank Dr. Juan Tabernero for ray tracing studies through our projection lens system using Zemax.