


1. Introduction
The way evolutionary economists think about the division of labor is heavily influenced by the work of Herbert Simon (Simon and Ando, Reference Simon and Ando1961; Simon, Reference Simon and Simon1996, Reference Simon2002). He showed that the general structure of problem-solving activities involves the development of near-decomposable, hierarchical structures. Human problem solving consists of the recursive decomposition of a complex problem into self-contained modules, each of which solves some sub-problem. As the original problem is partitioned, its overall complexity becomes manageable. The specific principle of organization, which determines which modules are part of the problem solution and what their functions will be, is called its architecture. It links the modules through interfaces that specify how they interact and which information they exchange. Standards of communication developed in the course of defining interfaces make modules interchangeable and their performance comparable. Simulation studies have shown that this strategy has an advantage in terms of more quickly reaching local optima, but that it generally fails to find the global optimum of a problem (e.g. Frenken et al., Reference Frenken, Marengo, Valente and Brenner1999; Marengo et al., Reference Marengo, Dosi, Legrenzi and Pasquali2000; Marengo and Dosi, Reference Marengo2005). Therefore, this learning and problem-solving strategy guarantees selective advantage in environments that require fast adaptation. It lies at the heart of technological search, technical change, and the resulting production activities.
As Alchian and Demsetz (Reference Alchian and Demsetz1972) have argued, the concept of non-separability, and hence non-decomposability, is crucial to an understanding of organizational designs and the firm in general. Team production is an essential characteristic of the production process and organizations and at the same time gives it the characteristics of a complex system. This makes the metering of productivity difficult, as no individual worker is held directly accountable for the teams' produce and some members in the team will have an incentive to shirk. This implies that the property rights of the firm, which among others consist of the right to be the residual claimant and to observe the behavior of employees, are not clearly defined, resulting in a tragedy of commons. This can only be solved by readjusting the property rights, for example by moving decision rights to one team member who will be the residual claimant and depriving other team members of this status. Firms can also manage this contested exchange by allocating critical knowledge to those with decision rights (Jensen and Mecklin, Reference Jensen, Meckling, Werin and Wijkander1992), which implies that some agents have to be stripped of this knowledge and others have to acquire it. The more specific the related knowledge is, the more difficult it will be to achieve this goal, as agents will need more time to absorb it or require better absorptive capacities to integrate it. In any event, as one can imagine, this process will certainly not unfold in a smooth and frictionless manner.
In the evolutionary literature on the division of labor, (Langlois (Reference Langlois2002) has taken the theories sketched in the previous two paragraphs as a starting point for developing a ‘modularity’ theory of the firm. His argument goes that (dynamic) efficiency requires that knowledge and rights as residual claimants be perfectly partitioned, and that therefore over time we should observe a modularization of economic organizations with the market holding all the architectural knowledge on inter-firm relations. Indeed, his view of the division of labor between firms is likely to apply to the organization of work within the firm as well. In this paper we will focus on this aspect of the evolutionary theory of the division of labor. We will study the evolution of a near-decomposable organization (or the division of labor) inside the firm. For this purpose we will draw on the labor process literature which argues that ‘markets are also disciplinary institutions, providing mechanisms for altering the supplies of inputs and production functions alike thus shifting the production possibility frontier’ (Bowles and Gintis, Reference Bowles1993: 86). The division of labor therefore has as much to do with the ability of firm proprietors to regulate the pace and quality of work as it does with their general pursuit of technical or economic efficiency (e.g. Marglin, Reference Marglin1974; Braverman, Reference Braverman1974; Gintis, Reference Gintis1976; Bowles, Reference Bowles1985).
The idea of a contested exchange has been the theoretical underpinning of a large number of studies on the development of corporate capitalism and the rise of the large Chandlerian firm. Authors in this tradition have argued that the application of engineering methods to organizational problems is an important means of solving problems involved in the contested exchange between firm owners and workers (see see Noble, Reference Noble1977; Clawson, Reference Clawson1980; Montgomery, Reference Montgomery1987; Miller and O'Leary, Reference Miller and O'Leary1987; Lazonick, Reference Lazonick1990; Hopper and Armstrong, Reference Hopper and Armstrong1991; Bhimani, Reference Bhimani1994). This has led to the development of Scientific Management, which allows production knowledge to be moved to the holders of decision rights. It has fostered the partition of decision rights and residual claims within the firms and moved knowledge about the architecture of the productive task to the administration (and hence to the principal), while leaving workers with specific standardized tasks that can be easily monitored and are often based on generic knowledge – thereby making workers more easily replaceable.Footnote 1
The aim of this paper is to analyze to what extent the development of a near-decomposable organization of the firm is constrained and determined by social institutions. The model characterizes this process as the outcome of technological search and problem solving, as well as the result of a social process in which agency problems between workers and firms are dealt with. It is shown that, also in the absence of economies of scale, a strong internal division of labor may evolve when the management of a firm tries to reassert control over a production process characterized by team production. In Section 2 we summarize some of the historical evidence on divergent development paths in technical and organizational change in the UK and the US at the beginning of the twentieth century and the role social factors played in this development. In Section 3 we present the model and characterize its general behavior. In Section 4 we use the model to interpret the historical evidence presented in Section 2. In Section 5 we draw some conclusions.
2. Historical accounts on the organization of work and the divergence of productivity patterns in the US and the UK at the beginning of the twentieth century
The rise of the large firm is probably best understood by taking a comparative historical approach. Here we compare historical accounts of the development of UK and US firms at the beginning of the twentieth century. Lazonick Reference Lazonick1981, Reference Lazonick1983, Reference Lazonick1990 and Elbaum and Lazonick (Reference Elbaum1984) have argued that in this period British industry lost its role as the workshop of the world to the United States because of its failure to re-equip production processes with modern technology. These contributions show that capitalists were unable to adapt the UK's economic structure, which was still based on the competitive model of the nineteenth century. The transition to a model of corporate or managerial capitalism like that developed in the United States did not take place due to institutional inertia in the organization of industry, which in turn determined a specific arrangement of the labor process. As a consequence of their competitive mindset, British decision makers failed to make a collective effort to alter these institutional constraints as US capitalists did.
The managerial organization and technologies employed by late nineteenth-century UK firms were comparatively simple. They were mainly run by owner-proprietors or close family associates. Managerial and administrative staffs were small, as methods of cost accounting and production control were crude or not used at all. A specific development in the British industry in the second half of the nineteenth century was that many groups of workers consolidated their control over the production process. Individual industrialists, engaged as they were in unsettling competition with other firms, opted to collectively accommodate unions of skilled and strategically positioned workers rather than jeopardize the fortunes of their firms through industrial conflict. During that time the labor movement also made important legislative gains which enhanced the ability of workers to organize unions and stage successful strikes. Even when skill-displacing technical change took place, the power of the unions had become so great that it had little effect on costs, as wages could not be cut.
For British managers this system of craft control had a number of advantages. The reliance on shop-floor labor to coordinate production involved low organizational and capital costs. The large administrative overhead and capital-intense production that characterized corporate capitalism could be avoided (Lazonick, Reference Lazonick1990: 181 ff). It was also a very effective mode of recruitment and supervision, as it was decentralized and built on personal relations. In the competitive environment in which firms operated, these features of craft control proved advantageous as firms had a very limited ability to experiment with different organizations of production. In any event, this organization of production allowed them to compete against and resist high fixed cost competition for some time.
The disadvantages of this arrangement were eventually responsible for the British industry falling behind that of the United States as they certainly delayed or altogether inhibited the adoption of new technologies. As (Lazonick Reference Lazonick1981) argues in his study of Lancashire cotton spinning, when technical change threatened their privileged position, skilled workers often cooperated with managers to increase their work effort in order to cut unit costs and overcome the expected net advantage of the new technology. As a consequence, the diffusion of new technologies was extremely slow. In many cases skilled labor also controlled the technical adjustment and tuning of machines. This created a situation where no two pairs of otherwise identical machines worked the same way. This lack of standardization made crafted workers less disposable. Together with favorable labor legislation, a strong collective organization in handling labor-related issues, and the power to execute important managerial tasks such as the organization of production and the hiring and firing of workers all ensured that British craftsmen would be in charge whenever the relation between work effort and pay was determined. Firms could only threaten to introduce new machinery from time to time in order to elicit more effort, but the power of the workers remained largely untouched. Lazonick's work suggests that the failure of British managers and proprietors to take control of the production process was a major factor in long-term British decline.
The ‘aristocratic’ position of craftsmen also had an effect on the labor market and the workers themselves. As they were in charge of hiring and firing, they could not only establish the relation between work effort and pay, but they could also prevent general labor market conditions from working against their own interests. The unions repeatedly and successfully opposed attempts on the part of management to interfere with hiring and firing of workers (Lazonick, Reference Lazonick1981: 502; Lazonick, Reference Lazonick1983: 228 – 229). At the same time most crafted workers retained their jobs for a very long time. This meant there were more skilled workers available than the labor market could absorb. However, as it was the insiders who did the hiring, labor market pressure rarely translated into wage cuts. Outsiders either had the option to seek low-paid unskilled work, remain unemployed, or emigrate to the United States. This persistent insider – outsider problem had the same effect on wages as an undersupply of workers. As a result, the chances of a skilled worker of finding identical work after being dismissed were low, but this had no effect on the level of the insiders' wages.
The US initially had a similar system of craft control, which characterized the American System of Manufactures (Lazonick and Brush, Reference Lazonick and Brush1985). However, unlike in the UK, American businessmen's reliance on inside contracting, i.e. skilled shop-floor labor, to coordinate production activities was generally short lived. In contrast to British managers, they lacked neither the individual nor collective means to alter the prevailing institutional constraints. They developed technological and organizational alternatives to leaving skills, and along with them the control of work, on the shop floor. In particular, the economic downturn at the beginning of the 1880s and the immigration waves in 1880s were used to vigorously break the power of the unions and gain control over the production process (Montgomery, Reference Montgomery1987: chapter 1). ‘By employing unskilled immigrants from Eastern and Southern Europe, by investing in deskilling technological change, and by elaborating their managerial structures to plan and coordinate the productive transformation, US industrial capitalists attacked the craft control that workers – typically of British and German origin – had staked out during the 1870s and 1880s’ (quoted from Lazonick and O'Sullivan,. Reference Lazonick, O'Sullivan, Chandler, Amatori and Takashi1997: 501).
As (Chandler Reference Chandler1962) has shown, the rise of corporate capitalism in the US went hand in hand with the rise of the ‘large’ enterprise. These were essentially firms that had developed large administrations which were used to control the production process in order to cut production costs and control the market in order to evade competition. Unlike British firms, American firms changed their industrial structure in such a way as to reduce the pressure of competition. They integrated and merged operations, pursuing strategies to segment the market through marketing. On the cost cutting front initial attempts to introduce new management methods like Systemic Management took place as early as the 1870s (Litterer, Reference Litterer1963). These developments foretold what would develop from the late 1880s onward. Many authors have argued that the introduction of management methods that relied on Frederick W. Taylor's Scientific Management principles were a core ingredient in breaking the power of the unions and gaining control of the shop-floor (e.g. (Clawson, Reference Clawson1980; Montgomery, Reference Montgomery1987). It consisted of breaking the work process down to its most elementary tasks and using closely monitored unskilled workers to execute them. This favored the standardization of work routines (Noble, Reference Noble1977: chapter 5) and the development of cost measures to control activities (Levenstein, Reference Levenstein and Temin1991). The gathering and evaluation of information on production and sales increased sharply, thereby increasing the importance of administrative activities. Eventually the information flows generated in this way swelled to such a scale that it became necessary to apply the very same principles to office (Beniger, Reference Beniger1986; Yates, Reference Yates1989; Reinstaller and Hölzl, Reference Reinstaller, Hölzl, Foster and Hölzl2004).
Although crafted workers tried to collectively organize and resist these developments in the 1880s, the combined effects of the racial segmentation of the work force, the firms' resolute use of strikebreakers (mostly immigrants), the tactic of locking out workers and an important High Court ruling to outlaw workers' control ensured that craftsmen failed to gain control over the production process (Montgomery, Reference Montgomery1987: chapter 1). The division of labor that ensued as a consequence of modern management methods and the resulting allocation of work warranted that no crafted worker was able to control an entire production process. By the early years of the twentieth century most industries had completely abandoned methods of production in which craftsmen made the products and laborers fetched and carried parts. The new industrial system with its extreme division of labor broke up the crafts, replacing skilled workers with cheaper machine operators. Most skilled workers indeed ceased to be production workers. They became engaged in ancillary tasks like planning and tool making, while the actual production was carried out by specialized operatives (Montgomery, Reference Montgomery1987: chapter 5).
The consequence of this development was that management was very much in charge of determining the relation between work effort and pay. ‘Breaking down company operations into component parts . . . provided executives with an accurate standard against which to measure the performance of each unit of operation’ (quoted from (quoted from Noble, Reference Noble1977: 282). With these figures at hand they could more easily determine who was performing under par and fire these workers – even more so, as the weakened unions could not oppose such policies. On the other hand, managers also understood perfectly well how an abundant labor supply could work in their favor. The existence of a continuous flow of low-skilled or unskilled workers ensured that deskilling technical change would also allow wages to be cut. With the unions unable to control wages, dissatisfied skilled workers needed to leave the firm in order to avoid the consequences of technical change or accept substantial wage cuts.
American industrialists were neither constrained by too fierce competition nor unable to change the institutional factors that constrained British firms. Consequently, they could opt for techno-organizational designs that maximized productivity. As Lazonick and O'Sullivan (Reference Lazonick, O'Sullivan, Chandler, Amatori and Takashi1997) have argued, the productivity growth experienced by US manufacturing in the early twentieth century could not have been achieved without managerial success in gaining control over work organization on the shop floor. The importance of this development is studied in the following simulation model.
3. The model
In this section we present a simulation model that captures some of the aspects we have discussed in the first two sections of the paper. In this model, economic growth is conceived as flowing from an increasing division of labor. The near-decomposable structures that emerge from this process are dynamically efficient in that they encourage learning by doing. On the other hand, as we model the interaction between management and workers, smaller and more specialized routines are also easier to monitor. Therefore, firm owners and management have an interest in organizing production in a near-decomposable way, while workers have an interest in opposing this, as it implies a loss of control over the production process. Over time, in dependence on the institutional arrangements governing the relationship between workers and capitalists, firms learn about the best techno-organizational design and adapt their innovation strategies accordingly. A simulation exercise of this analytically untractable model then demonstrates that the pace of technical advance will depend on the balance of power between management and workers.
3.1 Techno-organizational designs and innovation
Figure 1 shows how the technology and organization of a firm is conceptualized in the model. It is assumed that the activities of a firm produce an output with certain technical characteristics. These in turn generate services and eventually value to the customers of the firm (Saviotti and Metcalfe, Reference Saviotti and Metcalfe1984). In Figure 1(a) these technical characteristics are represented by θ1 to θ4 which are produced by routines m 1 and m 2. Footnote 2 More generally, we will say that the technology of a firm consists of a set of n t routines m i grouped by means of n t−1 administrative routines maj into a techno-organizational design  that produces a given vector Θ of k technical characteristics of the final output. As the division of labor is allowed to vary over time nt carries the time index t.
Decomposition in the technology-characteristics map: (a) a simple map with four technical characteristics θ1 − θ4, four tasks grouped into two activities m 1 and m 2. (b) Neutralizing the effect of feedback loops through decomposition and introduction of the coordination (administrative) routine ma 2

Together, the technical characteristics meet defined customer needs in the market where the firm operates, and we assume that a product is viable in the market if, and only if, all the technical characteristics are delivered. Hence, production is subject to the condition that all produced technical characteristics θh must correspond to the market vector Θ, or ∪kh=1〈θh〉 = Θ. The set  corresponds to one techno-organizational design out of a finite design space
 in use at time t, which the firm explores by changing the organization of production. Each of the mi routines present in a design consists of λi, dt tasks,
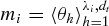 . The number of tasks λi, dt is allowed to vary across routines and it is directly proportional to the number of technical characteristics produced by that routine. So, if a routine produces λi, dt characteristics, it will consist of the same number of tasks.
Near-decomposability and performance In order to introduce the idea of near-de-com-po-sa-bi-li-ty, we assume that, on the one hand, the performance of a routine mi is not affected by any other routine ml, l ≠ i. On the other hand, we posit that all λi, dt tasks comprising a routine are non-separable, i.e. the performance at time t,  , of any task h in routine mi affects the performance of all other tasks in this routine, while its own performance is in turn affected by all other tasks in mi. Therefore, on the level of routines, optimization by stages is excluded as positive and negative feedback loops between the tasks exist, while across routines it is possible. This reflects a situation that is, for instance, typical in team production as discussed in the introduction. So, if one member performs under par, the work efficiency of all other members is affected. However, entire teams can be replaced. Figure 1 summarizes these assumptions. If the performance of the task producing characteristic θ3 in routines m 2 is changed, feedback loops may cause the performance of the task producing θ4 to change as well, making any improvement of the performance of the entire routine m 2 more difficult.
We assume that the performance ηh,t of every task h in any production routine in the firm is measured by a productivity index such that ηh,t ∈ [0, 1]. We also assume that there is a fixed general technological frontier which is equivalent to saying that the technological landscape does not change over time but that the division of labor is a means to explore it. Consequently, simulations for different parameter settings are directly comparable, and no rescaling of past performance draws is necessary. Given these conditions in the simulations we then draw the performance value ηh,t for each task from a uniform random distribution such that ηh,t → Uniform[0, 1]. The performance of a task represented through its labor augmenting effect is then calculated as  and the average productivity for a given labor input in routine mi is then the average over all tasks,
 .Footnote 3 The assumption of non-separability in a routine requires that if the firm tries to improve the performance of any of the λi, dt tasks in a routine, λi, dt values have to be re-drawn and a new
 has to be calculated.Footnote 4 Routines consisting of a higher number of tasks are therefore more difficult to improve than smaller ones. The number of routines nt is then a measure of the degree of decomposition of a specific design dt.
Hierarchy and new coordination routines In Figure 1 (b) the problem of strong complementarity within routine m 2 is resolved by splitting it into two distinct routines, m′2 and m 3, each focused on exactly one task of the original routine. Hence, any attempt to change the performance of m′2 producing θ3 will leave m 3 producing θ4 unaffected. This implies that an optimization by stages is now possible for these two routines. The ensuing coordination problem between the two new routines, which was formerly internalized in routine m 2 is solved by introducing a coordination mechanism such as an organizational and/or technical interface that neutralizes the feedback. One can think of these as administrative routines needed to coordinate and control the operations of two shop-floor processes. In Figure 1 they are represented by the coordination routines maj. Thus, ‘architectural’ knowledge on a production routine is moved to the management and integrated in an administrative routine, maj. The subset of coordination routines  therefore captures the ‘architecture’ of an organizational design dt, i.e. the knowledge about the relation between single production routines mi. There are nt−1 coordination routines maj, as we assume that one administrative task is required to coordinate and neutralize the feedbacks between any pair of production routines. Given this assumption, at any time the total number of routines in a design is then ntott = 2nt − 1.
With the increasing decomposition of the production routines, the weight of coordination tasks as related to productive activities increases. If these are costly, then overhead costs resulting from the process of decomposition will rise relatively to the cost of productive activities. We will assume that the overhead costs are an increasing function in the number of coordination routines, and that this happens at an increasing rate. These costs are bounded from above by the maximum decomposition of the production routines, nmax=k. Hence, the more production routines have to be coordinated, the more knowledge about the production process itself is required on the level of the administration, and the more expensive the administration becomes. In what follows we will ignore potential problems of interdependence and feedback mechanisms on the level of the administrative or coordination routines.
Exploration of the design space by the firm The management of the firm is assumed to use a set of innovation strategies to explore the space of techno-organizational designs  . The strategy space S=(s 1, s 2, s 3) consists of three innovation activities, each of which is used with probability μj,t at each time step t. The three strategies are given by learning by doing, s 1, by the decomposition (or splitting) of a routine into two smaller ones, s 2, and by job-enrichment (or integration) strategies where two routines are reorganized into a larger one, s 3.Footnote 5
Learning by doing may be thought of as management measures aimed at improving the skills and knowledge of team members. This strategy leaves the structure of the techno-organizational design untouched, i.e. the number of activities and the set of technical characteristics influenced by each does not change. Furthermore no capital investment is needed. The improvement is the result of a cumulative process. The performance of existing routines is simply improved by a ‘learning’ draw for all tasks in a routine. If the performance improves, it is adopted – a decision rule known as hill-climbing in the original NK-model (Kauffman, Reference Kauffman1993).
The second and third innovation strategies change the techno-organizational design of the firm. In the case of the decomposition strategy, the management increases the separability of its production technology by identifying and neutralizing complementarities that bind tasks in a routine. If the overall performance of the firm improves, the new design is kept. These performance improvements may be due to the reduction in hold-up problems in production and, as a consequence, of a more efficient utilization of workers and machinery as well as a higher learning rate on the job due to the specialization of productive activities and the use of more specialized and effort-saving technical equipment (Lazonick, Reference Lazonick1990: 333ff). Finally, the job-enrichment or integration strategy involves the selective acquisition of links between routines. It is the reverse operation of splitting. Performance improvements under this strategy may be thought of as the realization of synergies. In terms of Figure 1, this implies that the two distinct routines, m′2 and m 3 in Figure 1 (b) are rejoined to m 2, and ma 2 is removed to get Figure 1 (a). However, the performance values of routine m 2 after enrichment are redrawn and performance is recalculated. Therefore, enrichment or integration is not just a simple reversal of a splitting operation.
Investment and innovation When the firm changes its techno-organizational design as a consequence of splitting and enrichment strategies, it will have to invest, i.e. it will either need to upgrade existing machinery or replace old capital vintages altogether. This implies that the capital equipment in use is always commensurate to the degree of specialization of the routines. In the present model, specialized capital equipment is a catalyst for the introduction of changes in the techno-organizational design. We will assume that the firm starts with an initial capital stock K 0 given by a specific capital-output ratio which reflects the technological base of the industry in which the firm operates. We define K 0 = R 0κ, where R 0 is the initial revenue of the firm and κ is the assumed capital-output ratio. In order not to overburden the model with details, we assume that the management continuously replaces the existing capital stock, given by the initial capital stock and past net investment, because of wear. Net investment takes place only as a consequence of splitting and enrichment strategies. We also assume that output and capital in this case grow at the same rate. Therefore, the investment required to install a new techno-organizational design d′ is given by
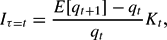
where the index τ indicates that net investment takes place at irregular points in time τ, qt is the physical output produced at time t, and E[q t+1] is the expected output at time t+1 if an innovation is adopted. This way of modelling the relation between output growth and net investment implies constant returns to scale. At some point in time t the value of the capital stock is then given by Kt = K 0 + ∑τI τ, where τ are the points in time in which net-investment has taken place. I τ may also be thought as of capturing the fixed cost for developing a specific techno-organizational design, that also requires capital of a specific quality.
3.2 Workers' effort choice
Once the management has chosen an innovation move, we assume that this is announced to the staff and the workers then decide upon the effort they want to put into their work if the innovation is adopted. The effort choice of workers is specified following the general ideas outlined by Bowles (Reference Bowles1985). Workers may oppose innovation through the reduction of work effort or even sabotage.
To model this, we have to specify how wages are set. We assume that the average wages paid per unit of output in a routine i, w i,t, are a function of the number of technical characteristics λi,dt produced in it, which captures also its skill profile. Therefore, more-qualified workers, i.e. those able to carry out a larger number of tasks, get a higher wage. The firm can control this variable endogenously by changing the division of labor and simplifying the work. The level of wages also depends on a parameter σ ∈ [0, 1] that reflects the labor market situation. It represents the extent to which the outside labor market situation affects the bargaining position of workers within the firm. We specify it here as the risk of not being able to find a job with another employer for the same qualification profile. If, for instance, σ is small, a firm will find it more difficult to impose wage cuts or find workers with similar skills if the staff quits.Footnote 6 Finally, we also assume that mechanisms are in place which enable workers to oppose attempts by the management to fire employees. This is captured by parameter prout ∈ [0, 1], which reflects the probability of being dismissed if one is found disobeying the directives of the management. Depending on how powerful these mechanisms are, or how powerful workers are in relation to the management, the chances of a worker being dismissed if found to be shirking will vary. If, say, legislation is in place that makes hiring and firing difficult, the probability of a worker being dismissed if found to be shirking is low. Alternatively, if the workers' response to management actions is individualistic, the management can fire workers whose performance is below average or who hinder changes to the production process. Whereas, if the response is ‘collective’, for instance in the form of repeated collective and simultaneous exits, the sacking of workers for inadequate performance may be prohibitively expensive. Therefore, parameter prout captures the relative power of the management, as opposed to that of the workers, to control the relation between work (effort) and pay. Wages will be higher when the probability of being fired is lower. Wages are therefore a function of the skill profile of an activity, the labor market situation and the power relation inside the firm, w i,t ≡ w(λi,dt, σ, prout). The following restrictions are imposed in order to have a well-behaved wage setting function. We assume that w(λi,dt, σ, prout) increases with λi,dt at an increasing rate and that it is bounded from above by the maximum number of technical characteristics k a firm produces, sup wi,t = w(λi,dt = k,σ,prout). Furthermore, for every given λi,dt wages fall if unemployment increases at a decreasing rate. Hence, wages are bounded from below by inf wi,t = wmin, where wmin is the income/unemployment benefit the worker would gain with certainty if dismissed.
To summarize, given that the innovation choices of the management affect wages, workers have two options for reacting to an unwanted innovation decision made by the management. First, they may opt to quit the firm and seek employment elsewhere. The value of the ‘exit’ option depends on the labor market situation captured by σ. Workers will be more willing to accept wage cuts if the chance of not getting an equally well-paid job in another firm is low and they will be more likely to quit if it is high. The second option is to stay in the firm and reduce their work effort. This will be contingent on three factors. It will depend on the management's capability to detect shirking workers, its capability to fire a shirking worker, which depends on how well organized labor is on the shop-floor, and the cost to the worker of being fired. Hence, we call this the ‘voice’ option.
The link between the innovation choices of the firm and the wage-setting mechanism is modelled as follows. Assume that the probability of detecting shirking workers depends on the complexity of the routine of which they are part. Simpler routines are easier to monitor, while the performance of more complex ones is difficult to assess. Then, the probability of being detected, pr δi,t, is given by the probability that workers' behavior is observed by the employer, pr 0i,t. This probability is directly proportional to the complexity of the routine in which they are employed. If we define a variable νi,t ≡ λi,dt/k, then the probability of observing workers not complying with management directives is given by pr 0i,t ≡ (1 − νi,t). Hence, the probability of the management detecting idle workers in activity i after an innovation is then pr δi,t+1 = pr 0i,t+1(1 − e t+1), where e i,t, e i,t ∈ [0, 1], is the average effort by workers in routine i.
The cost of dismissal to workers in routine i depends on the probability of finding a comparable job outside the firm and the probability of not finding such a job and having with certainty to settle for a lower-paid job or unemployment benefits, i.e. the expected wage if dismissed is given by E[wexit i,t+1] = ((1 − σ)w i,t − σwmin). The expected wage in activity i is therefore

where the first term is the expected wage if not detected, the second term is the wage if detected but not fired, and the last term represents the wage if detected and consequently fired. The value of w i,t+1 is determined through the innovation strategy announced by the firm at the beginning of the period. If the disutility of work to workers is quadratic and given by  , and the expected pay-off is given by
 , then pay-off maximizing workers will choose a work effort
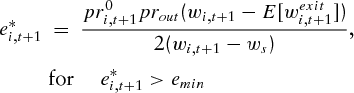
in each activity i. The restriction e*i,t+1<emin reflects the assumption that for every techno-organizational design a firm is able to elicit some minimum effort from workers. Parameter ws corresponds to a subsistence wage. Working up to this income level will not be felt as a burden. Given a specific effort level e*i,t+1 the labor coefficient per unit of production in activity i is then determined by l i,t+1 = 1/e*i,t+1.
3.3 The cost and adoption of new designs
The specification of the technology and organization of the firm, as well as the labor process presented in the two previous sections is now embedded into a standard model where the firm faces a downward-sloping demand curve and Say's law holds. The firm maximizes profits in each period for given the costs. As we exclude rational expectations, the firm reinforces the innovation strategies that have yielded the highest cost reduction in the past. Hence, the behavior of the firm over time is given by a changing probability distribution over her three actions, st = [μ1,ts 1μ2,ts 2μ3,ts 3]′, with μ1,t + μ2,t + μ3,t = 1. The probability distribution changes as the innovation policy mix evolves through reinforcement learning, given some initial probabilities μj,t=0. The dynamic decision problem of the firm is then to find a sequence of adoption of techno-organizational designs that maximizes the flow of profits over time.
Cost of production for a given design dt We get the variable costs of production by aggregating the unit cost of production in a routine  over all routines. It is weighted with the number of technical characteristics affected in relation to the total number of technical characteristics produced, i.e. with λi,dt/k. Taking into account overhead costs, we get

where  is the weighted average unit wage in all routines,
 is the weighted average labor coefficient, and
 is the weighted average performance factor in shop-floor routines. As the division of labor changes and new coordination routines are introduced, the total number of routines increases and their relative weight in unit cost as compared to production cost changes. Therefore, the cost terms in (2) need to be weighted as well. For this purpose we introduce zt, which is defined as zt=k/(k+(nt−1)).
In each period the firm incurs capital costs. If capital prices don't change and capital costs are debt financed and paid off in annuities, capital prices to the firm remain constant over time as long as interest rates and pay-back periods also remain constant. If the pay-back period is also equal to the scraping period, then, for a given capital stock Kt, an annuity

is paid each period, where r is the interest rate and Δt is the duration of the pay-back period. If the interest rate is also equal to the discount rate, then the revenue generated by an investment I τ and the cost of this investment are valued at the same rate, and discounting issues can be neglected. The annuity form in equation (3) implies that the sum of interest and amortization charges are equal in each period and capital costs are therefore equal over the life of the investment.
Profit maximization and the adoption of new designs The profits for any given techno-organizational design dt are

and the inverse demand the firm faces is given by

Is is a constant reflecting the intercept of the demand function and ε is the price elasticity of demand with ε>1. During each period t the firm sets quantities in order to maximize its profits, i.e. ∂Πd,t(st)/∂qt = 0, such that the optimum quantity of production is given by
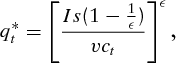
Hence, the maximized profits for a techno-organizational design dt at time step t are given by

The decision to adopt an innovation will depend on its profitability. If the firm discovers a new organizational design d′, it compares its expected pay-off given the expected reaction of workers to the announced innovation project with the pay-off it is able to make using the old design dt

From this follows the adoption rule for any organizational innovation. The firm compares the pay-off of the current techno-organizational design with the pay-off it expects from using the innovation. The adoption rule is then given by

i.e. whenever the expected profits from using an innovation are larger than those for the given techno-organizational design, then the innovation will be adopted.
Reinforcement of successful strategies The management learns about the best strategies for reducing costs in the space of techno-organizational designs, as it explores the design space. The reinforcement learning we apply is identical to the one studied by Arthur (Reference Arthur1993), where each of the strategies is allocated strength based on its past contribution to the performance of the firm

where ΔΠ*t = Π*t − Π*t−1 indicates the change in the performance improvement between two time steps t and t−1 where strategy sj was used. Equation (10) reinforces the strategies that best maximize the stream of profits.
Results
The simulations reported in this section are used to study the behavior of the model changing in values of the parameters σ and prout, reflecting different institutional environments as discussed in Section 3.2. Therefore, the results present outcomes of the process of technical change for economies starting under the same competitive and technological conditions but with a different institutional context. In the appendix to this paper we report on the robustness of these results to changes in the other parameters in the model. All parameter values and the functional form for wages and overhead costs as used in the simulations are reported in Table 1 in the appendix. The results present averages over 100 differently seeded runs. Each run consisted of 350 iterations. In other words, we track the evolution of a population of 100 firms with different initial performance values over time and then calculate averages over the single observations. During each iteration one routine in the technology-characteristics map was drawn randomly and an innovation strategy with probability μj,t was chosen. In dependence on the selected strategy performance values for the selected routine were re-drawn. At the same time, the value of the productivity frontier, i.e. our one-dimensional fitness measure, was kept unchanged. Please note that, as the model is specified, firms do not interact strategically. Thus, the present simulation model is agent-based, but it is not an interacting agents model.
4.1 Behavior of the model over the parameter space
Figure 2 shows contour plots for the values for productivity and unit cost to which the model converges for any parameter combination spanned by the parameters σ, capturing the strength of the ‘exit’ option for workers, and prout, capturing the strength of their ‘voice’ option. While the two plots in the first row show the behavior of unit cost and the labor coefficient, the three plots in the lower row of Figure 2 show how the equilibrium patterns for unit labor cost and the labor coefficient shown in the first row are generated through the interaction of three distinct effects. The first effect, captured by the first plot in the lower row of Figure 2, is the Babbage effect, that captures the interaction effect of the division of labor and the labor market situation (as discussed in Rosenberg, Reference Rosenberg and Rosenberg1994). It reflects the downward pressure, the reserve army effect and the effect the increasing division of labor have on wages. In the simulations this effect is the result of the choice of the functional form for the wage-setting equation, as shown in Table 1. The second effect is the impact the increasing division of labor has on learning by doing as discussed in Section 3.1. This is represented by the second plot in the lower row (productivity factor). Finally, there is also the social control effect that reflects the impact of changes in social control on the effort choice of workers, and hence on the labor coefficient as discussed in Section 3.2.
Model behavior: exit and voice in the division of labor. The scales next to the figures show that dark areas indicate low values, light areas indicate high values. Values in the lower right corner of each figure represent outcomes of simulation runs with parameter constellations that are very favorable to the management and owners of the firm

In Figure 2 the following aspects are of interest. First, costs are lowest, whereas productivity and the division of labor are highest when voice and exit are unfavorable for workers, i.e. when the competition on the labor market is high (the probability of finding the same job with another employer is low) and where workers' relative power as opposed to that of the firms is low (the chance of being fired if detected shirking is high). Second, the Babbage effect that reflects the downward pressure the reserve army effect and the increasing division of labor have on wages, is partly countervailed by increasing overhead costs as voice and exit are increasingly unfavorable to workers. This is why the level of equilibrium wages does not fall any more for σ> ≈ 0.5 and prout> ≈ 0.5. Beyond this range the division of labor increases drastically and this in turn increases coordination costs, however, as the plots for the effort choice and productivity show, this is outweighed by higher productivity and higher effort inputs. Finally, it is also interesting to observe that the learning by doing effect is not as strong for values of σ and prout close to one, as in the range for 0.5 < σ < ≈0.9 and 0.5 < prout < ≈0.7. Again a look at the plot for the effort choice shows why. When σ and prout are close to 1 the social control is so high that in this range a higher division of labor is adopted even if this organization of work is not so productive in technical terms as less decomposed ones. The loss in technical efficiency is more than balanced by a higher work effort. This is also apparent from Figure 4 that shows the average learning behavior of firms in the model. In the plot in the middle we see that in the parameter range σ> ≈ 0.9 and prout> ≈ 0.7 splitting is the innovation strategy chosen with the highest probability.
Figure 3 shows how the results presented in Figure 2 translate into profits as worked out in Section 3.3. It presents also other indicators of technical development such as the degree of mechanization (the capital – labor ratio) and the average degree of decomposition (i.e. the average of the number of activities nt in the population of firms). The division of labor measured by the number of activities into which the production process is subdivided is also highest in this case. This in turn implies that the ratio between variable overhead and production cost, as shown in the left plot of the top row of Figure 3 is highest where the division of labor is highest, too. Administrative costs rise as with a more decomposed production processes more coordination is necessary. Similarly, the degree of mechanization (i.e. the capital – labor ratio) is also highest when the division of labor is highest, due to the assumption that capital is a catalyst of the reorganization of the production process. The results in Figure 3 also show that the degree of mechanization is highest where the labor costs per unit of output are lowest. This contradicts standard theory, which postulates that production is either more labor intensive or more capital intensive depending on the relative costs of labor and capital. However, as Olmstead and Rhode (Reference Olmstead and Rhode1993) have argued, if capital is the means by which labor can be made cheap, then production might be very capital intensive, despite labor being cheap. In this case – as control over the labor process depends on both machinery and an administrative hierarchy to coordinate activities – the production process is not only more capital intensive, but also more ‘overhead intensive’.
Economic indicators for the firm. See Figure 2 for an explanation of the tags and the coloring

Figure 4 shows to which innovation policy mix learned through the updating mechanism presented at the end of Section 3.3 the model converges for any given ‘exit’ and ‘voice’ options. Decomposition or splitting and learning by doing are by far the most important innovation strategies. The integration (or enrichment) strategy is rarely pursued. In our model, decomposition is used most intensively when ‘exit’ and ‘voice’ are unfavorable from the perspective of the workers. In this case the strategy develops its full potential both in terms of its effect on the effort choice by workers and in terms of its effect on technical improvements. Learning by doing is instead pursued more frequently when the ‘exit’ and ‘voice’ options are favorable to workers. Job enrichment in turn is not a real option for firms. It partly reverses the benefits of decomposition for firms, as it leads to higher wages and lower control. Therefore, enrichment is only rarely chosen and, when it is chosen, this is mainly in order to reverse decomposition draws.
Learning behavior of the firm. See Figure 2 for an explanation of the tags and the coloring

To conclude, we may underscore that the results form our model show how the interdependence of social and technological/cognitive factors shapes the outcome of the process of technical change. Therefore, as modelled here, technical and organizational change is the outcome of a social process. As the model shows, technical change in terms of productivity and cost reduction leads to the highest profits and highest growth when social conditions give the management greater leeway in controlling the production process.
4.2 Comparative analysis: interpreting the historical evidence
In line with the historical evidence discussed in Section 2. in the simulation runs presented in this section we have set the model parameters in such a way that they capture the two main stylized facts with respect to the labor institutions that were in place in the period studied here: (1) the firing of workers was much easier for the management of a firm in the US than in Britain, and (2) the risk of a skilled worker being displaced from his learnt profession as a result of deskilling technical change was much higher in the United States than in the United Kingdom, because of institutional checks on the reserve army effect. Hence, we have set prUKout = 0.1 for the ‘UK’ runs and prUSout = 0.9 for the ‘US’ runs, as well as σUK = 0.1 for the UK and to σUS = 0.9 for the United States. All other parameters were kept as indicated in Table 1. This means that the runs present the development of two economies over time starting from the same initial conditions except for the parameters capturing the labor relation. However, this does not imply that the US and the UK economies were identical from the start, or that the ‘true’ values for parameters prout and σ were indeed that far apart. A large body of research (summarized for instance in David, Reference David1975, chapter 1) has shown that other factors, such as differences in resource endowments played a major role. Nevertheless, the present exercise is to assess whether differences in the organization of the labor process are sufficient to induce patterns in technical change similar to those observed for the two countries. The parameter values do not necessarily correspond to exact empirical values name tags in the figures are in quotation marks. The sensitivity of the outcomes with respect to the setting of initial conditions are discussed later.
Figure 5 illustrates the development of productivity and its components over time. In the top row we show the development of unit costs and productivity (labor coefficient) over time. The middle row shows the effect of the ‘unbundling’ of skills or Babbage effect on wages (left) and the productivity factor due to technical change (right). In the bottom row, instead, we see on the left the division of labor measured by the number of activities needed to produce a given vector of technical characteristics and on the right the effort elicited from workers in terms of labor requirement per unit of output.
Productivity development and the division of labor for the ‘US’ and the ‘UK’ case. The runs show averages over 100 runs (thick unbroken and dashed lines). The narrow lines show the upper and lower 99% confidence interval for the averages of the runs

The model seems to capture the development patterns of the UK and the US as sketched in Section 2. Unit costs and the labor coefficient fall quickly in the ‘US’ setting, where the division of labor grows fast to reach a stable degree of decomposition of productive activities. An interesting aspect in the figures is the development of productivity induced by technical change. It initially grows faster in the ‘UK’ scenario, but is eventually overtaken by the ‘US’. This would suggest that, in terms of technical change, the ‘UK’ initially fares better. The reason for this can be seen in the plot representing the Babbage effect as well as the plot reflecting the elicited effort choice by workers. The management initially chooses any decomposition strategy because this allows it to cut costs and extract more exertion from workers, even though from a technical point of view the less-decomposed design performs better at first. This seems to support Marglin's claim (Marglin, Reference Marglin1974) that a high division of labor and the adoption of capital-intensive methods of production is at first mainly driven by the aim to control workers and increase the intensity of work rather than by purely technical considerations. Nevertheless, as time goes by the techno-organizational design characterized by a higher division of labor also becomes more productive from a technical point of view, as productivity increases can be achieved more easily through learning by doing.
Figure 6 characterizes technical change for the ‘US’ (left) and the ‘UK’ (right) scenarios. The upper row shows the development of unit capital cost compared to the development of unit labor cost in terms of their values at the beginning of the run, i.e. at t=1. The lower row displays only the development of the degree of mechanization measured by the value of the capital stock in terms of the labor input. We see that the bias of technical change in the ‘US’ scenario is neutral, while it is capital saving for the ‘UK’ runs. The degree of mechanization is about five times higher for the ‘US’ runs than for the ‘UK’ runs. This is due to our assumption that capital is a catalyst for the adoption of new techno-organizational designs. As firms in the ‘US’ scenarios push the division of labor, the capital stock per worker also increases. At the same time due to the higher effort elicited from workers, the labor input per unit of output falls. The neutral bias pattern for the ‘US’ scenario deviates from empirical observations that have classified technical change in the US as labor saving and capital using. The model has omitted important aspects of American technical change, such as the Ames-Rosenberg hypothesis (Ames and Rosenberg, Reference Ames and Rosenberg1968; David, Reference David1975: 88), which postulates that a more capital-intensive method of production also involves a greater use of resources. Nevertheless, the relative position between the two scenarios corresponds with the relative position in the direction of technical change observed for the two countries in the period under consideration.
Relative cost saving over time and degree of mechanization. The left quadrants show results for the ‘US’ case, while the right quadrants show results for the ‘UK’ case

Finally, Figure 7 displays the development of the innovation policy mix of firms over time (top row) and the relationship between the rise of (variable) overhead costs in terms of production cost and the development of value added. As in the previous figures the left column shows the results for the ‘US’ scenarios and the right column the results for the ‘UK’ scenarios. We observe that the firms in the ‘US’ scenario quickly reinforce the decomposition strategy. They very rapidly start to decompose their production processes. The importance of this strategy then falls over time, as the now smaller routines can be improved more easily (and more cheaply) through learning by doing. Nevertheless, the decomposition of activities remains the strategy most likely to be chosen. Similarly, in the ‘UK’ scenario, firms also initially start decomposing, but reinforce learning by doing much earlier. Eventually, the two strategies converge to the same weight in the innovation policy mix of firms in the ‘UK’ scenario. In the ‘US’, firms engage in decomposition very quickly and then improve the smaller routines through learning by doing. In the ‘UK’ scenarios, by contrast, the evolution is more measured, and decomposition is a rather slow process. In both scenarios, the enrichment strategy plays only a marginal role. This is not surprising as it works in the opposite direction to the mechanism to elicit higher work effort. Therefore, Coombs' (Reference Coombs1978) critique of Braverman's view, which states that the Babbage principle is the dominant strategy chosen by firms to shape the labor process is – at least under the assumptions of this model – unwarranted.
Strategy enforcement over time and administrative overhead. The left quadrants show results for the ‘US’ case, while the right quadrants show results for the ‘UK’ case. In the upper two quadrants the dotted lines represent the ‘splitting’ strategy, the dashed lines the ‘enrichment’ strategy and the solid lines the ‘learning-by-doing’ strategy. The narrow lines represent the 99% confidence interval for all runs

The lower row of Figure 7 in turn plots the relative importance of overhead costs against the value added generated by the firm. It is apparent that rising overhead costs positively correlate with increasing value added. Overhead costs imply that the control over the production process on the part of the management increases and this higher control implies the extraction of more work from the labor force, as well as the reaping of cost-cutting potentials through the Babbage principle. This is very much in line with empirical findings for the US (e.g. Reinstaller and Hölzl, Reference Reinstaller, Hölzl, Foster and Hölzl2004). Furthermore, a more extended division of labor also implies a higher pace of technical change due to the more near-decomposed design of production, which allows the production process to be optimized by stages. Clearly, overhead costs are not as high for the ‘UK’ runs, but the same relationship holds. Nevertheless, the character of the labor process in these runs prevents firms from pursuing this path. The ‘administration’ (or the costs representing it) is much larger in the ‘US’ scenarios. The results presented here capture a good deal of the patterns of technical change that are characteristic of the US and the UK. Overall, they show that production and technical change is a social process in which social relations defined by the interests of opposing social groups shape the historical patterns of economic development. Two economies starting with identical economic and technological conditions but differences in the social relations of the labor process may very well end up on different technological paths.
Conclusions
This paper lends weight to the view that the development of a near-decomposable organization of the production process supports innovation and technical change. Nevertheless, our results suggest that this may not depend exclusively on the role which problem decomposition plays in the process of generating solutions and new knowledge for a given set of technical problems. The development of near-decomposable organizational structures also hinges upon problems of social control. Such organizations allow all activities in the firm to be controlled more accurately through the minimization of hold-up problems. The results presented in this paper show that the near-decomposability and performance of techno-organizational designs is highest when the exit and voice options for workers do not allow them to assert the status of a residual claimant. They support the idea that the rise of administrative hierarchies that developed along with the establishment of an extensive division of labor on the shop-floor also helped them to increase their control over the production process, in addition to promoting technological efficiency. We therefore conclude that, at any point in time, conflict between managers and workers over the pace and conditions of work which a unit of money can buy plays an important role in the determination of wages, factor proportions and factor productivity.
In its partial view, the model has neglected a number of important aspects that play an important role in technical development and structural change, and this calls for an interacting agents model. For instance, for the sake of simplicity we ignored the fact that agents can coordinate their activities in such a way that the exogenous parameters would become endogenous. We also neglected problems of varying capacity utilization. Furthermore, we did not consider the feedback effects of wage cutting on demand or the average skill level of workers. One should therefore not incur a fallacy of composition and draw the conclusion that weak labor institutions are favorable to technical change. We leave it to further research to study these aspects more in depth.
Appendix
(A) Reinforcement learning
Each of the strategies is allocated strength according to its past contribution to the performance of the firm
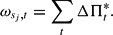
The sum of strengths over all strategies is therefore given by

and accordingly the probability μi,t to choose strategy si at time t is given by

To put equation (11) into a dynamic context define for convenience ψj,t = ΔΠ*t and Ψt = ∑jψj,t, then

By extending terms and regrouping we get

which after defining α = (ζt + Ψt)−1 yields

By replacing Ψt and ψj,t we get equation (10).
(B) Parameter values and functional forms for simulations
Parameter values and functional forms used in the simulations

(C) Robustness of the results to parameter changes
The results in Section 4 were generated by keeping some parameters constant, with the purpose of studying the behavior of the model under different institutional settings and otherwise identical initial conditions. The reported convergence results are generally robust to changes in these parameters, even though the levels of the variables may shift and the speed of convergence may change. Here we briefly discuss the outcomes of simulation experiments which analyze the sensitivity of the results reported in the paper to changes in the parameters listed in Table 1.
In specifying the techno-organizational design parameter, we assumed that the initial design had maximum complexity for a given number of technical characteristics and that this design could indeed be fully decomposed so that one task would produce exactly one technical characteristic. The results may therefore be sensitive with respect to changes in the initial degree of decomposition (i.e. the number of activities) as well as with respect to the assumed decomposability (i.e. the smallest size to which activities can be decomposed). Both assumptions affect the division of labor and learning behavior. Changes in the maximum degree of decomposability of a technology have two effects. First, when it is favorable for firms to decompose they will do so, but this process will stop earlier. Hence, the decomposition strategy loses importance and productivity advances are mainly achieved by learning by doing. Therefore the latter will dominate other strategies towards the end of the simulation run. Furthermore, compared to the reference runs, the administrative overhead, and the degree of mechanization will be lower where decomposition is at its highest. Changes in the initial degree of decomposition under the assumption of full decomposability of the initial techno-organizational design will also affect the weight of the strategies in the innovation policy mix. For very high initial decompositions and for the given convexity assumptions of overhead costs, the weight of enrichment strategies increases. Overhead costs constrain the maximum depth of the division of labor on the shop-floor. Therefore, as argued by Reinstaller and Hölzl (2004), at a certain stage administrative activities become a focus of the innovative efforts of firms.
Two parameters are of importance in determining the effort choice of workers. The first is the subsistence wage ws and the second is the minimum effort level e 0 imposed on the effort choice of workers. The subsistence wage influences the denominator of equation (1). If the subsistence wage is smaller than the dismissal wage, then the maximum effort level that can be elicited from workers is lower than if it is larger than the dismissal wage. Hence, the choice of ws as a fraction of the minimum wage wmin, which determines the lower bound in the dismissal wage, allows us to determine the maximum effort level that can be elicited from workers. Therefore, if the the minimum wage is below subsistence level, workers will choose higher effort levels for every exit and voice constellation. It is necessary to impose some minimum effort level in equation (1) as the chosen effort levels are very small for parameter constellations reflecting very favorable conditions for workers, leading to very high labor coefficients and, as a consequence to a prohibitively expensive production. Therefore, if the value of parameter e 0 is lowered, the labor coefficient goes up. At very small levels it is so high that no production takes place at all. To impose a lower bound to e is therefore equivalent to saying that there is no free lunch for workers. Capitalistic production is only possible if a minimum effort is elicited from workers.
The parameters affecting the cost of capital i.e. the capital – output ratio, the interest rate and the pay-back period have the expected effect of the process of technical change. If the costs of capital are high, the innovation strategies involving capital investment are penalized. This means that when capital is more expensive, the division of labor, productivity, and the degree of mechanization are generally lower than in the case of the reference runs discussed in the previous section. Hence, access to cheap external capital and therefore financing institutions is – in addition to the social setting – an important factor in the innovation process in this model. Finally, changes in the demand parameters ε and Is are very much in line with standard theory, as they do affect the level of profits and indirectly affect the investment behavior.
In comparing the development patterns of the US and the UK, one may legitimately wonder whether the ‘true’ values, in particular for σ, have really been that far apart, and whether the results of the comparative simulation runs would hold if the parameter values for σ and prout were not as different as we have set them. Simulations show that, as long as one of the two countries lies within the quadrant enclosed by parameter values 0.5 ≤ prout < 1 and 0.5 ≤ σ < 1, and the other one lies outside this quadrant, the outcomes we have presented in Section 4 will hold. This is also apparent if we examine Figures 2 and 3, which show the values of the endogenous variables to which the model converges. They illustrate that the division of labor and the labor coefficient begin to increase steeply in the specified interval.
 is normalized by
 , i.e. the average productivity at t = 1.



