Introduction
The white grub beetle, Dasylepida ishigakiensis Niijima et Kinoshita (Coleoptera: Scarabaeidae), is one of the most destructive sugarcane pests on the Miyako Islands in Okinawa Prefecture, Japan (Sadoyama et al., Reference Sadoyama, Oroku and Nakamori2001). The larvae of this species eat the roots and underground stems of sugarcane and often kill the plants before harvest. Recently, this species was also found infesting the roots of hay grass and causing serious damage to hay production on these islands (Arakaki et al., Reference Arakaki, Hokama, Yamaguchi and Wakamura2013). Control of this species is essential for improving agricultural production in this area; however, because it spends most of its life in the soil, the use of pesticides is often ineffective. Furthermore, pesticides have the potential to pollute underground water, which would threaten the supply of safe water to the residents of the islands. Therefore, an alternative to pesticides should be developed to control this beetle on the Miyako Islands.
Female white grub beetles, D. ishigakiensis, emit a mixture of (R)- and (S)-2-butanol enantiomers. The former has been identified as their attractive sex pheromone (Wakamura et al., Reference Wakamura, Yasui, Akino, Yasuda, Fukaya, Tanaka, Maeda, Arakaki, Nagayama, Sadoyama, Kishita, Oyafuso, Hokama, Kobayashi, Tarora, Uesato, Miyagi and Osuga2009a , Reference Wakamura, Yasui, Mochizuki, Fukumoto, Arakaki, Nagayama, Uesato, Miyagi, Oroku, Tanaka, Tokuda, Fukaya, Akino, Hirai and Shiga b ). Mating disruption using synthetic sex pheromones for this species was conducted by permeating sugarcane fields with a racemic mixture of 2-butanol (rac-2B, 1:1 mixture of (R)- and (S)-2-butanol) (Arakaki et al., Reference Arakaki, Hokama, Nagayama, Yasui, Fujiwara-Tsujii, Tanaka, Mochizuki, Naito, Hongo and Wakamura2014). The offspring larval density in the treated fields was drastically decreased, almost to zero, in the following winter. The efficacy of mating disruption using their sex pheromones has been proven in our previous works (Yasui et al., Reference Yasui, Wakamura, Fujiwara-Tsujii, Arakaki, Nagayama, Hokama, Mochizuki, Fukumoto, Oroku, Harano and Tanaka2012; Arakaki et al., Reference Arakaki, Hokama, Nagayama, Yasui, Fujiwara-Tsujii, Tanaka, Mochizuki, Naito, Hongo and Wakamura2014).
The flight season begins in February, and the relatively warm evening, adults emerge from the soil for a short period of time to mate. When females succeed in mating, they burrow deep into the soil and never return aboveground (Arakaki et al., Reference Arakaki, Sadoyama, Kishita, Nagayama, Oyafuso, Ishimine, Akino, Fukaya, Hirai, Yamamura and Wakamura2004). However, females that fail to copulate because of effective mating disruption may return aboveground again several times for calling. We observed that for as long as females were alive, they would attempt to present the calling posture and to call mates (unpublished data). To improve our established mating-disruption method, which prevents males from reaching the calling females, it was necessary to analyse the sex pheromone emissions throughout the female beetle's reproductive life.
In our previous report, we observed a qualitative change in the sex pheromone emitted by laboratory-reared females (Fujiwara-Tsujii et al., Reference Fujiwara-Tsujii, Yasui, Wakamura, Mochizuki and Arakaki2012). The major component of the 2-butanol emitted by young females was (R)-2-butanol, but as the females aged, the component ratio favoured (S)-2-butanol, which inhibited male attractiveness (Fujiwara-Tsujii et al., Reference Fujiwara-Tsujii, Yasui, Wakamura, Mochizuki and Arakaki2012). If the age-dependent qualitative change observed in the laboratory-reared females also occurred in the field, aged wild females may not be able to attract males. In this study, we first determined the sex pheromone isomer composition of young (1st calling) and old (2nd calling, 2 days after 1st calling) virgin wild females. Second, we investigated whether the preference of male beetles shifts in response to the changed pheromone composition as the females aged. There is a possibility that older males can adjust their preference to a mixture of (R)- and (S)-2-butanol released from old females. We prepared lures of various R/S ratios of 2-butanol and tested their attractiveness to males. The behaviour of young and old males to those lures was examined both in a flight tunnel and in a sugarcane field on Miyako Island. Finally, we discuss how age-dependent changes affect mating disruption in D. ishigakiensis.
Materials and methods
Chemicals
(R)-2-Butanol (R2B) (>99% purity, >98% ee) was purchased from Wako Pure Chemical Industries, Ltd (Osaka, Japan), and (S)-2-butanol (S2B) (>98% purity, >98% ee) and 2-butanol (racemic mixture, rac-2B) (>99% purity, 0% ee) were purchased from Tokyo Kasei Kogyo Co., Ltd (Tokyo, Japan).
Lures
For the field trap tests, R2B, S2B and various mixtures of the two (R2B/S2B = 90/10, 80/20, 60/40 or 50/50) were heat-sealed in plastic tubes made of high-density polyethylene (HDPE) and ethylene vinyl acetate (EVA) copolymer (Shin-Etsu Chemical Co., Tokyo, Japan). The length of the tube was 1 cm, and its inner and outer diameters were 1.30 and 2.34 mm, respectively. The loading amount in each tube was approximately 12 mg (neat). We used the tubes as lures (Wakamura et al., Reference Wakamura, Yasui, Mochizuki, Fukumoto, Arakaki, Nagayama, Uesato, Miyagi, Oroku, Tanaka, Tokuda, Fukaya, Akino, Hirai and Shiga2009b ) and labelled them as R100 (R2B), R0 (S2B), R90 (R2B/S2B = 90/10), R80 (R2B/S2B = 80/20), R60 (R2B/S2B = 60/40) and R50 (R2B/S2B = 50/50).
Using the method of Yasui et al. (Reference Yasui, Wakamura, Tanaka, Harano, Mochizuki, Nagayama, Hokama and Arakaki2010), the quantity of 2-butanol isomer released from each lure was estimated in the laboratory to be approximately 49 ng min−1 at 23°C. The amount of 2-butanol emitted from the lure over 30 min was almost the same as the total amount of 2-butanol released from a single vital female's sole instance of calling (approximately 30 min) (Wakamura et al., Reference Wakamura, Yasui, Akino, Yasuda, Fukaya, Tanaka, Maeda, Arakaki, Nagayama, Sadoyama, Kishita, Oyafuso, Hokama, Kobayashi, Tarora, Uesato, Miyagi and Osuga2009a ; Yasui et al., Reference Yasui, Wakamura, Tanaka, Harano, Mochizuki, Nagayama, Hokama and Arakaki2010).
For the flight tunnel bioassays, we used HDPE lure tubes with inner and outer diameters of 0.84 and 1.54 mm, respectively. Lure tubes for flight tunnel bioassays were filled with 4.5 mg of 2-butanol, and estimated in the laboratory to release approximately 3.5 ng min−1 at ca. 23°C. R100, R90 and R50 lures were prepared; the latter two representing pheromone emissions from young (R90) and old (R50) females, as determined by Fujiwara-Tsujii et al. (Reference Fujiwara-Tsujii, Yasui, Wakamura, Mochizuki and Arakaki2012).
Collection and determination of the R/S ratio of 2-butanol emitted by wild females
We collected wild females from a sugarcane field on Miyako Island at approximately 16:00 JST on 5 February 2012. At that time, many wild individuals (males and females) were up near the soil surface and exhibited the ‘standby’ behaviour to monitor outside conditions (Harano et al., Reference Harano, Tanaka, Tokuda, Yasui, Wakamura, Nagayama, Hokama and Arakaki2010). It is known that once a female copulates with a male, she never returns aboveground (Arakaki et al., Reference Arakaki, Sadoyama, Kishita, Nagayama, Oyafuso, Ishimine, Akino, Fukaya, Hirai, Yamamura and Wakamura2004). Therefore, females who exhibit the standby behaviour can be expected to be virgins (Harano et al., Reference Harano, Tokuda, Kotaki, Yukuhiro, Tanaka, Fujiwara-Tsujii, Yasui, Wakamura, Nagayama, Hokama and Arakaki2012). Relatively large quantities of 2-butanol were required to determine the R/S ratio using a chiral column in a gas chromatograph-mass spectrometry (GC–MS) analysis – at least several nanograms for each isomer. Therefore, volatiles were collected from four groups of five females (n = 4). The volatiles of the females were collected on the day of their first calling (February 5) and second calling (February 7) on Miyako Island. On February 6, the females were placed under natural light and temperature conditions before 18:00 and then moved to a dark area, because their calling behaviour is inhibited by abrupt darkness. We used the same method of volatile collection as described in Yasui et al. (Reference Yasui, Wakamura, Tanaka, Harano, Mochizuki, Nagayama, Hokama and Arakaki2010). The samples were sent to the NIAS laboratory at Tsukuba, where chemical analysis was conducted. Potassium carbonate (4.4 g) was added to the water extract as a salting-out agent, and a SPME fibre (black: 75 µm, polydimethylsiloxane/Carboxen™, Supelco, Bellefonte, PA, USA) was then immersed in the liquid and held there for 40 min. The SPME fibre was then immediately inserted into a GC–MS apparatus that was equipped with a capillary column for chiral compounds. The GC–MS apparatus was an Agilent 6890N GC (Agilent, Santa Clara, CA, USA) that was equipped with a split/splitless injector and a JEOL JMS-T100GC AccuTOF spectrometer in EI mode at 70 eV. The chiral column that was used was an Astec CHIRALDEX™-bounded, B-PM-fused, silica capillary column (30 m × 0.25 mm ID × 0.12 µm film thickness; Supelco). Helium was used as a carrier gas with a constant flow mode of 1.25 ml min–1, and the SPME fibre that was inserted into the GC injection was maintained at 220°C for 2 min in the splitless mode. The column oven temperature was maintained at 35°C for 2 min, then increased by 1°C min–1 to 45°C and held at that final temperature for 8 min.
The enantiomers showed good separation on GC at t R = 7.2 min for R2B and t R = 7.6 min for S2B by using SIM (selected ion monitoring) mode of–MS. The R/S ratios were calculated from the peak area of the extracted ion at m/z 45.0 for R2B and S2B in the same sample, and the profiles of ions at m/z 59.0 and m/z 31.0 were used to identify the compounds. In this analysis, the ratio of the areas of the R2B and S2B peaks of rac-2B was confirmed to be 1:1.
Flight tunnel bioassay
A flight tunnel assay was performed using a flight tunnel developed by Yasuda (Reference Yasuda1996) to evaluate male behaviour towards a female model. The assay followed the basic protocol described in previous research (Fukaya et al., Reference Fukaya, Yasui, Akino, Yasuda, Tanaka, Wakamura, Maeda, Hirai, Yasuda, Nagayama and Arakaki2009; Wakamura et al., Reference Wakamura, Yasui, Akino, Yasuda, Fukaya, Tanaka, Maeda, Arakaki, Nagayama, Sadoyama, Kishita, Oyafuso, Hokama, Kobayashi, Tarora, Uesato, Miyagi and Osuga2009a ). The flight tunnel was made of transparent acrylic plates and was 75 cm long, 18.5 cm wide and 18.5 cm high. A fine wire screen separated the tunnel's flight and windward chambers, and a second wire screen was affixed to the tunnel's other end. An electric fan supplied air inside the flight tunnel at approximately 20 cm s−1 and the outlet air was exhausted to the outside of the tunnel. The main tunnel floor was covered with a sheet of white paper.
A brown-coloured, female-like glass dummy was used for a female model. R100, R90 and R50 HDPE lures were individually attached to the female model using thin wire and placed at the centre of the flight tunnel, 10 cm from the tunnel's windward end. Males are reported to terminate reproductive diapause and become sexually mature after they are kept at 20 or 15°C for 8 weeks (Tanaka et al., Reference Tanaka, Yukuhiro, Yasui, Fukaya, Akino and Wakamura2008). Newly emerged males kept at 24°C for several days were incubated at 18°C for approximately 60 days (60-days-old), then used for flight tunnel bioassays. Virgin males were divided into two groups: 59–61-days-old (young males) and 70–72-days-old (old males). One male was placed on a paper disc (9 cm in diameter; filter paper: No. 2, Toyo Roshi Kaisha, Tokyo, Japan) in a plastic container (5 cm in height) at the downwind end of the flight tunnel. The male was covered with a transparent plastic cup (6 cm diameter × 4 cm height), which was opened to expose him to the test chemical once observations began. Males were used once a day for a maximum of three days. Data on males that could not take flight were omitted. A 40 W light bulb lit the flight tunnel floor and we reduced the light intensity stepwise according to Fukaya et al. (Reference Fukaya, Yasui, Akino, Yasuda, Tanaka, Wakamura, Maeda, Hirai, Yasuda, Nagayama and Arakaki2009). Each test male was observed to see if he hovered within 5 cm of the leeward side of the female model (orientation) for more than 2 s and after that if he touched the female model with his legs or antennae or not. Each assay was continued until the male stopped flying (21 min maximum). The experiments were conducted between 1.5 and 0 h before the light was turned off, in the laboratory, at approximately 22°C, which simulated dusk in their controlled light cycle. The number of males used in each lure assay is shown in the figure.
Traps
A funnel trap with crossed vanes (15 cm diameter × 39 cm height; Trécé Inc., Salinas, CA, USA) was anchored with wire to a stick (ca. 1 cm diameter × 60 cm height) that was placed in the ground. Tube lures were attached to the traps using a plastic-coated wire.
Field tests
Field attraction tests were conducted in sugarcane fields on Miyako Island on 6 February 2012 (beginning of the mating season), and from 15 to 16 February 2015 (late in the mating season). Two series of experiments were conducted in the same sugarcane field, but on different days. The first, Series 1, was designed to evaluate the behavioural responses of males to various R/S 2-butanol mixtures (HDPE added to EVA copolymer lures, loading amount 12 mg per lure: R100, R90, R80, R60, R50, R40, R20, R10 or R0). Six traps per treatment were used in both testing periods.
Series 2 was designed to evaluate the effect of adding S2B to similar amounts of R2B (9.6–12 mg); the ratio of which was R100, R90, R80, R50 and R40. We tied one R100 lure (R2B = 12 mg) for the R100 trap, one R90 lure (R/S = 10.8/1.2 mg) for the R90 trap, one R80 lure (R/S = 9.6/2.4 mg) for the R80 trap, two R50 lures (R/S = 12/12 mg) for the R50 trap (R50 × 2) and two R40 lures (R/S = 9.6/14.4 mg) for the R40 trap (R40 × 2). Three traps per treatment were used and the experiments were conducted only in the early days of the mating season.
Statistics
To test the statistical significance of qualitative differences in pheromone emission during the first and second instances of calling, we used a two-way analysis of variance with repeated measures. When a significant difference was obtained (P < 0.05), Ryan's method was used after arcsine transformation of the data (Ramsey, Reference Ramsey1981).
Trap data (X) were transformed to (X + 0.5)1/2 and subjected to two-way analysis of variance, where zero data (mean = 0) were omitted. The means were ranked by Tukey's method when ANOVA was significant at the 5% level.
Results
Qualitative changes in sex pheromone emission in wild, emerged females
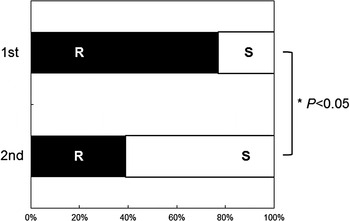
A significant difference was detected in the R/S ratio of 2-butanol that was emitted from wild females during the first and second instances of calling on Miyako Island (fig. 1; Ryan's method, P < 0.05). The R-enantiomer content in the pheromone emitted during the first calling was 78 ± 11% and the second was 39 ± 11% (average ± SE values, both n = 4).
R/S ratio of 2-butanol emitted by wild, virgin Dasylepida ishigakiensis females during their first (February 5) and second (February 7) instances of calling. The ratios of the mean values of (R)-2-butanol (closed bar) and (S)-2-butanol (open bar) are shown.

Flight tunnel assay of the laboratory-reared young and old males
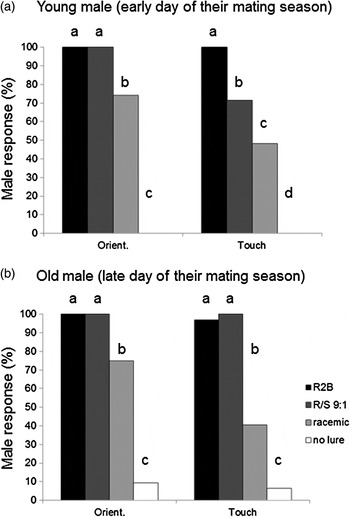
When the female glass model together with a R100 or R90 lure was presented to the males, both young and old males showed orientation behaviours (fig. 2a, b). However, with R50, the frequency of orientation behaviour was significantly decreased. With the R100 lure, almost all young and old males tried to touch the model. With the R90 lure, the number of touching attempts by the young males was significantly decreased, whereas almost all old males attempted touches.
Young (a) and old (b) male orientation and touching responses to R100, R90 and R50 lures in the flight tunnel assay. Values accompanied by the same letter are not significantly different at the 5% level according to the n × 2 chi-squared test and paired chi-squared tests using Bonferroni's corrected P value.

Male trap catches with various R/S proportions of 2B lures early and late in their mating season on Miyako Island (Series 1)
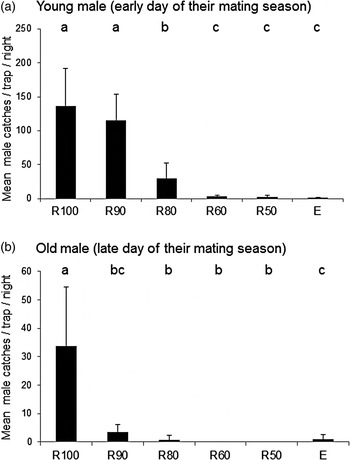
Male attraction to various lures emitting R2B, S2B or mixtures of the two in different ratios was determined in a sugarcane field. In the early days of their mating season, male catches with the R90 lure were not significantly different from those with the R100 lure (fig. 3a). When the proportion of R2B was decreased to 80% (R80), the male trap capture was significantly decreased compared with those with the R100 and R90 lures. A further decrease in the R2B proportion caused male attraction to decrease to the level observed for empty traps. On the other hand, at the end days of their mating season, the male catch with the R90 lure significantly decreased (in comparison with the R100 lure) to the same level of the empty trap (fig. 3b).
Young (a) and old (b) male trap catches by various proportions of (R)- and (S)-2-butanol lures. Field tests were conducted in sugarcane fields on Miyako Island on (a) 6 February 2012 and (b) 15–16 February 2015. The total amount of 2-butanol in each lure was 12 mg. Histograms and vertical bars indicate the back-transformed means and SE, and means designated by the same letter are not significantly different at P = 0.05.

Male trap catches with lures of R2B with various amounts of S2B in the early days of the mating season on Miyako Island (Series 2)
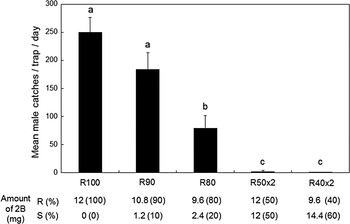
As the proportion of the (R)-isomer was decreased, the male trap catch drastically decreased. This was the same tendency as observed in Series 1 (fig. 4). Although the amounts of R2B were the same (12 mg) in the 2 × R50 lure and 2 × R40 lure combinations, neither combination attracted wild males.
Male trap catches by lures containing various amounts of (S)-2-butanol when the amount of (R)-2-butanol was kept constant. The field test was conducted in the sugarcane fields of Miyako Island on 6 February 2012. Histograms and vertical bars indicate the back-transformed means and SE, and means designated by the same letter are not significantly different at P = 0.05. The numbers in parentheses indicate the number of plots tested per day.

Discussion
This study examined qualitative changes in the sex pheromone, 2-butanol, emitted by wild D. ishigakiensis females on Miyako Island during their first and second callings at the beginning of their mating season. The major component of 2-butanol shifted from the attractive (R)-isomer at the first calling to the unattractive (S)-isomer at the second calling (fig. 1). In a previous study using laboratory-reared females, we found that as the number of calling opportunities increased, the major component of 2-butanol changed from the (R)- to the (S)-isomer (Fujiwara-Tsujii et al., Reference Fujiwara-Tsujii, Yasui, Wakamura, Mochizuki and Arakaki2012). Our present study shows that the same change occurs in the field, however, the (S)-isomer even became the major component in the female beetles’ second callings. This finding indicates that when wild females miss their first chance to copulate, they emit more unattractive pheromone components in the next calling.
In the flight tunnel assays, almost all old males showed positive reactions to R100 and R90 lures (fig. 2). However, in our field trap tests, old males were captured significantly fewer times with the R90 lure than with the R100 lure (fig. 3). Tube lures with a higher proportion of S2B (>20%, R80) could not capture the males, and the capture levels of these lures were the same as those of empty traps. This result demonstrated that the males, especially old males, are unlikely to ever come to females in their second calling in the field. In the field, once females have succeeded in copulation, they dig into the soil to oviposit eggs and never rise above the ground again; whereas males emerged from the ground and attempt to copulate several times throughout their limited lifespans (Arakaki et al., Reference Arakaki, Sadoyama, Kishita, Nagayama, Oyafuso, Ishimine, Akino, Fukaya, Hirai, Yamamura and Wakamura2004). We seldom observed solitary females during or after the mating period in the field (Yasui et al., Reference Yasui, Wakamura, Fujiwara-Tsujii, Arakaki, Nagayama, Hokama, Mochizuki, Fukumoto, Oroku, Harano and Tanaka2012). Furthermore, we often observed several males clumped on a single female's back, waiting to copulate with the female (Harano et al., Reference Harano, Tokuda, Kotaki, Yukuhiro, Tanaka, Fujiwara-Tsujii, Yasui, Wakamura, Nagayama, Hokama and Arakaki2012). Based on these field observations, wild females must have copulated on their first calling opportunity without exception. Because they eat nothing during adulthood, their energy is limited (Arakaki et al., Reference Arakaki, Sadoyama, Kishita, Nagayama, Oyafuso, Ishimine, Akino, Fukaya, Hirai, Yamamura and Wakamura2004). The females need to mature the eggs and dig into deeper soil to oviposit the eggs. Still we do not know, this energy restriction is the reason of the changes in her pheromone composition. Therefore, to save energy for a mating attempt, she might have to bet her reproductive success on one and her first calling chances.
Moreover, double use of the R50 and R40 lures could not capture the young males as effectively as the R90 and R80 lures (fig. 4). Wild males were not only attracted to R2B-emitting lures, but they were captured by the trap with a lure emitting a greater proportion of the (R)-isomer 2-butanol. For wild males, the potential of encountering a female may vary in field conditions; however, we found that the proportion rather than the amount of (R)-2-butanol is important for male attraction. Additionally, even during the first instance of calling, older females only emitted (S)-enantiomer-rich 2-butanol (Fujiwara-Tsujii et al., Reference Fujiwara-Tsujii, Yasui, Wakamura, Mochizuki and Arakaki2012).
We have confirmed by dissection that most females emerge from the soil in possession of developed ovaries and they can emit a considerable amount of sex pheromone (Fujiwara-Tsujii et al., Reference Fujiwara-Tsujii, Yasui, Wakamura, Tanaka and Arakaki2011). Under disrupted conditions, males could not find females easily, and the attractiveness of her sex pheromone would be losing its quality. Regardless of those changes in the females, males clearly prefer and approach only (R)-2-butanol-rich signals, representative of a young female's sex pheromone. In this study, we confirmed that the actual female pheromone emission and male preference do not meet. These results indicate that the ecology of this beetle reinforce the effect of the mating disruption. Because of the high cost of pure R2B, we tested and confirmed the effect of rac-2B as a disruption chemical in our previous studies (Yasui et al., Reference Yasui, Wakamura, Fujiwara-Tsujii, Arakaki, Nagayama, Hokama, Mochizuki, Fukumoto, Oroku, Harano and Tanaka2012; Arakaki et al., Reference Arakaki, Hokama, Nagayama, Yasui, Fujiwara-Tsujii, Tanaka, Mochizuki, Naito, Hongo and Wakamura2014). Female emitting pheromone is shifted to rac-2B-like composition in the last of their mating season. Male's preferences were not parallel to changes in female emitting pheromone composition, so economically convenient, rac-2B could be effective throughout their mating season. For successful control of this beetle by mating disruption, the disruptant should be introduced just before their mating season. Based on the preference of males, the most important period for control this beetle is the beginning to middle of their mating season. As female aged and the number of their calling opportunity increased, her pheromone becomes similar to the disruption chemical. If the effect of disruptant and the ecology of this beetle work together, the population of this beetle could be drastically reduced.
Acknowledgements
This work was partially supported by the research and development projects for the application and promoting of new policies for agriculture, forestry and fisheries (No. 23021). We thank the late Hiroaki Oroku of the Miyakojima Branch of OPARC for his generous support of our project. We also wish to thank Seiji Tanaka of NIAS, Fumiaki Mochizuki and Tatsuya Fujii of Shin-Etsu Chemical Company for their cooperation and useful discussions. Keisuke Kijima, Nobuo Moriya and Koji Takeichi of OPARC greatly helped our experiments in the field. Shoko Kanayama, Masahiro Oike, Kisaki Watanabe, Shota Hamajyo, and Miyuki Ueda of the Kyoto Gakuen University, and Takayuki Naito, Tomoaki Hongo, Ryuichi Saguchi and Takanobu Terauchi of Shin-Etsu Chemical Company and Midori Fukaya of the University of Tokyo kindly helped by collecting larvae and in field experiments. Thanks are also due to Ayako Yamaguchi of the Okinawa Prefectural Plant Protection Centre, Miyako Branch Office, for her cooperation in collecting larvae and to Ikuko Hashimoto, who helped rear the beetles at NIAS and assisted us in our experiments.