

Significant outcomes and limitations
• The study showed the depression could cause injury to the gastric mucosa at the ultrastructure level, and some related signalling pathways were shown.
• The limitation is that currently there lacks a proper grading system to classify the injuries at the ultrastructure level, therefore the analysis of the correlation between molecular changes and cytology is difficult. We will be interesting to look at the underlying mechanisms in our future studies.
Introduction
Chronic stress (CS) is one of the most important factors contributing to clinical depression, and was sometimes considered as the cause of digestive symptoms in patients. These gastrointestinal symptoms were diagnosed as functional gastrointestinal disorder, FGID (Reference Budavari and Olden1–Reference Van Oudenhove and Aziz3). Previous studies showed that psychological factors were critical in the development of functional dyspepsia and irritable bowel syndrome (Reference Barry and Dinan4,Reference Mayer, Naliboff, Chang and Coutinho5). The potential underlying mechanism was suggested to be stress-ulcer response (Reference Overmier and Murison6); however, whether organic lesions occurred in the gastrointestinal system during depression was not investigated. In addition, in recent years it has been found that stress could induce the expression of heat shock protein 70 (HSP70) and fibroblast growth factor 2 (FGF2) in of gastric mucosa (Reference Kiang and Tsokos7,Reference Esaki, Aoyagi, Matsumoto, Kuwano, Shimizu and Fujishima8), reflecting the significance of mucosal damage and the capacity of regeneration. In this study, the authors set up to examine the organic changes in ultrastructure of gastric mucosa using electronic microscopy, then the expression and changes of HSP70 and FGF2 in gastric mucosa of a rat model of depression, to explore if the gastric symptoms in depression were associated with organic lesions of the mucosa.
Materials and methods
Animals
Sixteen male Sprague-Dawley rats (250 ± 10 g) were purchased from Experimental Animal Center of Chinese Academy of Sciences (Shanghai, China), and randomly assigned into two groups after 7 days of adaptation [control (CT) and CS groups].
The rat model of depression with chronic stress
The rat model of depression with CS was employed according to previous studies (Reference Willner9). The combination of solitary care (isolation stress) and chronic unpredictable mild stress (CUMS) was applied on CS group for 35 days. In the CT group, eight rats were raised in two cages; in CS group, each rat was raised in isolated caged and subjected to CUMS protocol as follows: fasting (24 h), water deprivation (24 h), tail clamp (1 min), foot shock (36-V AC, current intensity 1.0 mA, at intervals of 1 min per stimulation, each lasting 10 s, a total of 30 times), ice water swimming (4 °C, 5 min), wet bedding (lasting for 24 h, an addition of 100–300 ml of water was used to wet cage bedding), reversed light cycle; the seven types of stress stimuli were randomly generated to the rats with one each per day. All procedures with animal experiments were approved by Animal Experiment Ethic Committee at the Animal Experimental Center of Zhejiang University of Technology, Hangzhou, China.
Open field test
An open box with length and width of the 80 cm × 80 cm and height at 40 cm was used. The bottom floor was divided into 64 black and white grids (10 cm × 10 cm each). The 16 grids in the middle were considered as central, and the rests were peripheral grids. The animal behaviour was recorded at the active cycle of the animal under red light for 5 min. Noldus software was used for the analysis of the total travelling distance, the percentage of time the animal spent in central region and traces of movement.
Sucrose water consumption test
Animals were deprived of water for 12 h per day for 4 days before the sucrose water consumption test (SWCT) for 3 h per day. The animals were provided with two choices between 1% sucrose water and water bottles, with their positions randomly assigned every day. The ratio of the amount of liquid consumption was calculated as the index of hedonia.
Scanning electronic microscopy and transmission electronic microscope
XL30 scanning electron microscope (Philips, Amsterdam, The Netherlands) and JEM-1230 transmission electron microscope (Japan JFOL Company, Tokyo, Japan) were used for the EM studies. The animals were subjected to a food deprivation of 24 h before sacrifice, and the stomach tissue was harvested and rinsed with 0.1 M phosphate buffer solution before fixation into 2.5% glutaraldehyde overnight at 4 °C.
For scanning electron microscopic (SEM) samples, the tissue was processed with 1% osmium tetroxide solution (1 h), gradient dehydration with alcohol, ethanol and amyl acetate resin mixture (1:1 by volume) before amylacetate overnight, drying and coating for cutting slices.
For transmission electronic microscopic (TEM) samples, the tissues were treated with gradient dehydration with alcohol, pure acetone (20 min), embedding medium and acetone mixture (1 h, 1:1 by volume), embedding medium and acetone mixture (1 h, 3:1 by volume), pure embedding medium overnight, and infiltration at 70 °C overnight. The sections were cut on a Reichert slice machine at 70–90 nm. Then the slices were stained in the lead citrate solution and uranyl acetate saturated solution of 50% ethanol for 15 min before observation. All the EM studies were performed at the EM center of Zhejiang University, China.
Western blot
After the animals were sacrificed, the gastric tissues were harvested and stored in liquid nitrogen before protein extraction. The following reagents were used: RIPA lysis buffer (Shanghai Health Workers, Shanghai, China), BCA protein concentration determination Kit (Pik days, Shanghai, China), HSP70, FGF2 rabbit anti-rat primary antibody, IgG goat anti-rabbit secondary antibody (Wuhan Boster Biological, Wuhan, China) and ECL fluorescent indicator (U.S. Pirece company, San Francisco, US).
Statistics
SPSS 17.0 was used for all statistical analyses. The results were represented by indicators mean± standard deviation (M ± SD), and the p value was determined with independent sample t test.
Results
Rat model of depression with behaviour changes
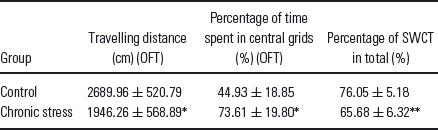
In the open field test (OFT, the CS group showed decreased locomotor behaviour in the road travelling distance (t(14) = 2.46, p < 0.05), and increased time spent in the central wells (t(14) = −2.78, p < 0.05) (Table 1). In the SWCT, the CS group showed decreased intake of sucrose water (t(14) = 3.59, p < 0.01), suggesting the success of our rat model of depression with CS.
Behaviour results (M ± SD, n = 8)
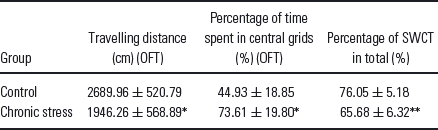
* p < 0.05 and
** p < 0.01 when compared with control group.
The changes of ultra structure in gastric mucosa layer
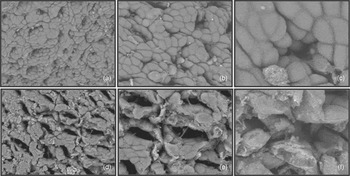
In the SEM pictures, the surface of gastric mucosa in CT group was covered with mucus layer, and rick in mucus. With rinsing treatment, the mucosal epithelial cell showed integrity, and the mucosal surface still showed mucus coverage, with clear visualisation of gastric pits (Fig. 1a–c). While in CS group, with same cleaning procedure, more epithelial cells were exposed, and showing damaged structure, as well as expanded gastric pits (Fig. 1d–f).
SEM results for the control group (a–c) and chronic stress group (d–f). Magnification: (a, d) 1000×, (b, e) 2000×, (c, f) 5000×. In CS group, with same cleaning procedure, more epithelial cells were exposed, and showing damaged structure, as well as expanded gastric pits.

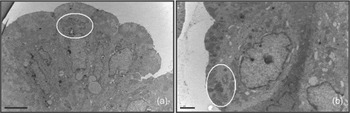
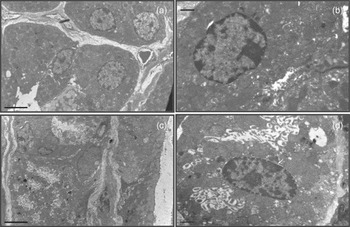
In TEM pictures, the mucous cells in CT group were abundant with mucus granules, which showed dense black spots in the EM picture (white ellipse, Fig. 2a). In contrast, the CS group showed decreased amount of granules, and these granules were exposed directly on the cell surface (Fig. 2b). In addition, we examined the changes in ultrastructure of gastric parietal cells. In the CT group, these cells were found to be in the resting state, whereas in CS group these cells were activated, with the expansion of microtubule bubbles inside the cell, as well as a larger low-density area (Fig. 3).
TEM pictures: surface mucous cells; (a) 5000× magnification for the control group, (b) from chronic stress group 8000× magnification. The white ellipse highlighted the position of granules. The CS group showed decreased amount of granules, and these granules were exposed directly on the cell surface.

Gastric parietal cells: (a, b) as the control group, (c, d) chronic stress (CS) group, showing that parietal cells in CS group were active, with the expansion of microtubules bubbles inside the cell, as well as a larger low-density area. (a, c) 5000× magnification, (b, d) 15000× magnification.

Changes in HSP70 and FGF2 expression in gastric mucosa under depression
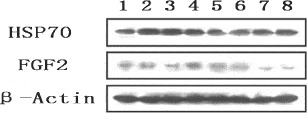
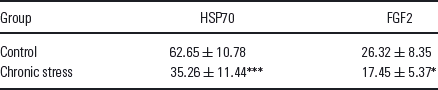
The Western blot results obtained through optical density analyses between bands showed that in the gastric mucosa of CS group animals, HSP expression significantly decreased (t(14) = 4.93, p < 0.001), and the FGF2 expression also significantly reduced (t(14) = 2.53, p < 0.05) (Fig. 4, Table 2).
Western blot results, 1234 for the control group, 5678 for the chronic stress group.

The ratio of integrated optical density (IOD) of the target protein to internal reference protein (%) (M ± SD, n = 8)
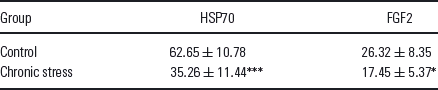
* p < 0.05,
*** p < 0.001 when compared to the control group.
Discussion
Chronic unpredictable stress is a validated experimental approach in the induction of depression behaviour in rats (Reference Willner9), which could be measured with sucrose water consumption behaviour experiment (Reference Mar, Spreekmeester and Rochford10,Reference Brenes Saenz, Villagra and Fornaguera Trias11). In this study, the sucrose water intake was significantly decreased in CS group. In addition, in the OFT, the CS group showed reduced avoidance behaviour or increased exposure in central grids, with decreased locomotion activity (Reference Sarkisova and Kulikov12), both of which validated our model as a rat model of depression.
In stressful conditions, the hypothalamic pituitary adrenal axis was activated and corticotropin releasing factor was released from hypothalamic paraventricular nucleus, stimulating the releasing of adrenocorticotropic hormone, which in turn leads to the increase in adrenal glucocorticosteroid (GC) (Reference Krishnan and Nestler13–Reference Shelton15). GC was found to be involved in physiological activities of the gastric mucosa. For instance, Gama et al. treated rats in vivo and the cultured rat gastric tissue in vitro with GC, and the results showed decreased gastric epithelial cell proliferation as well as increased cell apoptosis (Reference Gama, Goldfeder, de Moraes and Alvares16). It was also found that GC could regulate the expression of MUC5AC mRNA, which directly inhibits the synthesis of epithelial mucus layer (Reference Tanaka, Kobayashi, Sunaga and Tani17). In addition, GC could regulate the glucocorticoid-regulated kinase SGK1 to enhance the secretion of gastric acid (Reference Sandu, Artunc and Grahammer18). We believed that the lesion we observed in rat model of depression of gastric mucosa was because of the abnormal level of GC, which disrupted the normal function of gastric mucosal cells and increased the secretion of gastric acid. Both factors would contribute to the destruction of the gastric mucosal layer, and other phenomenon.
HSP70 is widely expressed in mammalian cells under heat stress, environmental stress and psychological stress conditions with anti-apoptotic functions (Reference Yenari, Liu, Zheng, Vexler, Lee and Giffard19,Reference Jolly and Morimoto20) through the maintenance of normal transmembrane transport (Reference Feder and Hofmann21). The upregulation of HSP70 could inhibit stress-induced JNK pathway, p38 and other apoptotic signalling pathways (Reference Kumar and Tatu22). It has also been shown that the HSP70 was protective in gastric mucosa against stress, and inhibited the apoptosis as well as necrosis, and heat shock cognate 70 (HSC70) (stress-induced isoform) was critical for this process (Reference Otaka, Odashima and Watanabe23–Reference Otaka, Matsuhashi and Odashima25). In our study, we found that after a period of stress, HSP70 decreased in depression group, suggesting the self-defence mechanism was weakened. Whether acute psychological stress would increase HSP70 in this model is yet unknown.
FGF2 could promote the growth of blood vessels, the regeneration of epithelial cells, and was found to be involved in gastric ulcer as well as other gastric diseases (Reference Esaki, Aoyagi, Matsumoto, Kuwano, Shimizu and Fujishima8,Reference Luo, Lin and Lu26). It was shown that FGF2 expression would contribute to the healing after gastric ulcer (Reference Hull, Brough, Powe, Carter, Jenkins and Hawkey27), and during the healing process, in the early stage, FGF2 promotes the epithelial cell proliferation, while in the later stage the vascular endothelial cells promotes regrowth of blood vessels (Reference Kimura, Noda, Sugihara, Kashima and Hattori28). Particularly, FGF was used to evaluate the treatment efficiency to gastric mucosal lesions in past studies (Reference Esaki, Aoyagi, Matsumoto, Kuwano, Shimizu and Fujishima8,Reference Luo, Lin and Lu26,Reference Becker, Beckbauer, Domschke, Herbst and Pohle29). This study showed that FGF2 signalling was downregulated in animals of CS group, which might explain the fact that the lesions were not regenerated, which ultimately led to gastric dysfunction. Consistent with this, previous studies showed that FGF2 expression was reduced in different brain regions among several rodent models of depression (Reference Kato, Okugawa and Wakeno30,Reference Turner, Gula, Taylor, Watson and Akil31), and the ventricle infusion of FGF2 could act as anti-depressant to some extent (Reference Turner, Gula, Taylor, Watson and Akil31).
Taken together, this study reported that CS would result in depression-associated organic lesion of the gastrointestinal system, especially the gastric mucosal layer. The HSP70 and FGF2 were dysregulated, which might contribute to the failure in self-repair. The underlying mechanism is highly likely to be the increased release of adrenal GC under stressful conditions, which through the circulation depressed the brain and hurt the stomach at the same time. The study implied that the gastrointestinal syndromes observed in patients with depression were more than psychological problems, and deserved better and focused treatments.