

INTRODUCTION
Numerous studies have highlighted that ~37–70% of all international joint ventures (IJVs) face performance problems (e.g., Pothukuchi, Damanpour, Choi, Chen, & Park, Reference Pothukuchi, Damanpour, Choi, Chen and Park2002; Meschi & Riccio, Reference Meschi and Riccio2008). Barkema and Vermeulen (Reference Barkema and Vermeulen1997) found that issues pertaining to cultural differences may impact IJV performance, highlighting that IJVs typically face many challenges associated with business performance, staffing, communication, human resource (HR) management, and cultural issues, among others. Khorassani (Reference Khorassani2012) examined the factors influencing the performance of IJVs in Iran and found a high failure rate. It is known that IJVs are likely to face problems in human relations. In addition, Namazie and Frame (Reference Namazie and Frame2007) considered Iranian managers and supervisors and found that multinational firms, particularly IJVs, are likely to face low productivity and performance. Following Khorassani (Reference Khorassani2012) and Namazie and Frame (Reference Namazie and Frame2007), many studies have examined various dimensions of human factors, including humor, communication satisfaction, and job performance. The present study investigates this topic because, based on interviews with three Iranian HR managers, failed IJVs are likely to have problems with employee job performance.
This study investigates the relationships between humor, communication satisfaction, and job performance and contributes to the literature in several ways. First, this study considers humor from a fairly straightforward perspective. Thus, the results could provide guidelines for lightening the atmosphere at work. It should be noted that Iranians tend to be not only friendly but also humorous but that they are likely to be serious in the workplace (Ali & Kandlusi, Reference Ali and Kandlusi2010). This study conceptualizes humor based on Booth-Butterfield and Booth-Butterfield (Reference Booth-Butterfield and Booth-Butterfield1991) definition, which considers humor in terms of its frequency and use. Furthermore, few studies have considered humor in the context of organizations in Iran (Kandlousi & Sheykh, Reference Kandlousi and Sheykh2010). The present study contributes to the literature by addressing these limitations and by considering humor as a two-dimensional construct that can boost employees’ job performance in Iran’s IJVs.
Second, scholars such as Pearce and Segal (Reference Pearce and Segal1998) have called for a better understanding of the relationships between communication satisfaction and job performance. When business partners come from different cultures (national and organizational), the underlying cultural inconsistencies in their communication can limit the development of effective business relationships (Mohr & Nevin, Reference Mohr and Nevin1990). Therefore, communication satisfaction is an important topic for IJVs.
Third, as mentioned earlier, applying humor in a positive manner can facilitate comfortable and effective communication and thus communication satisfaction (Barbato, Graham, & Perse, Reference Barbato, Graham and Perse1997). The existing studies (e.g., Cascio, Reference Cascio2006) found that when employees make positive use of humor, management procedures, and business performance are likely to improve. In addition, humor can reduce stress among managers and supervisors and enable them to enhance their performance (Romero & Cruthirds, Reference Romero and Cruthirds2006). Therefore, this study contributes to the literature by being the first to investigate the mediating effect of communication satisfaction on the relationship between humor and job performance.
The main goal of this study is to close the aforementioned gaps in the literature and investigate the relationships between humor, communication satisfaction, and employee job performance in IJVs in Iran. The next section of the paper provides information about IJVs and employees’ job performance, while the subsequent section discusses the research methodology and design. The following section presents the analytical results and the final section concludes the study.
LITERATURE REVIEW
IJVs
To explain the nature of joint ventures, it is important to define the term ‘joint’ which refers in this context to a separate organizational entity with two or more firms as parent companies (Harrigan, Reference Harrigan1985). It is evident that the given definition refers to a legal and governing structure of cooperation. However, some factors are not sufficiently covered by this definition, namely differences in the focus, risks, benefits, and complexities across alliances (Kaufmann & O’Neill, Reference Kaufmann and O’Neill2007). In this regard, a joint venture can be described as a procedure used to respond to certain business phenomena such as new markets, specific government policies, business capacity, and technology transfer.
Joint ventures have been recognized as an elegant and deliberate choice for various industries, including telecommunications, automotive manufacturing, and service-oriented industries, among others (Adnan & Morledge, Reference Adnan and Morledge2003). Consequently, an IJV refers to a separate legal organizational entity held by two or more parent companies, provided that the head office of at least one parent company is situated outside the country of origin in which the IJV operates. In this case, this entity is jointly controlled by parent companies that are financially and legally independent of each other (Shenkar & Zeira, Reference Shenkar and Zeira.1987).
Employee job performance
Recent decades have witnessed broader definitions of job performance. This study defines job performance as ‘actions and behaviours that are under the control of the individual that contribute to the goals of the organization’ (Rotundo & Sackett, Reference Rotundo and Sackett2002: 66). Performance is defined as a set of behaviors with evaluative elements that can be recognized to be positive or negative for an employee. These behaviors can be distinguished based on their effectiveness, which is the impact that they have on outcomes (Borman & Motowidlo, Reference Borman and Motowidlo1997). According to Kane (Reference Kane1984), job performance refers to the recording of attained results for multiple examples of completing a job dimension over a certain period of time. In other words, performance is known as the determination of outcome levels obtained (per dimension) within a particular time period.
Researchers have moved away from definitions of job performance in which job-specific tasks represent the only measure of overall job performance. Some researchers (William & Anderson, Reference Williams and Anderson1991; Borman & Motowidlo, Reference Borman and Motowidlo1993) have recognized two broad classes of employee behaviors, namely task performance and contextual performance (also referred to as citizenship performance). Many studies have suggested that task performance is the most important feature of work behaviors and that it is recognized in many cases as a synonym for the term ‘overall job performance.’ However, other studies have well documented the significance of non-task behaviors in overall job performance (Dunlop & Lee, Reference Dunlop and Lee2004). Task performance is known as the behaviors and activities that maintain an organization’s technical core, involve the implementation of technical processes (transforming raw materials into the goods or services of the organization), and preserve these processes. Supplying raw materials, sharing products, and planning and coordinating tasks are some activities in this process (Borman & Motowidlo, Reference Borman and Motowidlo1993; Motowidlo, Borman, & Schmitt, Reference Motowidlo, Borman and Schmitt1997).
Contextual performance refers to the personal efforts of employees that are not directly related to their main tasks but are important because such efforts shape the organizational, social, and psychological background to task activities and processes (Werner, Reference Werner2000). Although task performance has been explained in a more conventional manner in comparison with contextual performance, scholars have started to empirically demonstrate that contextual performance leads to competitive benefits for firms (Witt, Kacmar, Carlson & Zivnuska, Reference Witt, Kacmar, Carlson and Zivnuska2002). On the other hand, Borman and Motowidlo (Reference Borman and Motowidlo1993) verified that contextual performance contributes to organizational efficiency by serving the organizational, social, and psychological mechanisms through which practical and technical core functions are performed. Van Scotter, Motowidlo, and Cross (Reference Van Scotter, Motowidlo and Cross2000) acknowledged that those employees who follow commands, display initiatives, persevere with hard tasks, cooperate with others efficiently, and voluntarily act on the organization’s behalf are more likely to contribute to the organization’s goals.
Humor
Humor has been defined differently by various authors. Smith, Harrington, and Neck (Reference Smith, Harrington and Neck2000: 607) define humor as ‘any communication (joke, witticism, etc.) that results in laughter or fun.’ Based on McIlheran (Reference McIlheran2006), humor is an attempt to communicate with others and have a message interpreted as being funny. Lee and Kleiner (Reference Lee and Kleiner2005: 180) defined humor as ‘a message whose creativity and verbal skill or incongruity has the power to evoke laughter.’ These definitions mostly highlight that the nature of humor is happiness and joy. In addition to the above definitions, Miller (Reference Miller1996) proposed an organizational view of humor and states that humor is a consistent behavior in individuals working in organizations which truly provides an environment of empowerment. When employees use humor, they obtain influence over others that is a type of power in an organizational setting.
Booth-Butterfield and Booth-Butterfield (Reference Booth-Butterfield and Booth-Butterfield1991) is interested in the frequency and effectiveness of humor. The frequency of humor consists of several factors, including the regularity of telling jokes and funny stories (e.g., how often people tell jokes and funny stories) and the possession of a good memory for jokes and funny stories. Here a good memory means that some people can quickly refer to jokes that fit given situations, whereas others are not as adept at this. In addition, some people have the ability to be funny or are naturally funny and interesting when communicating. For example, some people may tell a funny story but cannot make people laugh, whereas humorous people can tell the same story and elicit laughter because they are naturally funny and interesting. In addition, some people have the ability to use funny stories in various situations. More specifically, some people have to wait for a specific situation to be funny, whereas others can be funny in just about any situation. That is, they do not have to wait for a certain occasion to arise. In terms of the effectiveness of humor, some people can make others laugh when telling a joke, whereas others do not have this effect. In other words, the former can tell jokes well. Having this effect on people is likely to make others consider the former as funny. Even when unfunny jokes or stories are told by a funny person, people may still laugh. This suggests that some people are more effective than others in using humor.
Communication satisfaction
According to Hecht (Reference Hecht1978), communication satisfaction is generally regarded as an affective response when expectations are met in the process of exchanging messages and is considered to denote a pleasant, satisfying experience. To many researchers in organizational contexts, communication satisfaction can be defined as an outcome of an individual who is satisfied with various features of communication in interpersonal, group, and organizational contexts (Downs & Hazen, Reference Downs and Hazen1977; Hecht, Reference Hecht1978; Crino & White, Reference Crino and White1981). Clampitt and Downs (Reference Clampitt and Downs1993) and Downs and Hazen (Reference Downs and Hazen1977) declared that communication satisfaction suggests eight consistent dimensions, namely personal feedback, supervisory communication, subordinate communication, co-worker communication, organizational integration, corporate information, communication climate, and media quality.
Downs and Hazen (Reference Downs and Hazen1977), known communication satisfaction as instrument developers, recognized eight factors verified in Crino and White (Reference Crino and White1981) and Downs (Reference Downs1988). Several researchers discovered two dimensions of organizational communication, namely informational and relational (Pincus, Reference Pincus1986; Putti, Aryee, & Phua, Reference Putti, Aryee and Phua1990; Gray & Laidlaw, Reference Gray and Laidlaw2004). The present study considers communication satisfaction as a two-dimensional variable including informational and relational communication satisfaction because this classification is best known.
The informational (communication climate, organizational perspectives, and organizational integration) dimension of communication satisfaction refers to satisfaction with organizational content and the exchange of information among employees, supervisors, and other organizational members in the workplace. Informational communication satisfaction focuses on the communication environment, the organizational standpoint, and organizational integration (Goldhaber, Porter, Yates, & Lesniak, Reference Goldhaber, Porter, Yates and Lesniak1978; Pincus, Reference Pincus1986; Putti, Aryee, & Phua, Reference Putti, Aryee and Phua1990; Gray & Laidlaw, Reference Gray and Laidlaw2004).
The relational (media, horizontal communication, personal feedback, and relationships with supervisors) dimension of communication satisfaction refers to satisfaction with relationships among employees, managers, and other organizational members in the workplace. The relational dimension focuses mainly on relational communication, which reflects the perceptions and attitudes of employees, supervisors, and other organizational members. The relational dimension refers to employees’ perception of one another in the workplace and consists of media quality, personal feedback, horizontal communication, and relationships with supervisors (Goldhaber et al., Reference Goldhaber, Porter, Yates and Lesniak1978; Pincus, Reference Pincus1986; Putti, Aryee, & Phua, Reference Putti, Aryee and Phua1990; Gray & Laidlaw, Reference Gray and Laidlaw2004).
Humor and job performance
In the field of organizational behavior, it is assumed that there is a relationship between employees’ positive feelings and their performance (Staw, Sutton, & Pelled, Reference Staw, Sutton and Pelled1994; Wright & Staw, Reference Wright and Staw1999). Therefore, considerable attention has been paid to the value of constructs, pertain to positive support, emotions, and especially humor (Luthans, Reference Luthans2002). Hurren (Reference Hurren2006) demonstrated that the simple incorporation of humor by school authorities has a significant effect on teachers and students. Humor can improve employees’ morale and make work environments more pleasant. Williams and Clouse (Reference Williams and Clouse1991) stated that humor can be regarded as a ‘wonderful addition to an administrative style.’ Blase (Reference Blase1984) considered stress or stressful positions as something that can reduce job performance. On the other hand, a pleasant approach to life-related issues, whether personal or professional, can promote an individual’s creative potential, reduce stress, and create better living conditions (Blase, Dedrick, & Strathe, Reference Blase, Dedrick and Strathe1986). In this regard, the following hypotheses are proposed:
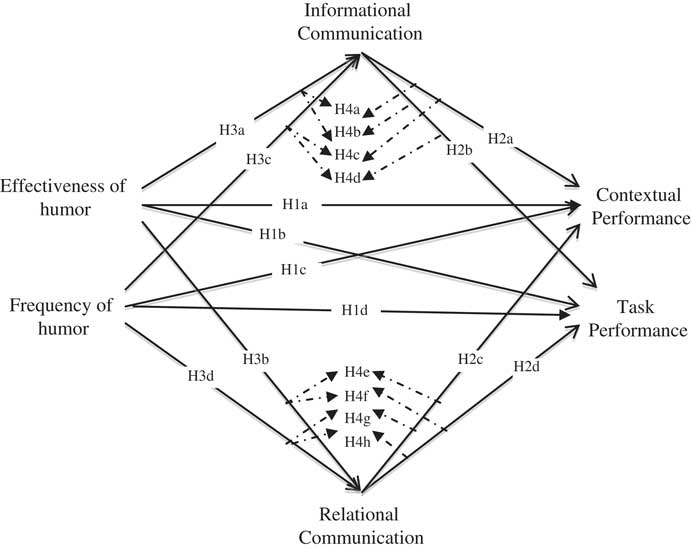
Hypothesis 1a: The effectiveness of humor is positively related to the contextual performance of Iranian employees of IJVs.
Hypothesis 1b: The effectiveness of humor is positively related to the task performance of Iranian employees of IJVs.
Hypothesis 1c: The frequency of humor is positively related to the contextual performance of Iranian employees of IJVs.
Hypothesis 1d: The frequency of humor is positively related to the task performance of Iranian employees of IJVs.
Communication satisfaction and job performance
Job performance is an important topic in communication literature (Ehlers, Reference Ehlers2003). Like practitioners, management and communication scholars have taken an interest in achieving higher employee performance and satisfaction because these factors can enhance an organization’s corporate culture and improve its capacity to meet its goals (Pettit, Goris, & Vaught, Reference Pettit, Goris and Vaught1997). Therefore, organizational endeavors designed to enhance or develop organizational communication may have positive effects on both employees and the organization (Chen, Silverthorne, & Hung, Reference Chen, Silverthorne and Hung2006).
Scholars have been interested in organizational communication satisfaction and its relationship to job performance for nearly three decades, although most studies have been subjective and quasi-experimental or have provided meta-analyses (Downs & Hain Reference Downs and Hain1982). For example, Jain (Reference Jain1973) applied a questionnaire-based interview format to examine the relationship between the communication effectiveness of hospital supervisors and their job performance as perceived by their subordinates. Jain’s (Reference Jain1973) effectiveness criteria included the supervisor’s communication behavior, the frequency and level of supervisor–subordinate communication, employees’ knowledge of policies and procedures, employees’ communication satisfaction, and the application of nonsupervisory formal communication channels. Jain (Reference Jain1973) found positive correlations between communication effectiveness and job performance; between the frequency and level of communication and job performance; and between the employee’s communication satisfaction and the supervisor’s job performance. In this regard, the following hypotheses are proposed:
Hypothesis 2a: There is a positive relationship between informational communication satisfaction and contextual performance for Iranian employees of IJVs.
Hypothesis 2b: There is a positive relationship between informational communication satisfaction and task performance for Iranian employees of IJVs.
Hypothesis 2c: There is a positive relationship between relational communication satisfaction and contextual performance for Iranian employees of IJVs.
Hypothesis 2d: There is a positive relationship between relational communication satisfaction and task performance for Iranian employees of IJVs.
Humor and communication satisfaction
In the field of organizational behavior, the relationship between humor and communication satisfaction is a new topic of research. Unfortunately, there is little literature to indicate the nature of the relationship between these constructs. However, as humor has been proposed as a type of communication by McIlheran (Reference McIlheran2006) and because communication is necessary for communication satisfaction, we can propose that humor can be the originator of communication satisfaction of employees in an organizational setting. In addition to the above, previous literature has divided the outcomes of humor into three categories. At the psychological level, the benefits of humor are decreased tension; increased joy and communication skills; increased well-being; and reduced anxiety levels (Ford, McLaughlin, & Newstrom, Reference Ford, McLaughlin and Newstrom2003; Szabo, Reference Szabo2003; Lee & Kleiner, Reference Lee and Kleiner2005). At the physical level, the benefits of humor can increase the sense of well-being and decrease stress (Sokol, Reference Sokol2002 in Lee & Kleiner, Reference Lee and Kleiner2005). Finally, at the organizational level, the benefits of humor can be reduced feelings of anxiety and stress at work for employees (Lee & Kleiner, Reference Lee and Kleiner2005). Therefore, if we look at humor in the context of communication, the positive effects of humor should lead to increased communication satisfaction. In this regard, the following hypotheses are proposed:
Hypothesis 3a: The effectiveness of humor is positively related to the informational communication satisfaction of Iranian employees of IJVs.
Hypothesis 3b: The effectiveness of humor is positively related to the relational communication satisfaction of Iranian employees of IJVs.
Hypothesis 3c: The frequency of humor is positively related to the informational communication satisfaction of Iranian employees of IJVs.
Hypothesis 3d: The frequency of humor is positively related to the relational communication satisfaction of Iranian employees of IJVs.
In addition, the discussion suggests that the two dimensions of communication satisfaction (informational and relational) may mediate the relationship between the two dimensions of humor (effectiveness and frequency) and the two dimensions of job performance (contextual and task). In this regard, the following hypotheses are proposed:
Hypothesis 4a: Informational communication satisfaction mediates the relationship between the effectiveness of humor and contextual performance.
Hypothesis 4b: Informational communication satisfaction mediates the relationship between the effectiveness of humor and task performance.
Hypothesis 4c: Informational communication satisfaction mediates the relationship between the frequency of humor and contextual performance.
Hypothesis 4d: Informational communication satisfaction mediates the relationship between the frequency of humor and task performance.
Hypothesis 4e: Relational communication satisfaction mediates the relationship between the effectiveness of humor and contextual performance.
Hypothesis 4f: Relational communication satisfaction mediates the relationship between the effectiveness of humor and task performance.
Hypothesis 4g: Relational communication satisfaction mediates the relationship between the frequency of humor and contextual performance.
Hypothesis 4h: Relational communication satisfaction mediates the relationship between the frequency of humor and task performance.
RESEARCH MODEL AND HYPOTHESES
Based on the literature review, a research framework was developed to examine the relationships between humor (effectiveness and frequency), communication satisfaction (informational and relational), and job performance (contextual and task) for Iranian employees of IJVs (Figure 1). This model suggests that humor influences communication satisfaction and job performance, that communication satisfaction has a positive relationship with job performance, and that communication satisfaction mediates the relationship between humor and job performance.
Research framework

METHODOLOGY
Procedure
The analysis focused on two groups of employees as respondents: subordinates and their direct supervisors. The Set A questionnaire measured humor and communication satisfaction and was completed by subordinates. The Set B questionnaire measured the job performance of subordinates and was completed by the employees’ direct supervisors. Both questionnaire sets were distributed with permission from the HR departments of two of the biggest IJVs in the automotive industry in Iran. Data were obtained by distributing the questionnaires to a total of 1,100 potential respondents from a random sample of subordinates and their supervisors. The procedure was as follows: First, the researcher delivered the questionnaires to the HR department, and the HR department provided the Set A questionnaires with envelopes to subordinates. Then the HR department asked the subordinates to complete the questionnaires, put them in the envelopes, seal the envelopes, and write their names on the envelopes. Through this procedure, the HR department ensured that the responses would be kept totally confidential. Subsequently, subordinates submitted the completed questionnaires (placed inside the sealed envelopes) to their direct supervisors, who were asked by the HR department to complete the Set B questionnaires. Specifically, Set B had to be answered by the supervisor of each specific subordinate whose name was written on the envelope. Then HR attached the completed Set B questionnaires together with the Set A questionnaires and returned them to the researcher. From the 1,100 individuals in both groups (A and B), there were some respondents who returned incomplete responses. Therefore, the matching process and eliminating invalid responses reduced the number of usable responses to 375 sets.
Questionnaire and measurement
The questionnaire consisted of four sections: (1) humor (frequency and effectiveness), (2) communication satisfaction (informational and relational), (3) job performance (contextual and task), and (4) demographic information. Selected measurement items must ensure sufficient content validity. Therefore, to ensure content validity, this study’s measurement items were adapted mainly from previous studies. More specifically, the scales for humor were adapted from Booth-Butterfield and Booth-Butterfield (Reference Booth-Butterfield and Booth-Butterfield1991), while communication satisfaction was measured using 35 items adapted from Downs and Hazen (Reference Downs and Hazen1977). The measures for job performance were adapted from Williams and Anderson (Reference Williams and Anderson1991). All items were measured on a 5-point Likert-type scale.
Analysis
The partial least squares technique was applied to analyze the causal relationships between constructs using SmartPLS 3.0 software. The partial least square approach was selected because of the exploratory nature of this study (Hair, Ringle, & Sarstedt, Reference Hair, Ringle and Sarstedt2013) and a two-step approach was used in the data analysis, as suggested in Henseler, Ringle, and Sinkovics (Reference Henseler, Ringle and Sinkovics2009). The first step involved the analysis of the measurement model, and the second step tested the structural relationships between latent constructs. The two-step approach aimed to establish the reliability and validity of measures before assessing the model’s structural relationships.
RESULTS
Profile of respondents
In terms of the demographic profile of the respondents, 5.6% (375 respondents) were aged 50 and over; 25.6% were between the ages of 40 and 49; 44.27% were between the ages of 30 and 39; and 24.53% were 29 or younger. There were more males (246; 65.6%) than females (129; 34.4%). In terms of marital status, the majority were married (70.4%), followed by those who were single (21.07%), and divorced (8.53%). In terms of the level of education, the majority had a bachelor’s degree (60.53%), followed by a master’s degree (22.4%), and a certificate/diploma (17.07%), implying that most had a high level of education.
Measurement model analysis
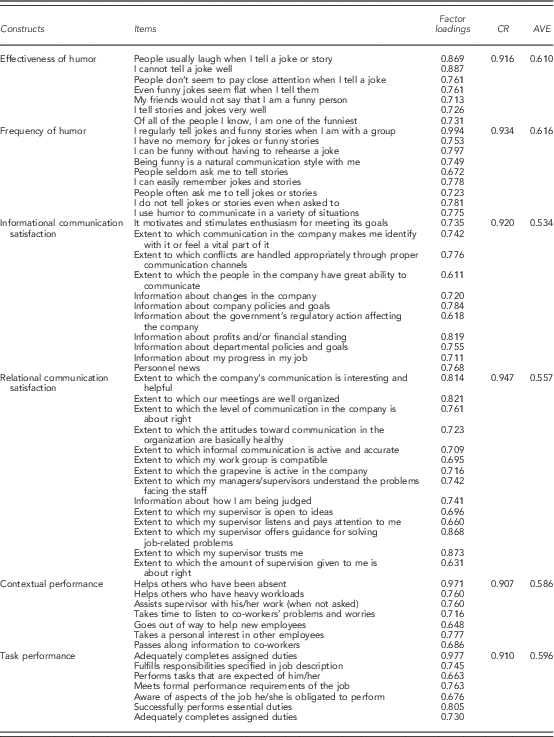
The reliability and validity of reflective constructs were assessed. Composite reliability was assessed with respect to internal reliability, which is similar to Cronbach’s α. The composite reliability of all constructs exceeded 0.7 (Table 1), satisfying the recommended threshold (Hair, Ringle, & Sarstedt, Reference Hair, Ringle and Sarstedt2013). Hair, Black, Babin, and Anderson (Reference Hair, Black, Babin and Anderson2010) suggested accepting items with loadings ≥0.6. All loadings for each scale exceeded 0.6, indicating sufficient reliability for individual items. Convergent validity was evaluated using the average variance extracted. The average variance extracted exceeded 0.5 for all constructs, indicating sufficient convergent validity (Fornell & Larcker, Reference Fornell and Larcker1981).
Measurement model evaluation

Note. AVE=average variance extracted; CR=composite reliability.
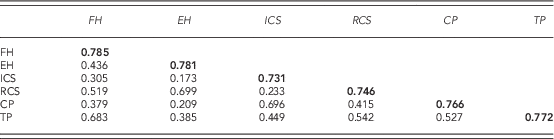
Two approaches were employed to test the discriminant validity of the constructs. First, the cross-loadings of indicators were checked, and according to the results no indicator loaded higher on an opposing construct (Hair, Sarstedt, Ringle, & Mena, Reference Hair, Sarstedt, Ringle and Mena2012). Second, Fornell and Larcker’s (Reference Fornell and Larcker1981) criterion was employed to test whether each construct’s average variance extracted exceeded its squared correlation with remaining constructs (Table 2). The results of both analyses indicate sufficient discriminant validity across all constructs.
Discriminant validity coefficients

Note. CP=contextual performance; EH=effectiveness of humor; FH=frequency of humor; ICS=informational communication satisfaction; RCS=relational communication satisfaction; TP=task performance.
Assessment of the structural model
With satisfactory results for the measurement model, the structural model was evaluated. The predictive accuracy of the model was evaluated based on the percentage of the variance explained. According to the results, the model explained 62.1% of the variance in contextual performance, 61.5% in task performance, 9.5% in informational communication satisfaction, and 54.5% in relational communication satisfaction. The predictive relevance developed by Stone (Reference Stone1974) and Geisser (Reference Geisser1975) was used as an additional measure of the model fit. This technique shows the adequacy of a model in predicting manifest indicators of each latent construct. Stone-Geisser Q 2 (cross-validated redundancy) was computed to examine predictive relevance based on the blindfolding procedure in partial least square. Based on the guidelines in Chin (Reference Chin2010), a Q 2 value >0 implies the model to have predictive relevance. In the present study, a value of 0.274 was obtained as average cross-validated redundancy (for all endogenous variables), which is far greater than zero. In summary, the model showed an acceptable fit and a high level of predictive relevance.
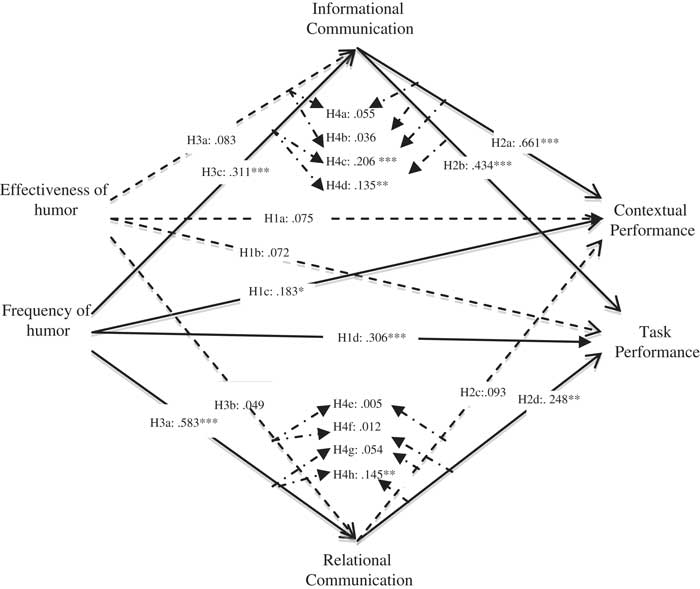
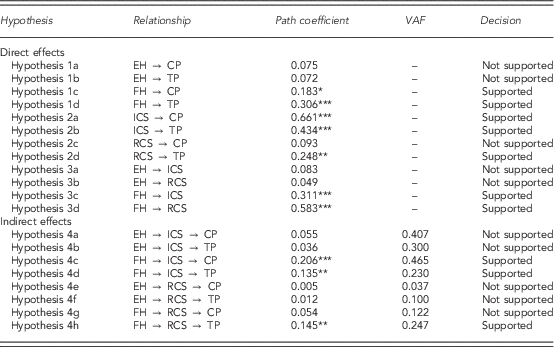
Nonparametric bootstrapping was applied (Wetzels, Odekerken-Schroder, & van Oppen, Reference Wetzels, Odekerken-Schroder and van Oppen2009) using 2,000 replications to test the structural model. Table 3 summarizes the structural model from the PLS analysis. The results for direct effects provide support for Hypothesis 1c, Hypothesis 1d, Hypothesis 2a, Hypothesis 2b, Hypothesis 2d, Hypothesis 3c, and Hypothesis 3d but not for Hypothesis 1a, Hypothesis 1b, Hypothesis 2c, Hypothesis 3a, and Hypothesis 3b (Figure 2).
Path analysis. Dotted lines denote insignificant impact. *p<.05; **p<.01; ***p<.001

Path coefficients and hypothesis testing

Notes. CP=contextual performance; EH=effectiveness of humor; FH=frequency of humor; ICS=informational communication satisfaction; RCS=relational communication satisfaction; TP=task performance; VAF=variance accounted for.
*p<.05; **p<.01; ***p<.001 (one-tailed).
Table 3 estimates eight indirect effects. Hair, Ringle, and Sarstedt (Reference Hair, Ringle and Sarstedt2013) outlined three steps of the mediation analysis. In the first step, the direct effect is significant if the mediator is not included in the model. Although Hair, Ringle, and Sarstedt (Reference Hair, Ringle and Sarstedt2013) suggested the need for a significant direct effect for meditation to occur, some researchers have argued this to be unnecessary (MacKinnon, Krull, & Lockwood, Reference MacKinnon, Krull and Lockwood2000; Zhao, Lynch, & Chen, Reference Zhao, Lynch and Chen2010). In the second step, the indirect effect is significant when the mediator is included. To estimate the significance of the indirect effect, many researchers have employed Sobel’s (Reference Sobel1982) test, the major flaw of which is that it requires the normality assumption of the sampling distribution of the indirect effect (Hayes, Reference Hayes2009), whereas the ab sampling distribution tends to be asymmetric with nonzero values for skewness and kurtosis (Stone & Sobel, Reference Stone and Sobel1990). According to Hayes (Reference Hayes2009), tests that assume the normality of the sampling distribution should not be used to assess indirect effects.
Hayes (Reference Hayes2009) suggested the bootstrapping procedure as an alternative approach to test indirect effects. The t-values for both direct and indirect effects were computed through the bootstrapping procedure with 375 cases and 2,000 samples. It should be noted that t-values for indirect effects were obtained by dividing the indirect effect (ab) by the standard error of the indirect effect. The standard error is the standard deviation of repeated bootstrap estimates of the indirect effect. In the third step, the variance accounted for should exceed 20%. Based on Hair, Ringle, and Sarstedt, Reference Hair, Ringle and Sarstedt2013 mediator analysis procedure, the results provide support for Hypothesis 4c, Hypothesis 4d, and Hypothesis 4h but not for Hypothesis 4a, Hypothesis 4b, Hypothesis 4e, Hypothesis 4f, and Hypothesis 4g (Figure 2).
DISCUSSION AND IMPLICATIONS
The empirical results for the relationship between humor and job performance demonstrate that frequency of humor is significantly related to both contextual and task performance. The significant relationship between humor and contextual and task performance is consistent with the findings of Lovorn (Reference Lovorn2008), who suggested that humor plays an effective role in enhancing employee performance within an organization. It is also consistent with Csikszentmihalyi (Reference Csikszentmihalyi1996) and Duncan (Reference Duncan1982) who claimed that, when positively applied to work environments, humor has a direct positive effect on job performance. When an employee uses humor during work frequently, he or she fosters a pleasant job atmosphere to accomplish his or her job. Thus, the ability to use funny stories in various situations can help employees to successfully achieve contextual performance. Similarly, the frequent use of humor by employees fosters a pleasurable space to enjoy their work; thus, they can finish their tasks more easily.
Based on the existing literature, it was proposed that the effectiveness of humor would have a positive effect on job performance. However, in the present study, the relationship between effectiveness of humor and job performance (contextual and task) was not supported. The lack of a significant relationship between the effectiveness of humor and job performance may be due to the setting of this study, namely IJVs. Specifically, some IJV employees hailed from different cultures from all parts of Iran. When someone uses humor in Iran, he or she should be very careful about various issues related to the country’s cultural and social conditions. There are some old and popular jokes that people from one region make about people from another region. For example, people who live in the capital (Tehran) tell jokes about people who live in Tabriz and other cities, and people from Tabriz tell jokes about people in Tehran and other cities.
These jokes are not favorable and do not have positive effects on the people who are made fun of. Employees who work at IJVs in Iran are from different cities and represent certain local cultures. These employees may not want to make their colleagues unhappy, but when the essence of a funny story they tell is about others’ local culture, it can make their colleagues unhappy. When such humor is used, the effectiveness of humor may no longer enhance job performance.
As hypothesized, this study found a significant relationship between informational communication satisfaction and task performance in line with Ehlers (Reference Ehlers2003), who asserted that job performance is an interesting issue associated with communication. This finding suggests that when employees receive the necessary information for their jobs, they are more likely to perform their tasks better. This highlights the fact that, in cases where the flow of information on personnel news, employee job progress, benefits, changes, achievements, profits, financial standing, policies, goals, and failures within the IJV is sufficient, employees are more likely to use all of the valuable information and show better task performance.
Further, the results show a positive relationship between informational communication satisfaction and contextual performance. This suggests that the flow of useful information on personnel news, employee benefits, job requirements, organizational achievements and failures, changes in the organization, organizational policies, and organizational goals, as well as the presence of proper communication channels for addressing conflicts within the organization, can help employees boost the level of their useful communication within the organization and can increase their contextual performance.
The results also verify a significant positive relationship between relational communication satisfaction and employee task performance in the context of Iran’s automotive IJVs. This suggests that when employees’ relational communication satisfaction is fulfilled, they are likely to show better task performance. Therefore, it indicates that the flow of valuable relational communication satisfaction in the organization positively results in employees’ task performance. When employees feel that the meetings in the organization are well organized; written directives and reports in the organization are clear and concise; and the relationship between employees and their supervisors/managers is at an acceptable level, they are likely to show better task performance.
Based on the findings of this study, there was a significant positive relationship between the frequency of humor and informational as well as relational communication satisfaction, which is consistent with the findings of previous studies. This result suggests that the positive application of humor is likely to facilitate comfortable and effective communication. In other words, comfortable and pleasant communication is directly related to the positive application of humor (Barbato, Graham, & Perse, Reference Barbato, Graham and Perse1997). As mentioned in the existing literature, humor is believed to reduce tension and anxiety and increase a sense of health and happiness (Sokol, Reference Sokol2002, in Lee & Kleiner, Reference Lee and Kleiner2005), communication aptitudes, and joy (Ford, McLaughlin, & Newstrom, Reference Ford, McLaughlin and Newstrom2003). In particular, Lee and Kleiner (Reference Lee and Kleiner2005) claimed that applying humor in a positive manner reduces employees’ nervousness and stress. Therefore, when considering humor in a communication context, reinforcing outcomes of humor should facilitate communication satisfaction.
Finally, the results of this study did not find a significant relationship between effectiveness of humor and communication satisfaction (informational and relational). The first reason for this insignificant relationship could be that there are some employees who tell jokes, but they may not be humorous. Therefore, when such people tell jokes, they cannot positively affect other employees. The second reason might be be due to the fact that there are some special situations in which people are not ready to hear a joke (e.g., they may be in a difficult financial situation and thus do not want others know about it). In such rare situations, telling jokes may not be acceptable for those facing such problems.
The third reason might be that there are some jokes which are very funny, but these jokes are about impolite issues in Iranian culture. Some employees may enjoy hearing them, but there are other employees who do not and with the latter, the positive effect that the joker aims to reach is not provided. The fourth reason is that there may be both male and female employees in an organization. Some jokes told in the workplace are those which male employees tell about females. These types of jokes might be funny for men, but Iranian women typically do not like them when they are expressed by men. Hence, telling these kinds of jokes in the workplace not only makes the joker look foolish or insensitive but also can create an unpleasant environment that impacts employees’ communication satisfaction. This is consistent with the existing literature about Iranian women, who tend to be formal and polite.
The significant effects of frequency of humor on communication satisfaction (contextual and task) as well as job performance have implications for managers in IJVs in Iran. They suggest that managers and decision makers should encourage their employees to use humor in the workplace and convert the organizational culture to a humorous one to enhance the level of their satisfaction with communication with others. In addition, it suggests that that humor should be used to effectively boost employees’ job performance. More precisely, humor should be used at an appropriate time, place, or occasion and by an appropriate individual.
The significant relationship between communication satisfaction and job performance also has implications for managers. It suggests that managers and decision makers should apply an effective communication process to achieve their objectives and to obtain and maintain competitive advantages. The present study asks managers and practitioners in IJVs to focus on the motives that generate positive attitudes among organizational members such as communication satisfaction, which is an easy way to gain a positive attitude on the part of subordinates. Satisfaction with the communication process in an organization can gradually lead to a positive attitude toward the organization’s atmosphere, and employees will try to reciprocate to the company by being more fully engaged in their jobs. Therefore, decision makers and managers should be careful not to take things lightly, especially when they are practicing, training, setting goals, and designing a communication path; and attempting to influence employees’ work values and plan career paths for their employees.
LIMITATIONS AND FUTURE RESEARCH
This study possesses some limitations. First, the data were collected from two of the largest IJVs in Iran, which may limit the generalization of the results to non-IJVs in Iran. Second, humor as a major variable is influenced by the culture and cultural background of a firm’s location. This may limit the generalizability of the results to other settings. In this regard, future research should consider other countries with different cultures to validate the proposed model. Third, most of the measures of this study were adopted from previous studies in western settings, and it is not clear whether the findings are generalizable to non-western settings. Future research should develop questionnaires suited to non-western environments. Finally, the role of gender (differences between male and female employees) in the relationships between humor, communication satisfaction, and job performance should be examined.