The article on the seats-votes curve by Kastellec, Gelman, and Chandler (January 2008, 139–45) presents interesting and helpful analysis and data. Especially important is the insight that incumbency necessarily requires a minority party to receive more than 50% of the vote to gain control of the House of Representatives. However the article is misleading in two respects.
First, the authors seem to have confused “bias” with the bonus that a winning party usually receives in a single-member district system (139). If a party gets 52% of the votes, that party would likely received more than 52% of the seats. As long as this bonus is symmetrical, the system is not “biased.” I would also add that the advantage a party receives by having more incumbents, again if symmetrical, should probably not be considered bias—or at least not a bias in the redistricting.
Second, I am not sure that the district average vote is the best way to determine whether the Democrats or the Republicans won “more votes” (139) in recent elections. Let me suggest a method that is better for this particular purpose.
Determining the percentage of the two-party votes received by Democratic candidates for the House requires attention to two questions, neither of which is addressed in this article. The first question is how to count elections in Louisiana and Texas, which have majority vote requirements. If there was no run-off election between a Democrat and a Republican in a Louisiana or Texas district, I counted the first election as the election. In Louisiana the Democratic vote in such elections is the total vote for all Democratic candidates, and the Republican vote is the vote for all Republican candidates. If there is a run-off election between a Democrat and a Republican, I counted that as the election.
A second question is what to do with unopposed contests. I define an opposed contest as one in which there was both a Republican and a Democratic candidate. If the vote in unopposed contests is included, the total for the party that had the most unopposed candidates is inflated, because their opponents would have received at least some votes. If the vote of the unopposed candidates is excluded, the vote of the party with the most unopposed candidates is understated because unopposed candidates would undoubtedly receive a substantial majority of the votes if they were opposed.
One way to deal with this problem is to substitute the vote of some other set of candidates in districts where the congressional candidate is unopposed. But on a nationwide basis the only office available for that job is the presidency, and that is only available in half the congressional elections. Moreover, this is exactly the wrong office to use. There is great variation in presidential and congressional voting as shown by Burden and Kimball (Reference Burden and Kimball2004). Votes for U.S. Senate or governor could be substituted into unopposed races, but this also has problems. Voters typically know more about candidates for these offices, only 33 or 34 of the states have a Senate election in any year, and most governors now have four-year terms.
My solution is to estimate the vote that each party would receive in unopposed contests and add this to the vote in the opposed races. The formulas for the adjustment of the vote for each party are:

where
d = estimate of Democratic vote
r = estimate of Republican vote
x = vote for all opposed Democratic candidates
y = vote for all opposed Republican candidates
a = number of unopposed Democratic candidates
b = number of unopposed Republican candidates
m = mean number of votes cast for both Republican and Democratic candidates in opposed contests
v = proportion of the vote that unopposed candidates would have received if they had been in an opposed contest
The two-party voter turnout in unopposed districts is assumed to be equal to the mean turnout in opposed contests. This is designated as m in the formula. This is a reasonable assumption as Huckfeldt et al. (Reference Huckfeldt, Carmines, Mondak and Zeemering2007) report:
no discernible effects are produced [on turnout] by the perception or the reality of House district competitiveness, the presence or absence of a contested race, the level of House campaign spending, or the competitiveness of states races for governor and the U.S. Senate seat.
Jacobson (Reference Jacobson1993) estimates the percentage of the vote that we would expect unopposed candidates would have received, on average, if they had been opposed (v in the formula) at 71% with a standard deviation of 10%. His analysis is based on the support that congressional candidates received in the election following or preceding the one in which they were not opposed.
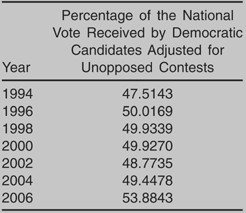
With this calculation I derived the percentage of the two-party vote that the Democrats received in recent elections as presented in Table 1. These figures deviate little from the “Total Vote” figures given in the authors' Figure 3. But my figures show that only in 1996 did the party that received the most votes fail to receive the most seats in Congress. This is in contrast to the implication of the article (139 and Figure 1) that the Democrats won a majority of the votes in 1996, 1998, 2000, and 2004. Given the possible statistical variation in the authors' statistics and in mine, a fair interpretation of the results of the elections in these years is that the results were too close to call either way.
Percentage of the National Vote Received by Democratic Candidates Adjusted for Unopposed Contests