1. INTRODUCTION
Over recent years, there has been an intensive development of techniques for mobile users' localisation. This phenomenon arose from the necessity of mobile operators to implement emergency call services (E112 (CGALIES, 2002) and E911 (FCC, 2001), for Europe and USA, respectively). On the other hand, development of positioning techniques led to the launch of various commercial LBS (Location-Based Services), (Filjar et al., Reference Filjar, Jezic and Matijasevic2008). Nowadays, satellite infrastructure, through its most popular system – the Global Positioning System (GPS) – is widely used to estimate mobile users' position. However, limitations of this approach are vulnerability to multipath and shadowing in urban canyons (Wang et al., Reference Wang, Groves and Ziebart2012) and weak signal levels in indoor environments. As an alternative to GPS, Public Land Mobile Networks (PLMN) -based techniques, which use terrestrial cellular network infrastructure, mostly using Global System for Mobile Communications (GSM), Digital Communication System (DCS) or Universal Mobile Telecommunications System (UMTS) can be used. These techniques have not yet reached the accuracy of satellite-based techniques. Nevertheless, they can provide location information in both indoor and built-up outdoor environments.
Generally, PLMN-based positioning techniques can be based on Received Signal Strength (RSS), Time of Arrival (TOA), Time Difference of Arrival (TDOA), Angle of Arrival (AOA), power delay profile or by a combination of previously stated parameters (Sun et al., Reference Sun, Chen, Guo and Liu2005). Depending on the approach, these techniques can have different impacts on both the network and handset. The time-based methods (TOA/TDOA) require the deployment of Location Measurement Units (LMUs), the network elements that estimate the real time difference between the base stations (BSs). At the same time, the handset typically requires software modifications to enable positioning functionality with such methods. The AOA-based methods require the implementation of adaptive antenna arrays and specialised receivers at the BSs, by which the direction of signal arrival can be estimated. On the other hand, RSS-based techniques do not require any extra measurement hardware in the handsets and BSs, nor strict synchronisation between BSs.
The work presented in this paper aims at initial position determination of a mobile user using the PLMN's RSS measurements. We used RSS measurements from the BSs of the world's most widespread PLMN system – GSM. Nonetheless, the presented methodology can also be applied in other contemporary cell-based PLMNs (DCS, UMTS, LTE, etc), since the process of measuring and reporting RSS values back from mobile station (MS) to the network represents standard procedure in all of them. On the opposite of the initial position determination approach investigated in this paper, there are tracking algorithms that use time series of location dependent information in order to improve overall positioning accuracy (Zaidi and Mark, Reference Zaidi and Mark2005). However, they are beyond the scope of this paper.
For finding the nonlinear relation that exists between RSS measurements and spatial coordinates within observed area, Support Vector Machine (SVM) algorithms (Bishop, Reference Bishop2006; Shawe-Taylor and Cristianini, Reference Shawe-Taylor and Cristianini2004) were used. SVM represents a group of pattern analysis algorithms intended for solving nonlinear classification, regression or novelty detection problems. Based on the type of a problem, they can be roughly classified into Support Vector Classification (SVC) and Support Vector Regression (SVR) algorithms (Bishop, Reference Bishop2006). The capability of resolving nonlinear problems was the main motivation for using SVM. SVM algorithms are considered as optimisation techniques, where determining the relation in a set of data corresponds to solving a convex optimisation problem, and hence provides a global optimal solution (Bishop, Reference Bishop2006; Shawe-Taylor and Cristianini, Reference Shawe-Taylor and Cristianini2004). Moreover, due to the property of sparseness (Bishop, Reference Bishop2006), SVM algorithms have high on-line execution speed, which makes them a good solution for real-time applications with low latency requirements.
Regarding positioning, SVM algorithms were previously used either as SVC classifiers of area (Xuereb and Debono, Reference Xuereb and Debono2010) or SVR estimators of position (Sun and Guo, Reference Sun and Guo2005; Jiyan et al., Reference Jiyan, Guan and Qun2011; Wu et al., Reference Wu, Li, Ng and Leung2007). Sun and Guo (Reference Sun and Guo2005) and Jiyan et al. (Reference Jiyan, Guan and Qun2011) used simulated TOA measurements for mobile users' position estimation based on least-square SVM (LS-SVM) and weighted LS-SVM, respectively, i.e. a quadratic loss function was used in the optimisation criterion. Both models were implemented for simulated environments and their practical implementation requires that base and mobile stations have precisely synchronised clocks. Moreover, the transmitting signal must be labelled with a timestamp in order for the receiver to discern the distance the signal has travelled. In Wu et al. (Reference Wu, Li, Ng and Leung2007), positioning models were implemented using field measurements. For each measurement location, its fingerprint was taken and stored in a database, which was used for model training and verification. Each fingerprint contained RSS values from n BSs and coordinates of the location. Two approaches were proposed for solving the problem of missing RSS values in some database fingerprints due to a different radio visibility of detected BSs within the observed area. In both approaches, a linear ε-insensitive loss function was used in the optimisation criterion. In the first approach, a novel kernel function (Sum of Exponentials, SoE), which discards the part of feature-to-feature calculation involving the missing RSS values, was proposed. However, this could easily make a kernel value deviate from the true value if too many feature terms are thrown away. In the second approach, Radial Basis Function (RBF) was applied and missing RSS values were replaced with zeros, which do not quantify the true signal levels of distant BSs in the right manner.
In this paper two models for initial position determination based on RSS measurements are presented. In the first model, a SVR algorithm was applied. In contrast to Wu et al. (Reference Wu, Li, Ng and Leung2007), we propose the use of a Laplace kernel function where missing RSS values in database fingerprints are replaced with a fixed value below the receiver threshold, which was later shown to provide better performances. Moreover, a quadratic ε-insensitive loss function was used in the optimisation criterion in order to suppress large output errors. Regarding the second positioning model, a novel method for location estimation based on the combination of both SVC and SVR algorithms was introduced. Precisely, we used the space-partitioning principle, where a user is first localised in a smaller sub-area of the observed geographical environment, after which a regression algorithm is used for determining the exact spatial coordinates of the user's position. The main motivation in this case was to investigate the impact of the sub-area size reduction, in which the user is initially located, on the accuracy performance of the later applied SVR positioning algorithm. Both types of positioning model were implemented and tested using field RSS measurements, collected in a suburban area from a GSM network, optimized for customer services.
The remainder of this paper is organised as follows: Section 2 gives an overview of related research regarding PLMN-based positioning. The proposed network-based positioning method is introduced in Section 3. The implementation of positioning models is described in Section 4. Performances of proposed models, regarding accuracy, complexity and latency, are investigated in Section 5. Conclusions are drawn in Section 6.
2. RELATED WORK
There are a number of standardised positioning solutions for GSM (3GPP TS 43.059, 2008) and UMTS (3GPP TS 25.305, 2008). The simplest PLMN-based positioning technique is based on Cell-ID information (Sun et al., Reference Sun, Chen, Guo and Liu2005). Although it requires no changes on the side of existing PLMN networks or handsets, positioning accuracy depends strictly on the size of the cell, the radius of which can extend up to 35 km in rural areas. One of the approaches for improving accuracy is combining the Cell-ID information with the Timing Advance (TA) parameter in GSM (3GPP TS 43.059, 2008) or Round Trip Time (RTT) parameter in the UMTS network (3GPP TS 25.305, 2008). The main drawback of these approaches is that usually only one timing parameter, belonging to the serving BS (or Node B), can be obtained. Hence, the mobile user is localised in a ring of a certain radius around the serving BS, or in a part of the ring, in the case of sectored BS. Spirito and Mattioli (Reference Spirito and Mattioli1999) have tested the Cell-ID + TA trilateration method using TA parameters collected during field trials in urban and rural environments. However, since TA parameters from only one BS are available at a time, this technique cannot be implemented using standardised GSM signalling. In the case of UMTS, it is possible to obtain more than one RTT parameter when there are two or more Node Bs in the active set (e.g. in the case of soft/softer handover). For simulated urban environments, the obtained 67th percentile positioning error was 60 m to 100 m (60 m–100 m|67%) depending on the number of available RTT parameters (Borkowski and Lempiäinen, Reference Borkowski and Lempiäinen2006). Nevertheless, the RTT parameter is not available in all UMTS networks. The Adaptive Enhanced Cell-ID (AECID) positioning method, introduced in Wigren (Reference Wigren2007), combines Cell-ID information of serving and neighbouring BSs with TA and signal strength measurements. The results obtained in a field trial (Shi and Wigren, Reference Shi and Wigren2009) showed that the AECID method can achieve accuracy more than four times better than the Cell-ID+TA. Further enhancements to the AECID method, with the aim of fully exploiting TA and RTT measurements, are presented in Wigren (Reference Wigren2012).
Most of the other positioning algorithms enrich the Cell-ID information with RSS measurements. Simulation results using statistical modelling of RSS (Roos et al., Reference Roos, Myllymäki and Tirri2002) achieved accuracy of 320 m|67%. The use of the Okumura propagation model for modelling probability distribution functions of RSS values (Yamamoto et al., Reference Yamamoto, Matsutani, Matsuki, Oono and Ohtsuka2001) achieved accuracy of 53 m|67% when tested on field data in an urban environment. RSS Multiple Path-loss Exponent Algorithm (RSS-MPLE) positioning algorithm, which estimates unknown propagation parameters of the path-loss model and determines MS position based on the RSS measurements and known BSs positions, achieved accuracy of 160 m|67% in a simulated environment (Zeytinci et al., Reference Zeytinci, Sari, Harmanci, Anarim and Akar2013). However, the implementations of previously mentioned positioning models require knowledge of BSs positions, transmitted powers, antenna directions, heights, gains and radiation patterns, etc.
The other very popular direction in positioning is utilisation of fingerprinting algorithms, such as Database Correlation Method (DCM) (Laitinen et al., Reference Laitinen, Lahteenmaki and Nordstorm2001) and Artificial Neural Networks (ANN) (Hassoun, Reference Hassoun1995). These algorithms require databases with measured or simulated data to be created prior to the position estimation. Although creating a database with field measurements can be quite time-consuming, this approach allows positioning without the need of knowing and modelling radio propagation conditions of certain environments. Regarding data correlation algorithms, the most often used are the Nearest Neighbour (NN), k Nearest Neighbours (kNN) and Weighted k Nearest Neighbours (WkNN) algorithms (Bhatia and Vandana, Reference Bhatia and Vandana2010). A DCM model constructed from field RSS measurements achieved an accuracy of 74 m|67% in suburban and 44 m|67% in urban environments, using the NN algorithm (Laitinen et al., Reference Laitinen, Lahteenmaki and Nordstorm2001). A WkNN-based model achieved average positioning error of 112 m in a real urban environment (Lakmali et al., Reference Lakmali, Wijesinghe, De Silva, Liyanagama and Dias2007). Regarding ANN models, an accuracy of 50 m|67% was achieved using field RSS measurements from urban environments (Takenga et al., Reference Takenga, Wen and Kyamakya2006). An ANN model, trained using an Extended Kalman Filter (EKF), on the opposite of commonly used gradient descent schemes, achieved positioning errors of 55 m–70 m with low error variance (Anne et al., Reference Anne, Kyamakya, Erbas, Takenga and Chedjou2004). The use of time-delayed neural networks with sequential field RSS measurements achieved an accuracy of 110 m|67% (Fung et al., Reference Fung, Lu and Hsu2012).
As mentioned before, a few SVM-based solutions have also been proposed. For SVR models that use RSS measurements (Wu et al., Reference Wu, Li, Ng and Leung2007), field tests in metropolitan areas resulted in a median error of 75 m–100 m. Using simulated TOA data, a LS-SVM model (Sun and Guo, Reference Sun and Guo2005) achieved an accuracy of 55 m|67%, while a weighted LS-SVM model (Jiyan et al., Reference Jiyan, Guan and Qun2011) achieved a mean error of 35 m.
3. POSITIONING METHOD
In the case of the network-based positioning method proposed in this paper, the separate positioning model is to be defined for each BS site of a GSM network, based on real measurement data collected in its coverage area. The overall functioning of the proposed positioning algorithm is illustrated in Figure 1. Estimation of the unknown position of a mobile user is done based on the RSS values of the serving and six neighbouring BSs, which the MS measures at its current position. The MS periodically measures signal levels of serving and neighbouring BSs as part of standardised procedure, which allows monitoring of a mobile user's mobility in idle mode or handover during the established call. The MS sends measured RSS values to its serving BS in the form of RxLev parameters as a part of the standardised Measurement Report. The serving BS forwards the measured RSS values via the Base Station Controller (BSC) to a Serving Mobile Location Centre (SMLC), where the position of the mobile user is calculated (Figure 1). Since the transfer of seven RSS values, measured from the serving and six neighbouring BSs, is supported by the existing GSM signalling, the implementation of the proposed positioning technique does not require any changes to handsets. Some changes, regarding the implementation of the SMLCs in the network and the deployment of positioning models in SMLCs, are needed on the network side. In the SMLC, the separate positioning model for each GSM BS site, which is within jurisdiction of that SMLC, is to be implemented. Selection of an appropriate positioning model is done based on the Cell-ID of BS with the highest RSS value reported through the Measurement Report. The reason for not choosing the positioning model of serving BS is due to some system functionalities (ping-pong handover effect, load balancing, etc.) that can lead to the situation where the serving BS is not the one closest to the MS.
Illustration of overall functioning of the proposed positioning method.

After the selection of the corresponding positioning model, RSS values from the Measurement Report are mapped to the corresponding model inputs (MIs). Each positioning model has seven inputs, which are the RSS values of the particular set of BSs, so-called relevant BSs. For each model, the top seven BSs with the highest probability of radio visibility throughout the model coverage area (i.e. which signal level is above reception threshold in most locations) are chosen as the relevant BSs. The mapping was introduced in order to cope with the fact that at different locations within the model coverage area, different BSs are visible. During the mapping process, measured RSSs from BSs that are not relevant for the chosen positioning model are discarded. On the other hand, missing MIs, that do not have corresponding RSS values in the Measurement Report, are entered with the threshold value of −110 dBm. Addressing a fixed value of −110 dBm to unobserved relevant BSs also provides a solution for cases where less than six neighbouring BSs are observed in the Measurement Report.
After the mapping is finished, the selected positioning model in the SMLC is used to estimate coordinates of the user's current position based on MIs, by using SVR (simple SVR model) or combination of SVC and SVR algorithms (combined SVC&SVR model). In the first case, the coordinates are estimated directly based on MIs, whereas in the second case, the mobile user is first located in a smaller area using SVC, after which precise position is determined using SVR.
In order to be used for positioning, SVR and SVC&SVR models have to be previously trained. In off-line phase, the set of collected fingerprints is used to train the model and determine the relation which links measured RSS values to a certain area (in the case of SVC) or specific position (in the case of SVR). The training process consists of mapping data from its original space to a feature space of higher dimensionality, where nonlinear relations within the set of data can be represented by using simple linear functions (Bishop, Reference Bishop2006). The problem of increased complexity, as the result of introduced feature space, is solved using special kernel functions. Kernel functions implicitly introduce a feature space by using the so-called “kernel trick” (Bishop, Reference Bishop2006), which eliminates the actual need of knowing the mapping function and provides the same computational complexity as in original space. In the on-line phase, after the model is trained, the learned relations are used to estimate the area (SVC) and/or coordinates (SVR) of a mobile user's current position based on measured RSS values.
Concerning the existence of training and on-line phase, SVM-based models are close to ANNs. However, the significant advantage of the SVM over ANN is that ANN can suffer from multiple local minima, whereas, due to convex optimisation, the solution provided by SVM is global and unique (Burges, Reference Burges1998; Bishop, Reference Bishop2006). Moreover, ANNs use empirical risk minimisation, while SVMs use structural risk minimisation (Burges, Reference Burges1998), which seeks to prevent over-fitting by incorporating a regularisation parameter. Hence, SVMs are less prone to over-fitting to training data and provide good generalisation performance.
4. POSITIONING MODELS IMPLEMENTATION
Two types of positioning models were implemented: simple SVR and combined SVC&SVR. In the case of the SVC&SVR model, a SVR sub-model is designed to estimate a user's position in the smaller part of the originally observed geographical area. Due to the smaller size of the sub-area, the fingerprints collected within it and used for SVR sub-model training are more similar in terms of both RSS values and spatial coordinates. This provides better initial conditions for the interpolation of the unknown position coordinates, based upon the obtained RSS measurements. The influence of the sub-area size reduction on the model positioning accuracy was inspected by dividing the entire coverage area into four and 16 sub-areas and creating two sub-types of SVC&SVR model, SVC&SVR2×2 and SVC&SVR4×4, respectively. Model generation (training) and later verification was done using field data gathered during a measurement campaign, carried out with the drive-test system in the territory of Belgrade city. Implementation of the proposed positioning models was done in MATLAB, using the SVM toolbox (Gun, Reference Gun1998).
4.1. Data Collection
All proposed positioning models were developed for a BS site of the Serbian national mobile network operator Mobilne Telefonije Srbije (MTS), located in a suburban, flat terrain area, with densely spaced lower residential buildings. For collecting RSS data within the observed area, a Radio Network Analyser – a Rohde&Schwarz TSMQ (R&S®TSMQ) – was used as network scanner. The reason for choosing network scanner rather than a handset in off-line phase was to obtain as many RSS readings per measurement location as possible, in order to get better insight into the radio visibility of BSs within the observed area and choose relevant BSs more properly. Geographic coordinates of measurement points were obtained using a differential GPS receiver, which has a median positioning error of less than 5 m. Measured RSS and GPS data were acquired using a laptop computer equipped with ‘R&S Romes v4’ software.
The geographical area from which the measurements are used to train the SVR and SVC&SVR models and furthermore in which the proposed models can estimate the users' positions, is referred to as the model area. The shape of this area was chosen to be circular, centred on the position of the MTS BS site for which the models were developed. To determine the radius of the model area, the measurement points where the highest measured RSS was received from the chosen cell were selected first. Next, the radius was chosen (in 100 m steps) so that more than 99·9% of the observed measurement points were inside this area. This kind of limitation had to be introduced in order to minimise the model area size. This procedure resulted in a database of measurements obtained from 31 391 points inside a 1 km radius from the chosen BS site. The geographical area to which proposed positioning models refer is given in Figure 2. The green “+” sign denotes the position of the MTS BS. The values of x and y coordinates are defined relative to the position of the MTS BS site, which was used as the reference. Seven relevant GSM BSs with the highest probability of radio visibility throughout the observed model area were determined, and their RSS values were used as model inputs.
SVR and SVC&SVR model area.
4.2. Models design
We considered the mobile user's position determination as a two-dimensional (2D) problem. Hence, the SVR model is implemented with two sub-models, SVRx and SVRy, responsible for determining the relation between measured RSS values and x, and RSS values and y coordinates, respectively. Together these two sub-models form the SVR model for positioning in a 2D space, as presented in Figure 3. The RSS measurements from an unknown location are mapped into seven MIs, which are then forwarded to the SVRx and SVRy sub-models, used for estimating x and y coordinates, respectively.
SVR model structure.
In the case of the SVC&SVR model, the observed model area is divided into four (SVC&SVR2×2) and 16 (SVC&SVR4×4) subareas, as shown in Figures 4a and 4b, respectively. These models are designed as cascade structures, consisting of SVC layer(s) and SVR layer. The SVC&SVR2×2 and SVC&SVR4×4 model structures are presented in Figures 5 and 6, respectively.
Division of the model area into subareas for: a) SVC&SVR2×2 and b) SVC&SVR4×4.
SVC&SVR2×2 model structure.
SVC&SVR4×4 model structure.
The SVC layers are responsible for estimating the sub-area where the mobile user currently resides, which represents the multiclass problem (Hsu and Lin, Reference Hsu and Lin2002). In the case of the SVC&SVR2×2 model, this problem was solved by using four binary SVC classifiers, in the so-called “one-against-all” approach (Rifkin and Klautau, Reference Rifkin and Klautau2004). This approach decomposes the multiclass problem of M classes into M independent binary classification tasks. On the other hand, in the case of the SVC&SVR4×4 model, the multiclass problem was solved using a nested structure, where the “one-against-all” approach was applied in two stages. First, the mobile user is located in the sub-area of the same size as in the SVC&SVR2×2 model (sub-areas I–IV in Figure 4b), by using four binary SVC classifiers (SVC layer I). In the following step, the mobile user is located in one of the four smaller zones of the sub-area from previous layer (zones 1–16 in Figures 4b), by using four SVC classifiers designed for solving the multiclass problem in the observed sub-area (SVC layer II). Afterwards, x and y coordinates of the mobile user's current position are estimated by the appropriate SVR sub-model of the SVR layer. The SVR sub-models have the same structure as the previously described SVR model in Figure 3 and their number equals the total number of model sub-areas. The reason for introducing the nested structure, as opposed to “one-versus-all” approach with 16 binary SVC classifiers in one layer, is in the reduction of the amount of training data required, and thus the time needed for training SVC sub-models, which will be shown later in Section 5.
In the case of the SVC&SVR models, the RSS values measured at one location are mapped into the corresponding seven MIs, which are the input of the first SVC layer (for the SVC&SVR2×2 model, the only one). Each SVCi sub-model of the first SVC layer (i=1..4 for SVC&SVR2×2 or i=I..IV for SVC&SVR4×4) represents a binary classifier that provides information whether the user is in sub-area i or not. Regarding the standard formulation of the SVC (Burges, Reference Burges1998, Bishop, Reference Bishop2006), the SVCi sub-model can have two possible outputs “−1” (if the input RSS vector is measured at a location belonging to sub-area i) or “1” (if it does not belong to that sub-area). That means, if g i is the model function of a trained SVCi classifier, then the output of the SVCi (noted as f i in Figures 5 and 6) is the sign of the g i function evaluated at current MIs. Therefore, the subarea i is chosen as the correct one if the SVCi sub-model has generated value “−1” at its output.
However, the problem with this approach is the possible ambiguity in classification, e.g. none of the SVCi sub-models has generated “−1” or few of them have. Hence, the output of each binary SVCi classifier is modified to be the g i function evaluated at current MIs. Therefore, the decision about correct sub-area is made based on the minimum output value of all SVC sub-models (Hsu and Lin, Reference Hsu and Lin2002). In other words, the mobile user is located in sub-area i if the output of the corresponding SVCi sub-model has the minimum value, compared to the outputs of all other SVC sub-models. If there is more than one SVC layer, as in the SVC&SVR4×4 model, the MIs are next forwarded to the corresponding group of four SVC sub-models in SVC layer II (Figure 6) and the same procedure is applied. After determining the final sub-area in which the mobile user is located, the MIs are forwarded to the corresponding SVRi sub-model (i=1..4 for SVC&SVR2×2 or i=1..16 for SVC&SVR4×4). Next, the chosen SVRi sub-model estimates x and y coordinates of the mobile user's current position.
4.3. Models implementation and optimisation
The proposed positioning models were implemented in MATLAB. The training and later verification of models was done on an Intel Core 2 Quad Processor @2.4 GHz with 2GB of RAM. The overall measurement database was randomly divided into three separated data sets for training, cross-validation (Hassoun, Reference Hassoun1995) and later verification, consisting of 15%, 35% and 50% of measurements, respectively.
In the case of the SVR model, the entire training data set was used. However, in the case of the SVC&SVR2×2 model, only the SVCi sub-models (i=1..4) were trained with data originating from the entire model area, while the SVRi sub-models (i=1..4) were trained with the subset of the original training set, containing only the measurements from the corresponding subarea i. Moreover, in the case of the SVC&SVR4×4 model with the nested structure, each SVCk sub-model (k=1..16) of the SVC layer II was trained with the subset of training data originating from the corresponding sub-area i (i=I..IV) and SVRk sub-model (k=1..16) of the SVR layer with the subset of training data originating from the corresponding sub-area k.
During the training process, a quadratic ε-insensitive loss function was used in the optimisation criterion (Shawe-Taylor and Cristianini, Reference Shawe-Taylor and Cristianini2004) in order to suppress large output errors. Since the result of the model training depends highly on the choice of the kernel function, its parameters and the cost parameter C in the optimisation criterion, the cross-validation procedure was performed in order to determine their optimal values and prevent over-fitting of the positioning model to the noise training data. The cross-validation of all the models was done using the same cross-validation data set. Regarding the choice of kernel function, the performances of Exponential RBF, Laplace, Generalized T-Student and Cauchy kernel functions were tested. For each type of kernel function, proposed models were optimally trained so that the average positioning error of each model, calculated on cross-validation data set, was minimal. Positioning error (distance error, DE), was defined as the Euclidian distance between the actual and estimated position of a mobile user. The Laplace kernel was chosen as the best solution for modelling the relation between RSS measurements and spatial coordinates, since it produced minimal average DE for the proposed models.
5. PERFORMANCE ASSESSMENT
5.1. Models accuracy verification
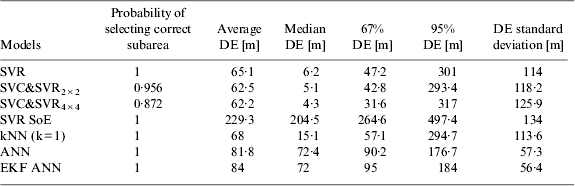
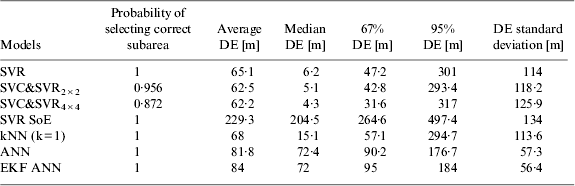
The positioning accuracy of previously optimally trained SVR, SVC&SVR2×2 and SVC&SVR4×4 models was next verified using the remaining 50% of measurement data. The accuracy verification results are presented in Table 1 and the cumulative distribution functions (CDFs) of DEs are overlapped in Figure 7. Both the SVR and SVC&SVR models have demonstrated good accuracy performances in terms of median and 67% DE. In addition, in the case of the SVC&SVR models, an improvement of accuracy is observed compared to the SVR model. Due to better initial conditions for solving the regression problem, as a result of reducing the SVR model area size, the decrease of average, median and 67% DE can be noted. Moreover, the improvement in accuracy can be noted with the increase of the number of subareas. Compared to the SVR model, the biggest improvement was in terms of the reduction of medium sized DEs, which mostly influenced the value of 67% DE. On the other hand, both the SVR and SVC&SVR models have demonstrated poorer accuracy performances regarding 95% DE, due to a certain number of large DEs. Large DEs are associated with the measurement locations in which, due to specific propagation conditions, the number of reported RSS values belonging to relevant BSs has dropped unexpectedly, compared to other nearby measurement locations. By entering a fixed threshold value of −110 dBm in the places of missing MIs, the true information about the position of MS relative to those relevant BSs is lost. In some cases, especially where less than three relevant BSs were observed, this led to situations in which after mapping, the RSS fingerprint obtained at one measurement location became more similar to RSS fingerprints obtained at some distant locations, than to those gathered nearby. The existence of these types of points in the training set (spatially distant with similar MIs) has created worse conditions for solving the regression problem. Hence, the models have produced large DEs for the test points similar to them. However, as will be shown later, this approach of handling missing MI values has proved to be more robust compared to Wu et al. (Reference Wu, Li, Ng and Leung2007). In the case of the SVC&SVR models, 95% DE is influenced additionally by the cases where the subarea is incorrectly selected. It should be noted that the variance of the DE in these models can be significant. For instance, if the SVC layer(s) selected the adjacent sub-area to the actual one, DE may not be large. On the other hand, if the selected sub-area is not adjacent to the correct one, the DE could be very large. Likewise, there is no strict rule for behaviour of the DEs in the incorrect sub-areas. Hence, in the case of the SVC&SVR2×2 model, where in 95% of cases the correct sub-area was selected, the benefit of reducing model area size seems to overcome the problem of selecting incorrect sub-area and the value of 95% DE decreased, compared to the SVR model. In the case of the SVC&SVR4×4 model, the incorrect selection of subarea in SVC layer I increased the probability of selecting the sub-area in SVC layer II that is not adjacent to the correct one, and therefore, resulted in somewhat bigger 95% DE.
Comparison of DE CDFs: SVR, SVC&SVR2×2, SVC&SVR4×4, SVR SoE, kNN, ANN and EKF trained ANN.
Accuracy verification results of SVR, SVC&SVR2×2 and SVC&SVR4×4 models, in comparison with SVR SoE, kNN, ANN and EKF trained ANN.
The big variance in achieved DEs (the large number of small DEs and the certain number of large DEs) caused deviation of the average DE from the median DE, for both the SVR and SVC&SVR models.
However, it should be noted that both the SVR and SVC&SVR models were designed for the purpose of initial position determination. The shape of the DE cumulative distribution functions of proposed models is favourable for the use of overlaid tracking algorithms that would, presumably, filter out large distance errors and additionally improve the positioning performances (mostly average DE). Moreover, by introducing an overlaid tracking algorithm to the SVC&SVR models, where the value of 95% DE is influenced additionally by the incorrect sub-area selection, the benefit of reducing sub-area size, to which SVR is applied, is expected to be more notable. However, this will be the subject of further research.
To credibly verify the performances of the proposed SVR, SVC&SVR2×2 and SVC&SVR4×4 models, we have applied the exact same field data to some of the most promising techniques from Section 2: SVR with SoE kernel function – SVR SoE (Wu et al., Reference Wu, Li, Ng and Leung2007), DCM (Laitinen et al., Reference Laitinen, Lahteenmaki and Nordstorm2001), ANN (Takenga et al., Reference Takenga, Wen and Kyamakya2006) and EKF trained ANN (Anne et al., Reference Anne, Kyamakya, Erbas, Takenga and Chedjou2004). SVR SoE was chosen in order to credibly verify the proposed approach for handling missing RSS values in the database. DCM was chosen because it is considered to be one of the best fingerprinting algorithms, whereas the ANN and EKF trained ANN were chosen because of the promising results published (the best performances among all the related works that have been verified with the field measurements). Regarding DCM, we have tested both kNN and WkNN algorithms for the values of k ranging from 1 to 10. Although WkNN is commonly known to outperform the respective kNN algorithms, in our case, the best performances were observed for k=1, i.e. for the basic NN model. Due to good properties of ANN and EKF trained ANN models regarding required training times, they were tested for different numbers of model inputs in order to find the best model in terms of accuracy that can be implemented using the gathered field data. The best performance was obtained for models with 32 MIs, i.e. when seven highest RSSs from the Measurement Report were mapped to RSS values belonging to 32 relevant BSs. The accuracy verification results for SVR SoE, kNN (k=1), ANN and EKF trained ANN (EKF ANN) models are presented in Table 1, while corresponding DE CDFs are plotted in Figure 7. The proposed SVR and SVC&SVR models have shown somewhat better performance than the kNN model. On the other hand, they have quite outperformed the SVR SoE model. The poor performance of SVR SoE model can be explained as the consequence of using the SoE kernel. Instead of entering a fixed value (e.g. the threshold value of −110 dBm) in place of the missing MIs, the SoE kernel discards the part of fingerprint-to-fingerprint calculation involving the missing MIs (e.g. if one fingerprint contains RSS measurements from all seven relevant BSs and the other only three, the SoE kernel discards four valuable RSSs in fingerprint-to-fingerprint calculation). Hence, this approach is less suitable for areas with bigger variations in radio visibility of relevant BSs. The proposed SVR and SVC&SVR models have demonstrated better performances in terms of median and 67% DE compared to ANN and EKF ANN. However, due to a higher number of MIs (relevant BSs) in the case of ANN and EKF ANN, the number of cases in which after mapping, the RSS fingerprint obtained at one location is more similar to the RSS fingerprints obtained at some remote locations, reduced. Hence, the number of large DEs decreased, resulting in a smaller 95% DE compared to the SVR and SVC&SVR models.
The overall presented results show that the SVR and SVC&SVR models can provide good positioning accuracy in terms of the median and 67% DE. Moreover, the SVC&SVR models showed improvement compared to the SVR model. As mentioned before, a certain number of large DEs, especially in the case of the SVC&SVR models (as the result of incorrect subarea selection) can be further reduced by introducing an overlaid tracking algorithm. Hence, the benefit of reducing the subarea size in the case of the SVC&SVR models is expected to be more notable.
5.2. Models complexity and latency
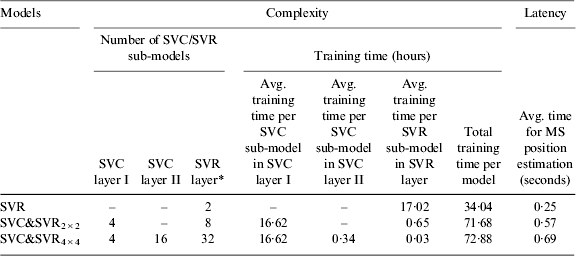
Besides the time needed for creating the measurement database, the complexity of the proposed models is considered as the time required for optimal model training. All proposed models have long training times, mostly due to the training set size (Table 2). Moreover, dividing the model area into sub-areas and increasing the number of SVC and SVR sub-models augments complexity significantly. However, the further increase in the number of sub-areas does not have significant influence on the total training time because of the nested structure used. Although the required number of SVC classifiers is bigger than in the “one-against-all” approach, the SVC sub-models of the second layer are trained only with part of the original training set, which significantly reduces training time.
Models complexity and latency.
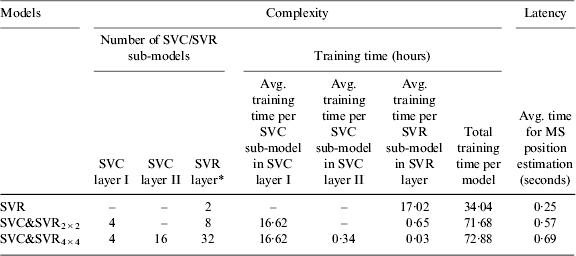
* Each SVR sub-model consists of SVRx and SVRy sub-models.
It should be noted that times presented in Table 2 are obtained using an Intel Core 2 Quad Processor with 2GB of RAM. By using newer versions of processors, training times would be shorter. Generally, training complexity of SVM is between O(N 2) and O(N 3) with N being the number of training samples (Bottou et al., Reference Bottou, Chapelle, DeCoste and Weston2007). For comparison, ANN has complexity of O(N) (training time around six hours in our case). However, there are some prominent methods for speeding up the training process by using decomposition, such as sequential (Platt, Reference Platt1999) or combination of parallel and sequential minimal optimisation (Dong et al, Reference Dong, Krzyzak and Suen2005). They can reduce complexity of SVM to nearly O(N) and therefore significantly decrease required training times.
In spite of everything, the proposed models are quite efficient in the on-line phase due to the SVM property of sparseness. This implies that prediction for new input in the on-line phase depends only on the kernel function evaluated at a subset of the training data points, called support vectors (Bishop, Reference Bishop2006). Since the average time needed for each model to provide positioning information is less than a second, the proposed models can be considered as good solutions for positioning purposes.
6. CONCLUSION
In this paper, two SVM-based models for initial position determination based on RSS measurements from the world's most widespread PLMN system – GSM – were proposed. Nonetheless, the presented methodology can also be applied in other contemporary cell-based PLMNs (DCS, UMTS, LTE, etc). Models were implemented using field RSS measurements gathered from a GSM network optimised for customer services. The first model is implemented using the SVR algorithm. For the second model, the novel space-partitioning principle is introduced so that the user is first localised in a smaller sub-area using the SVC algorithm, after which the SVR algorithm is applied for estimating exact spatial coordinates. Both model types have demonstrated good accuracy in terms of median and 67% DE, when tested with field measurements. Moreover, the use of the space-partitioning principle and the reduction of the area size, to which the SVR algorithm applies, have provided an improvement compared to the SVR model. In the case of the SVC&SVR4×4 model, median DE was reduced to 4·3 m, while 67% DE was reduced to 31·6 m. The proposed positioning models have outperformed the SVR-based positioning solution with the SoE kernel function and achieved a smaller median and 67% DE, compared to kNN, ANN and EKF trained ANN models, when tested using the same field measurements. The proposed models showed somewhat poorer performances in terms of 95% DE as a result of the specific fingerprints in the database used (spatially distant locations with similar MIs) and additionally, in the case when the space-partitioning principle is used, as the result of incorrect sub-area selection. However, the problem of large positioning errors can be further mitigated using an overlaid tracking algorithm.
Due to the SVM property of sparseness, the proposed positioning models have high on-line execution speed and provide latency of less than a second. Hence, they can be considered as a good solution for providing location information to a broad range of LBS.
The achieved positioning accuracy and low latency indicate that the proposed positioning technique can be considered as a good alternative to satellite-based positioning in environments where satellite signals are obstructed. However, tests in more environments, such as urban and highly rural areas, will be necessary in order to further verify our localisation approach.