Introduction
Nellore beef cattle (Bos indicus) have large representation and impact among the Brazilian beef cattle breeds, being well adapted and resistant to tropical regions. This breed, therefore, deserves attention in breeding programs, with special focus related to the improvement of its production and meat quality. Meat tenderness is related to consumer satisfaction and is very important in cattle breeding, affecting the carcass paid price by the industry (Koohmaraie and Geesink, Reference Koohmaraie and Geesink2006; Derington et al., Reference Derington, Brooks, Garmyn, Thompson, Wester and Miller2011). Therefore, the aim of this study was to identify chromosomal regions associated with meat tenderness assessed using a genome-wide association method that allows the use of both pedigree and genomic information.
Material and methods
Phenotypic data
The slaughtered animals were males, finished in feedlots, at, on average, 765.8 days of age with a coefficient of variation 10.8%. The meat samples were collected at a commercial slaughterhouse, following all recommended protocols for commercial slaughter and accepted under the Brazilian legislation law. For the analysis of shear force by Warner–Bratzler, one steak ~2.5 cm of thickness of the longissimus thoracis was collected from between the 12th and 13th rib toward the tail from 886 animals. The steaks were individually identified and vacuum packed (Selovac M160 Selovac, São Paulo, SP, Brazil) in highly flexible film Polyfilm® and kept for 7 days in a cold chamber at 0°C and 2°C and subsequently analyzed. The steaks were weighed and cooked in a eletric oven, model TC 06 (Tedesco, Caixas do Sul, RS, Brazil), at 170°C until the temperature until the center of the sample reached 71°C. The samples were then cooled at room temperature, after which, eight cores, 1.27-cm diameter, were removed per steak, parallel to the fiber grain (American Meat Science Association (AMSA), 1995). Peak shear force was determined on each core perpendicular to the fiber grain using Warner–Bratzler shear force equipment (G-R Manufacturing Co., Manhattan, KS, USA) equipped with a Warner–Bratzler blade with a 25-kg capacity and a shearing speed of 20 cm/min. Full peak shear force was recorded and maximum shear force was calculated as the average of the eight cores.
Animal genotyping
A total of 909 Nellore breed cattle were genotyped; 502 bulls with the Illumina GeneSeek single nucleotide polymorphism (SNP) Beadchips Bovine GGP-HDi (74 K SNP) and 407 with Illumina BovineHD ® (777 K) (Illumina, Woodlands, Singapore), according to the manufacturer’s protocol. The animals genotyped with the 74 K SNP chip were imputed using FImpute software to the Illumina BovineHD ® (777 K) panel. For imputation, SNPs with a P-value in the Hardy–Weinberg equilibrium z-test⩽10−5 and SNPs with a minor allele frequency (MAF) <0.0001 were not considered. The accuracy of imputation was determined by cross-validation for each animal in a parallel investigation (method sent for scientific publication – personal communication: Ricardo Vieira Ventura), and the concordance rate between the imputed and the real genotype was higher than 97.51%. For Genome-Wide Association Study, the SNP quality control excluding SNPs of unknown genomic position and those on the sexual chromosomes; monomorphic SNPs and SNPs with MAF<0.05; markers that presented Call rate <90%; markers with heterozygous genotype excess. After quality control, 909 samples and 463 995 SNPs remained for association analysis.
Association analysis
Genome-wide association study were performed using a pedigree composed of 6276 animals. Single-step analyses were realized by Blupf90 program family considering windows of 10 SNPs to estimate their effects. Contemporary groups (CGs) were defined by animals born on the same herd and year, from the same management group as yearling, and the same set of slaughter. Contemporary groups that contained less than three observations and observations that deviated ±3 SD from the mean of that group were eliminated. The model used for the variance component estimation included a random additive direct genetic effect, a fixed effect for CGs, and the animal’s slaughter age as a covariable (linear and quadratic effect). The variances components and genetic parameters were estimated using the REMLF90 program also of BlupF90 family (Misztal et al., Reference Misztal, Tsuruta, Strabel, Auvray, Druet and Lee2002; Aguilar et al., Reference Aguilar, Misztal, Legarra and Tsuruta2011).
Gene prospecting
Gene within regions of interest were determined using BioMart (Kinsella et al., Reference Kinsella, Kähäri, Haider, Zamora, Proctor, Spudich, Almeida-King, Staines, Derwent, Kerhornou, Kersey and Flicek2011) from Ensembl Genome Browser tool (www.ensembl.org). It was possible to make the identification of gene association analysis for meat tenderness, but not in all associated regions.
Results and discussion
The average value with standard error of the phenotypic data for shear force was 7.44±0.052 kg, with minimum 1.82 kg, maximum of 13.90 kg, coefficient of variation 20.79%. The residual and additive genetic variance for shear force were 2.05 kg2 and 0.31 kg2, respectively, with heritability coefficient of 0.13. Our results were similar to those observed by Tizioto et al. (Reference Tizioto, Decker, Taylor, Schnabel, Mudadu, Silva, Mourão, Coutinho, Tholon, Sonstegard, Rosa, Alencar, Tullio, Medeiros, Nassu, Feijó, Silva, Torres, Siqueira, Higa and Regitano2013) that obtained heritability coefficient of 0.19, using a population of 425 Nellore cattle. McClure et al. (Reference McClure, Ramey, Rolf, McKay, Decker, Chapple, Kim, Taxis, Weaber, Schnabel and Taylor2012) evaluated five different taurine breeds and observed heritabilities values between 0.08 and 0.52.
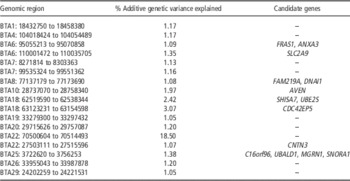
A total of 18 genomic regions were associated with the trait, explaining over 1% of its genetic additive variance. These regions were distributed across 14 different chromosomes, harboring a total of 14 genes (Table 1). Among these associated genomic regions, it was observed that three of them have already been described to be within quantitative trait loci (QTL) as documented in the CattleQTLbd database. The QTL for shear force are located on chromosome 6 between 20.7 and 104.2 Mb, chromosome 7 between 73.2 and 83.6 Mb, and chromosome in 26 between 12.6 and 43.3 Mb (McClure et al., Reference McClure, Ramey, Rolf, McKay, Decker, Chapple, Kim, Taxis, Weaber, Schnabel and Taylor2012). Only in the QTL region of chromosome 6 was it possible to identify the ANXA3 gene in the prospecting with BioMart (Kinsella et al., Reference Kinsella, Kähäri, Haider, Zamora, Proctor, Spudich, Almeida-King, Staines, Derwent, Kerhornou, Kersey and Flicek2011).
Percentage of genetic additive variance explained and candidate genes presented in the genomic regions associated with meat tenderness

The identified genes on these regions are described in the Ensembl Genome Browser.
For meat tenderness single step Genome Wide Association (ssGWA) analysis, although several genomic regions along the genome were related to the trait, it is important to note that the region on chromosome 22 explained most of the genetic additive variance, which suggests that could be an important region. However, we did not identify any gene information associated with this segment.
Conclusion
The ssGWA method using high density SNP panel identified genomic regions and genes related to meat tenderness in Nellore beef cattle. From these genes, we can conclude that several mechanisms are likely involved in determining meat tenderness. The identified genes and their pathways will be investigated to evaluate their importance for meat quality traits.
Acknowledgment
The authors thank the University of São Paulo by the structural and physical support for the study, FAPESP (Projects 2013/13021-6 and 2014/07566-2) and CNPq (Project 150224/2017-6).