In 1989, the W. T. Grant Foundation issued an influential report, The Forgotten Half: Non-College Bound Youth in America, an analysis of the life situations of young people who do not attend college. After 27 years, the forgotten half remains largely forgotten in research, given the scarcity of programmatic, longitudinal studies of young people who are not college bound. The majority of rural African American youths and emerging adults in the southern United States are part of this forgotten half. A minority of African American secondary school graduates in the Southern counties in which we conducted the research program described in this paper complete postsecondary education programs (Boatright, Reference Boatright2005). It was against this backdrop that the first author (G.H.B.) began systematic longitudinal analyses designed to identify the risk and protective processes in the lives of rural African American youths that forecast psychological well-being and the development of academic and self-regulatory competence. This initial work was performed under the auspices of the Program for the Study of Competence in Children and Families at the University of Georgia, which was founded in 1987. Brody (Brody, Kogan, & Grange, Reference Brody, Kogan, Grange, King and Maholmes2012; Brody et al., Reference Brody, Murry, Gerrard, Gibbons, Molgaard and McNair2004) expanded this administrative structure to form the Center for Family Research (CFR) in 1994. This expansion reflected scientific growth in this research program, along with an elaboration of its mission to use longitudinal, epidemiological data to inform the development and testing of prevention programs for rural African American preadolescents, adolescents, and young adults.
The research conducted within the Program for the Study of Competence of Children and Families and at CFR demonstrated that, despite persistent exposure to a plethora of environmental stressors and challenges, many youths demonstrated academic competence, planful self-regulation, and positive psychological adjustment. Naturally occurring influences within family and community networks were identified that buffered youths from the consequences of chronic economic hardship and contextual stressors (Brody, Kogan, et al., Reference Brody, Kogan, Grange, King and Maholmes2012). In recent years, CFR expanded its research agenda to understand better the origins of the health disparities that currently plague rural African Americans.
The paper is organized into four sections. We begin by describing the rural Southern “Black Belt” and the ways in which the economic hardships that many who live there experience can sponsor vulnerabilities to the chronic diseases of aging (CDAs) such as coronary heart disease, diabetes, stroke, hypertension, chronic lung diseases, and some cancers. Second, we describe our recent “proof of principle” studies that link exposure to socioeconomic status (SES) and race-related stressors to biomarkers that act as indicators of the biological weathering of young, rural African Americans’ bodies. Third, we review evidence that, for many African American youths, resilience is a “skin deep” phenomenon wherein outward indicators of success can mask emerging health problems. Fourth, we conclude on an optimistic note by showing that psychosocial interventions designed to enhance parenting and strengthen family relationships can deter contextual risk mechanisms from affecting an array of health-relevant biomarkers such as inflammatory profiles, epigenetic aging, and telomere length (TL).
Socioeconomic Challenges for African Americans Growing Up in the Rural South
Poverty and economic distress are pervasive for many African American families in rural areas, particularly those who reside in a crescent-shaped area of 623 counties in 11 southern states; 34% of the nation's poor reside here (Wimberly & Morris, Reference Wimberly and Morris1997). This region has been called the Black Belt, a term first used to describe the color of the rich Southern soil on which enslaved Africans worked. Later, the term came to refer to the large African American population in this area. The rural communities in the Black Belt commonly face chronic poverty, population decline, inadequate education programs, poor health care, substandard housing, and high levels of unemployment. These problems disproportionately affect African American residents (Probst et al., Reference Probst, Samuels, Jespersen, Willert, Swann and McDuffie2002).
Recent estimates indicate that more than half of the African American children in the rural South live in economically distressed households (Mattingly & Bean, Reference Mattingly and Bean2010). Most of their primary caregivers are employed; their poverty reflects the dominance of low-wage, resource-intensive industries in these areas. For families with little discretionary income, rural residence can be more challenging than is life in urban areas due to a restricted range of employment opportunities, a lack of public transportation systems, the absence of recreational facilities for youths, and difficulties in obtaining care for physical and mental health problems (Brody, Neubaum, Boyd, & Dufour, Reference Brody, Neubaum, Boyd, Dufour, Robertson, Sloboda, Boyd, Beatty and Kozel1997). Many African American families in the rural South thus live under conditions of severe, ongoing economic stress that have the potential to take a toll on health and well-being among children and youths (Miller, Chen, & Parker, Reference Miller, Chen and Parker2011; Shonkoff, Boyce, & McEwen, Reference Shonkoff, Boyce and McEwen2009).
Low SES and health across the life span
Because many rural African American children live in low SES circumstances, they are at elevated risk for health problems across their life spans (Braveman, Cubbin, Egerter, Williams, & Pamuk, Reference Braveman, Cubbin, Egerter, Williams and Pamuk2010; Shonkoff et al., Reference Shonkoff, Boyce and McEwen2009). These disparities likely begin at the earliest stages of life. Children in low-income families experience disproportionately high rates of growth restriction, preterm births, and neonatal mortality (Blumenshine, Egerter, Barclay, Cubbin, & Braveman, Reference Blumenshine, Egerter, Barclay, Cubbin and Braveman2010). As children from low-SES environments mature, they continue to experience health problems at higher rates than those of their more advantaged peers. Low-SES youths show a heightened prevalence of obesity, insulin resistance, and asthma (Chen, Matthews, & Boyce, Reference Chen, Matthews and Boyce2002; Goodman, Daniels, & Dolan, Reference Goodman, Daniels and Dolan2007; Singh, Siahpush, & Kogan, Reference Singh, Siahpush and Kogan2010; Wright & Subramanian, Reference Wright and Subramanian2007). When they reach later life stages, those raised in low-SES families show excessive morbidity and mortality from CDAs (Galobardes, Lynch, & Smith, Reference Galobardes, Lynch and Smith2004, Reference Galobardes, Lynch and Smith2008; Galobardes, Smith, & Lynch, Reference Galobardes, Smith and Lynch2006). These associations are typically independent of SES in adulthood, suggesting that childhood disadvantage can leave a “biological residue” with long-term health consequences.
These data raised challenging questions for the CFR health initiative. How does living in conditions of economic hardship and its associated stressors get “under the skin” to influence the anatomy and physiology of rural African American children and youths in ways that contribute to health disparities? Through what mechanisms do these experiences confer vulnerability to CDAs? To begin to address these questions, we conducted prospective analyses designed to determine whether economic hardship and exposure to racial discrimination presage indicators of cardiometabolic risk and epigenetic aging. These studies are described in the following section.
Psychosocial Processes Presage Health Vulnerabilities: Five Proof of Principal Studies
Many scientists believe that the well-documented health disparities between African Americans and members of other ethnic groups do not originate in adulthood but result from changes in biological processes at earlier stages of development (Geronimus, Hicken, Keene, & Bound, Reference Geronimus, Hicken, Keene and Bound2006). Nevertheless, when we began our research program, little if any longitudinal, prospective research had been conducted on the contributions of contextual factors to the development of health vulnerabilities among African American youths. To meet the need for such studies, we added health-relevant biomarkers to our research, embedding them into existing longitudinal cohorts of rural African American youths. We hoped this would allow us to determine whether contextual risks presage the development of health vulnerabilities among rural African American youths and young adults. We also wanted to learn whether supportive family environments could serve as countervailing buffers to deter the expression of contextual challenges in the biomarkers that we added to our study protocols.
Study 1: Can early signs of biological weathering be detected in African American adolescents?
The first study was designed to address two questions. First, do a significant percentage of African American youths show signs of biological weathering? Second, could we detect, during participants’ adolescence, a counterintuitive pattern in the health disparities literature in which African American middle-aged adults evince elevated levels of problems with physical health but unremarkable levels of psychological maladjustment (Kessler et al., Reference Kessler, Berglund, Demler, Jin, Merikangas and Walters2005; Lantz et al., Reference Lantz, Lynch, House, Lepkowski, Mero and Musick2001; Mensah, Mokdad, Ford, Greenlund, & Croft, Reference Mensah, Mokdad, Ford, Greenlund and Croft2005)? Answering these questions required us to see whether we could identify a substantial number of African American youths who were exposed to high levels of economic hardship and cumulative SES risks, evinced relatively high levels of biological weathering, and experienced few problems with psychological adjustment.
We tested the study questions with a representative sample of 443 African American youths living in the rural South. Parents assessed cumulative SES risk at ages 11 through 13 years; psychological adjustment (drug use, delinquent behavior, depression, and externalizing behavior) was assessed by youths and their mothers across ages 14 to 18 years; and allostatic load (AL) was assessed at age 20 years (Brody, Yu, Chen, Kogan, et al., Reference Brody, Yu, Chen, Kogan, Evans and Beach2013). AL is thought to reflect physiological wear and tear that results from the body's efforts to maintain homeostasis in response to stress (McEwen, Reference McEwen1998). Over time, this strain can manifest in the dysregulation of multiple physiological structures, including the cardiovascular, metabolic, autonomic, endocrine, and inflammatory systems (Seeman, Epel, Gruenewald, Karlamangla, & McEwen, Reference Seeman, Epel, Gruenewald, Karlamangla and McEwen2010). AL composites based on these systems’ functioning are thought to indicate physical health risk because they have been shown to predict the onset of cardiovascular disease and all-cause mortality later in life (Karlamangla, Singer, & Seeman, Reference Karlamangla, Singer and Seeman2006; Seeman, McEwen, Rowe, & Singer, Reference Seeman, McEwen, Rowe and Singer2001; Seeman, Singer, Rowe, Horwitz, & McEwen, Reference Seeman, Singer, Rowe, Horwitz and McEwen1997). Our protocol for measuring AL was based on procedures that Evans (Reference Evans2003) developed for field studies involving children and adolescents. This protocol included the measurement of overnight cortisol, epinephrine, and norepinephrine from urine voids; resting diastolic and systolic blood pressure; and body mass index (BMI). AL was calculated by summing the indicators on which each participant scored in the top quartile of risk; possible scores ranged from 0 to 6.
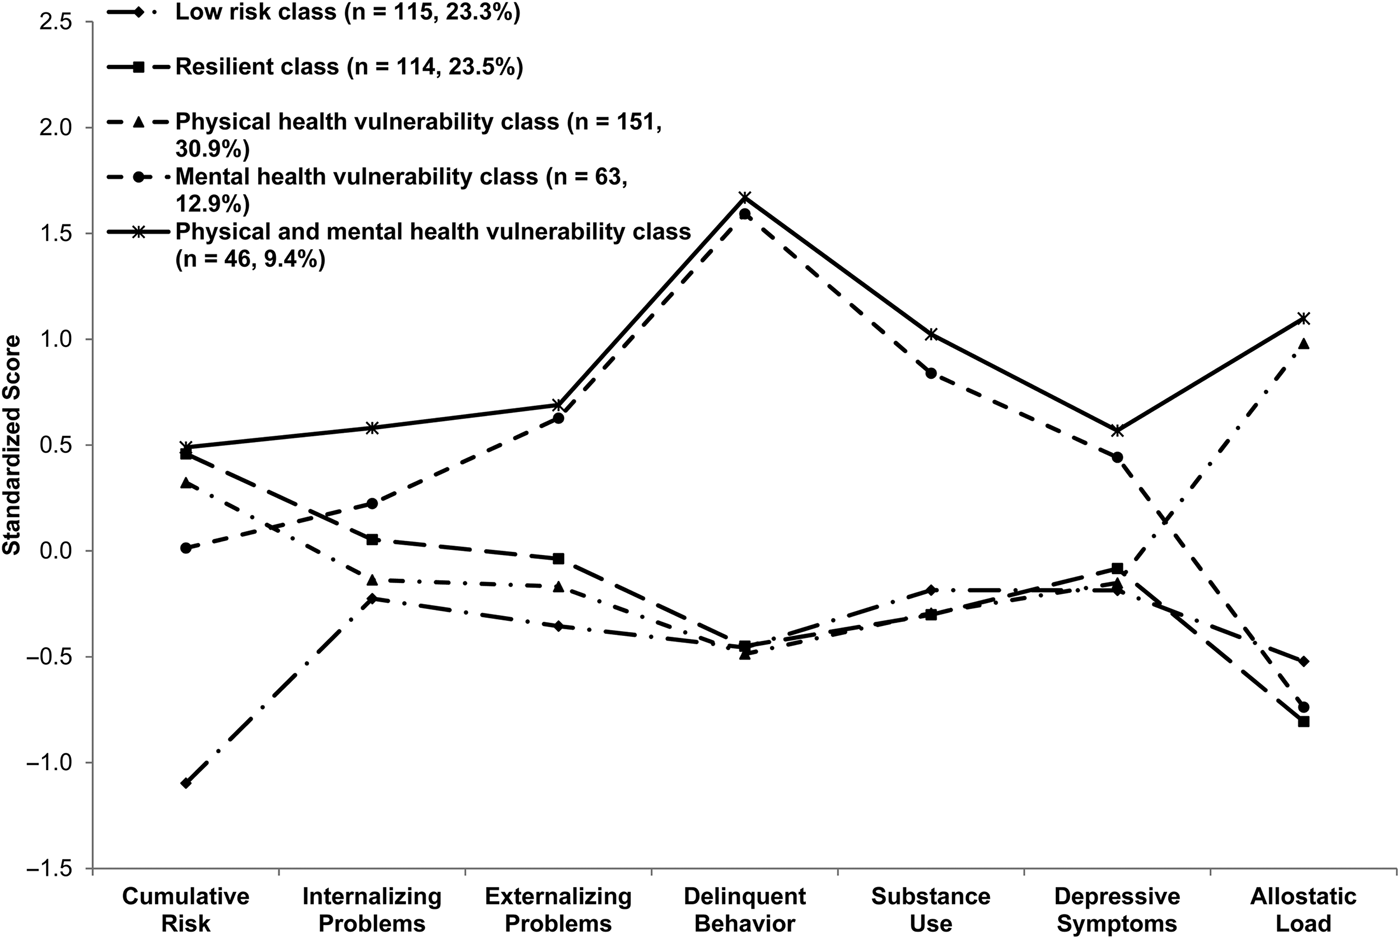
A latent profile analysis identified five profiles that are depicted in Figure 1. The first profile featured high levels of cumulative SES risk, low levels of adjustment problems, and high AL. On the basis of the health disparities literature and theoretical conceptualizations, we classified these youths into a physical health vulnerability profile. This classification included the largest number of youths (n = 151, 30.9%), supporting our hypothesis that a significant percentage of rural African American adolescents would display characteristics described in the adult health disparities literature. Compared with those in the first profile, youths in a second profile experienced equally high exposure to cumulative SES risk and similarly low levels of adjustment problems across adolescence, along with substantially lower (>4 SD) AL. On the basis of their exposure to high cumulative risk coupled with low levels of adjustment problems and low AL, we classified these youths into a resilient profile (n = 115, 23.5%). The third profile, the physical and mental health vulnerability group, was the smallest (n = 46, 9.4%). These youths displayed high levels of both physical and mental health vulnerability, having been exposed to high cumulative SES risk and demonstrating high levels of adjustment problems and high AL. Youths in this profile were exposed to similar levels of cumulative SES risks as were youths in the physical health vulnerability and resilient profiles, yet they evinced much higher levels of adjustment problems across adolescence than did those in either of the other profiles. Their AL was substantially higher than that of youths in the resilient profile and indistinguishable from the high AL characterizing youths in the physical health vulnerability profile. Youths in the fourth profile were exposed to moderate levels of SES risk coupled with high adjustment problems and low AL. These youths were classified into a mental health vulnerability profile (n = 63, 12.9%). The fifth and final profile was characterized by relatively low levels of exposure to cumulative SES risk, low levels of adjustment problems across adolescence, and low AL. These youths were classified into a low-risk profile (n = 114, 23.3%). Youths in the low-risk profile evinced levels of adjustment problems and AL that were indistinguishable from those of youths in the resilient profile. Youths in the physical health vulnerability profile evinced low levels of adjustment problems indistinguishable from those in the low-risk profile but substantially higher levels of AL (>2 SD) than did low-risk youths.
Latent profile membership standardized scores for the study sample. Adapted from “Cumulative Socioeconomic Status Risk, Allostatic Load, and Adjustment: A Prospective Latent Profile Analysis With Contextual and Genetic Protective Factors,” by G. H. Brody, T. Yu, Y. Chen, S. M. Kogan, G. W. Evans, S. R. H. Beach, et al., Reference Brody, Yu, Chen, Kogan, Evans and Beach2013, Developmental Psychology, 49, p. 921. Copyright 2012 by the American Psychological Association. Adapted with permission.

The results confirmed our conjecture that we could identify empirically two theoretically important focal profiles: a physical health vulnerability profile and a resilient profile. Together, these two profiles accounted for 54.4% of a representative sample of rural African Americans. These findings were consistent with propositions that poor health and health disparities during adulthood are tied to experiences earlier in life, particularly for persons growing up with the stressors associated with low SES (Shonkoff et al., Reference Shonkoff, Boyce and McEwen2009). The findings were also consistent with resilience theory (Luthar, Reference Luthar, Cicchetti and Cohen2006), demonstrating that not all rural African American youths exposed to cumulative SES risks will develop physiological dysregulation.
Study 2: The Great Recession and health risks in African American adolescents: A natural experiment
One reason that statistical associations between a risk factor and an outcome cannot be assumed to reflect environmentally mediated causation is that it is not uncommon for a risk factor to be associated in some way with an individual's behavior. This rival hypothesis can be eliminated when circumstances beyond the individual's control create the environmental risk factor. One such circumstance was the Great Recession. In December 2007, the United States officially entered a recession. Starting in the autumn of 2008 and continuing into 2009, the recession intensified, with a dramatic collapse of financial markets and an equally dramatic increase in mass layoffs (Council of Economic Advisors, 2010). The annual unemployment rate increased from 5% in December 2007 to 10% in October 2010. Although the recession was officially over in June 2009, its effects were long lasting and are still being felt in households across the nation.
In the second proof of principle study, we took advantage of the Great Recession as an externally occurring macroeconomic event that occurred while we were conducting an ongoing longitudinal study of African American youths (Chen, Miller, Yu, & Brody, Reference Chen, Miller, Yu and Brody2016). Families’ economic circumstances were assessed repeatedly, allowing us to identify prospectively the families who experienced economic decline during the recession and the families who did not. We investigated associations of macroeconomic conditions with cellular epigenetic aging (described later), AL, and self-reported health. A sample of 330 African American adolescents in Georgia was followed from prerecession (2007, M age = 16.6 years) to postrecession (2010, M age = 19.3 years). Three groups were formed to represent family economic trajectories across the period of the Great Recession (stable low economic hardship, downward mobility, and stable high economic hardship). At age 19, measures of cellular epigenetic aging, AL (to which a measure of C-reactive protein, an indicator of systemic inflammation, was added), and youths’ self-reports of health were obtained.
To measure cellular aging, we used a recently developed biomarker derived from the DNA methylation pattern of immune system cells. Modifications in DNA that do not involve changes in the DNA nucleotide sequence are termed epigenetic processes. Methylation is an epigenetic process whereby methyl groups bind to the cytosine residues that comprise DNA; in so doing, the methyl groups alter the cells’ ability to activate particular genes. On the basis of the notion that methylation partly reflects the amount of turmoil to which a cell has been exposed, researchers have used methylation to assess cellular aging. This marker has been validated in cells from diverse tissues and reflects the disparity between an individual's biological and chronological ages (Hannum et al., Reference Hannum, Guinney, Zhao, Zhang, Hughes and Sadda2013). The concept of cellular age is closely related to, but not isomorphic with, chronological age. Research shows that some individuals show more rapid cellular aging than would be expected on the basis of their chronological ages, whereas others show the reverse. Faster epigenetic aging has been documented in tumor-derived cells from more than 20 cancers, as well as in liver biopsies from obese patients (Horvath et al., Reference Horvath, Erhart, Brosch, Ammerpohl, von Schönfels and Ahrens2014). Epigenetic aging has also been studied in peripheral blood mononuclear cells. Children with more “aged” cells have heightened blood pressure (Simpkin et al., Reference Simpkin, Gemani, Suderman, Gaunt, Lyttleton and McArdle2016), and adults with more aged cells experience higher rates of all-cause mortality (Marioni et al., Reference Marioni, Shah, McRae, Chen, Colicino and Harris2015).
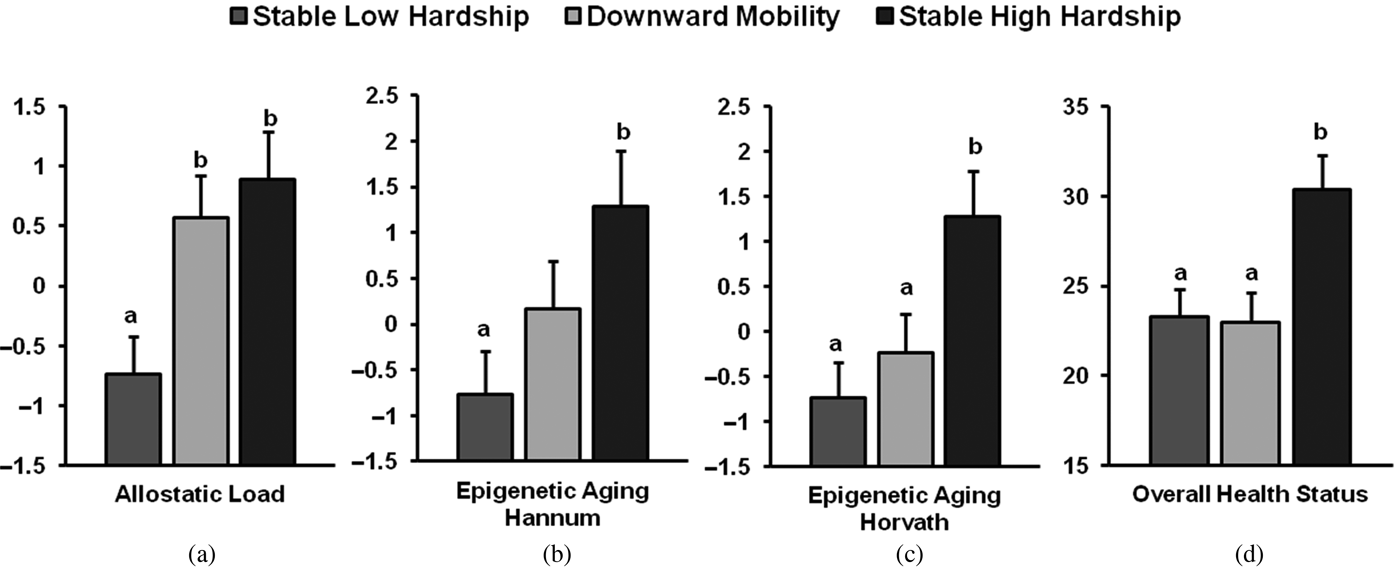
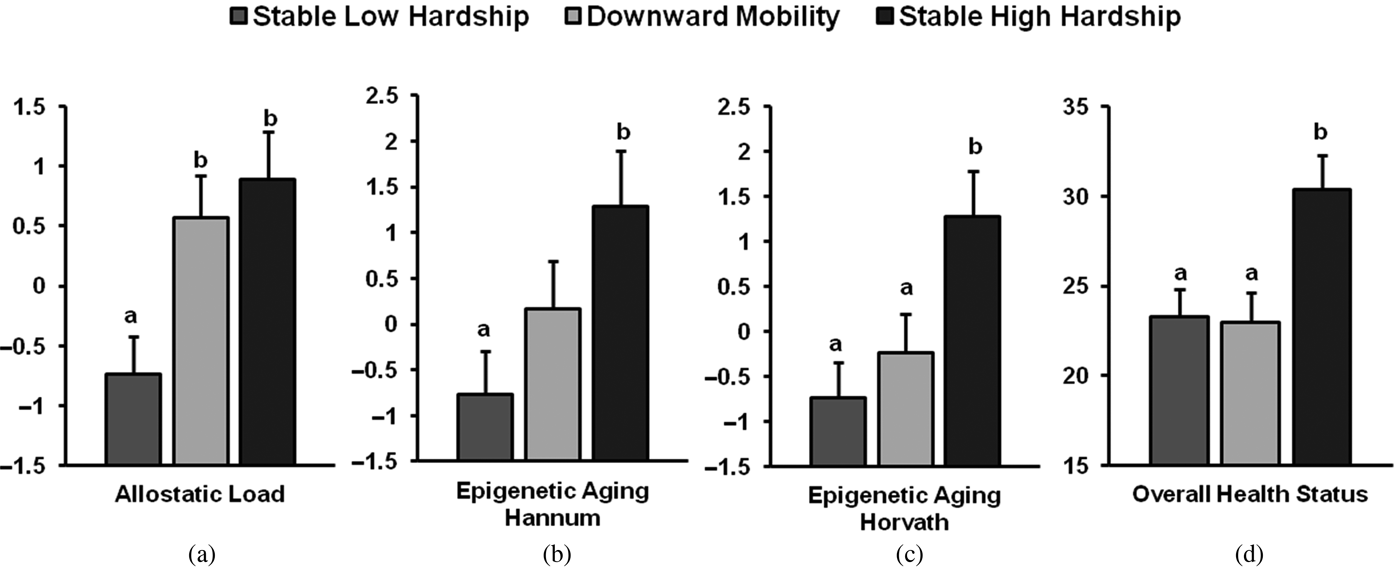
The results for AL, epigenetic aging, and self-reported health are presented in Figure 2. Two different metrics of epigenetic aging, one derived by Horvath et al. (Reference Horvath, Erhart, Brosch, Ammerpohl, von Schönfels and Ahrens2014) and the other by Hannum et al. (Reference Hannum, Guinney, Zhao, Zhang, Hughes and Sadda2013), are presented in Figure 2. Both metrics index methylation-based profiles of aging; the number of cytosine nucleotide–phosphate–guanine nucleotide sites on the genome that are included in their matrices differ (353 sites for Horvath and 71 sites for Hannum). As Figure 2 indicates, the more time adolescents spent in economic hardship (two time points for the high economic hardship group and one time point for the downward mobility group), the higher their epigenetic aging and AL, and the worse their self-reported health. Specific group comparisons revealed that adolescents in the downward mobility group had higher AL then did those in the stable low hardship group. This suggests that the downward mobility group resembled the high economic hardship group on AL but the low economic hardship group on self-reported health and epigenetic aging. Thus, the experience of economic decline may have its most immediate effects on AL. This was the first study of which we were aware to focus on biological mechanisms, including cellular epigenetic aging and AL, among African American adolescents in the context of changing macroeconomic conditions. This allowed us to demonstrate that societal-level economic conditions may be related to immune and physiological mechanisms, with implications for later health.
Differences in adolescent outcomes by economic trajectory across the Great Recession. Means of (a) allostatic load, (b) epigenetic aging using the Hannum method, (c) epigenetic aging using the Horvath method, and (d) overall health status (higher numbers indicate poorer health) by family economic hardship groups; n = 131 for stable low hardship group, 105 for downward mobility group, and 82 for stable high hardship group. Significant differences are indicated by difference in letters a and b (p < .05). Error bars = +1 SE. Adapted from “The Great Recession and Health Risks in African American Youth,” by E. Chen, G. E. Miller, T. Yu, and G. H. Brody, Reference Chen, Miller, Yu and Brody2016, Brain, Behavior, and Immunity. Copyright 2015 by Elsevier Inc. Adapted with permission.
Study 3: Does living in a neighborhood in which poverty levels increase across time forecast AL?
Our third proof of principle study focused on forecasting AL across time from the changing characteristics of neighborhoods in which rural African American youths lived. A hypothesis proposed in the pediatric health disparities literature concerns the possibility that living in a high-poverty neighborhood during childhood, adolescence, or both will engender heightened levels of AL in youths, with downstream health consequences (Shonkoff et al., Reference Shonkoff, Boyce and McEwen2009). In addition, little was known when we did this research about the health of youths, African American or not, who experienced changes within their neighborhoods. Neighborhood socioeconomic conditions shift over time as a consequence of broader macroeconomic upheavals. Even without moving out of a neighborhood, many African American children's residential areas can become progressively lower in SES over time (Braveman & Egerter, Reference Braveman and Egerter2008). A primary aim of this proof of principle study was to determine the effects that changes in neighborhood poverty levels, net of continuities and changes in family financial circumstances, had on rural African American youths’ AL in a cohort followed from ages 11 to 19 years (Brody, Lei, Chen, & Miller, Reference Brody, Lei, Chen and Miller2014).
This study also addressed another important question: why can some youths and adults maintain physically healthy profiles despite living in difficult circumstances; that is, what makes them resilient (Luthar, Reference Luthar, Cicchetti and Cohen2006)? Research involving children and adolescents suggests that receipt of emotional support from parents (Chen & Miller, Reference Chen and Miller2012; Chen, Miller, Kobor, & Cole, Reference Chen, Miller, Kobor and Cole2011; Evans, Kim, Ting, Tesher, & Shannis, Reference Evans, Kim, Ting, Tesher and Shannis2007) and peers (Adams, Santo, & Bukowski, Reference Adams, Santo and Bukowski2012; Brody, Yu, Chen, Kogan, et al., Reference Brody, Yu, Chen, Kogan, Evans and Beach2013) can offset some of the neuroendocrine, metabolic, inflammatory, and cardiovascular risks that often develop after exposure to adversity (Miller, Chen, et al., Reference Chen, Miller, Kobor and Cole2011; Shonkoff et al., Reference Shonkoff, Boyce and McEwen2009). On the basis of these findings, we explored the possibility that emotional support would have a protective effect by reducing the impact of increases in neighborhood poverty on AL during adolescence.
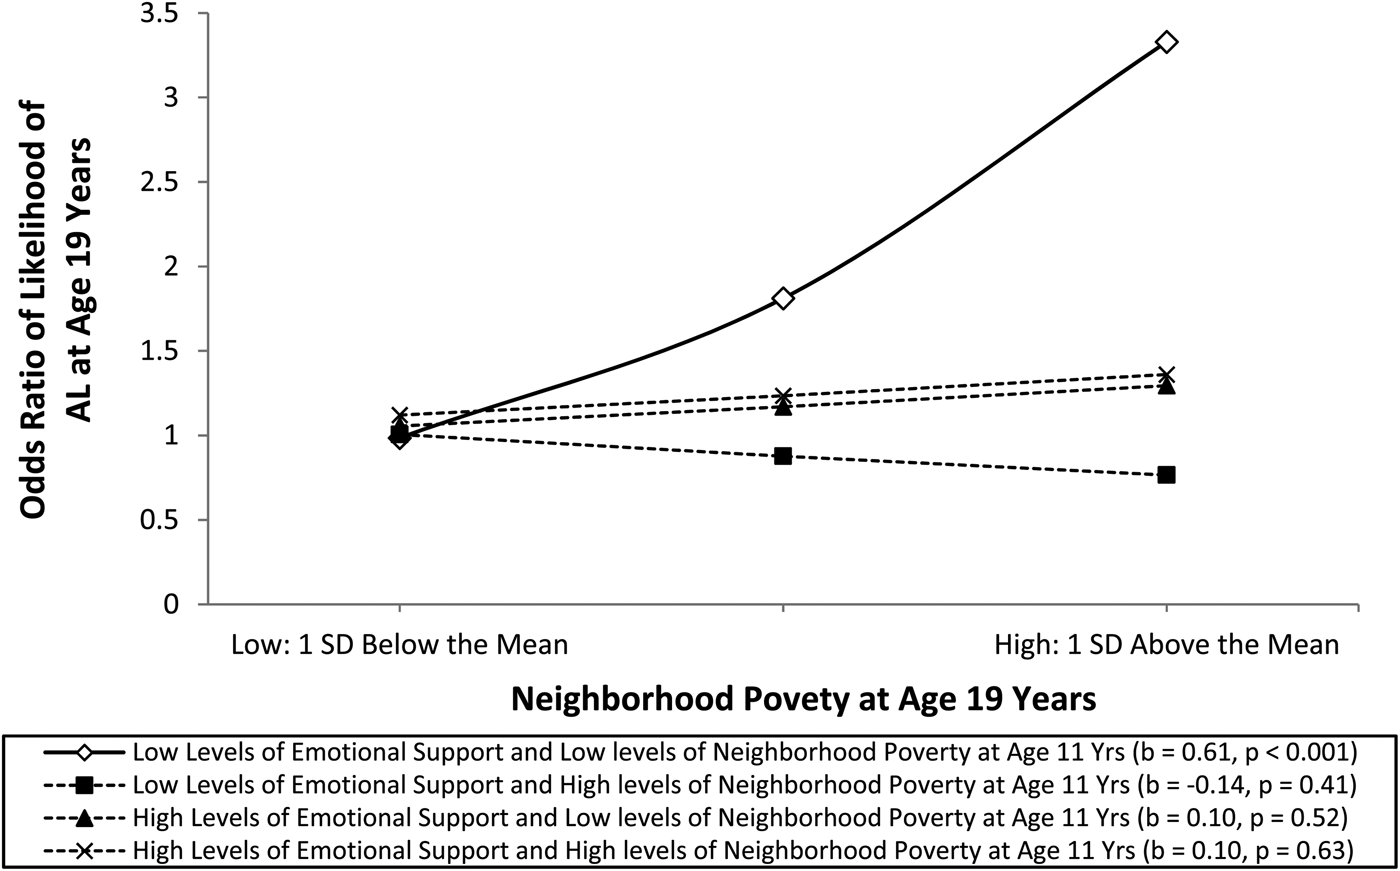
To address these questions, data on neighborhood concentrations of poverty were obtained from the United States Census Bureau for 420 African American youths living in rural Georgia when they were 11 and 19 years of age. AL was measured at age 19 using our protocol for adolescents (Brody, Yu, Chen, Kogan, et al., Reference Brody, Yu, Chen, Kogan, Evans and Beach2013; Evans, Reference Evans2003). When youths were 18, caregivers reported parental emotional support and youths assessed peer and mentor emotional support. Covariates included family poverty status at ages 11 and 19, their interaction, family financial stress, parental employment status, and youths’ unhealthful behaviors.
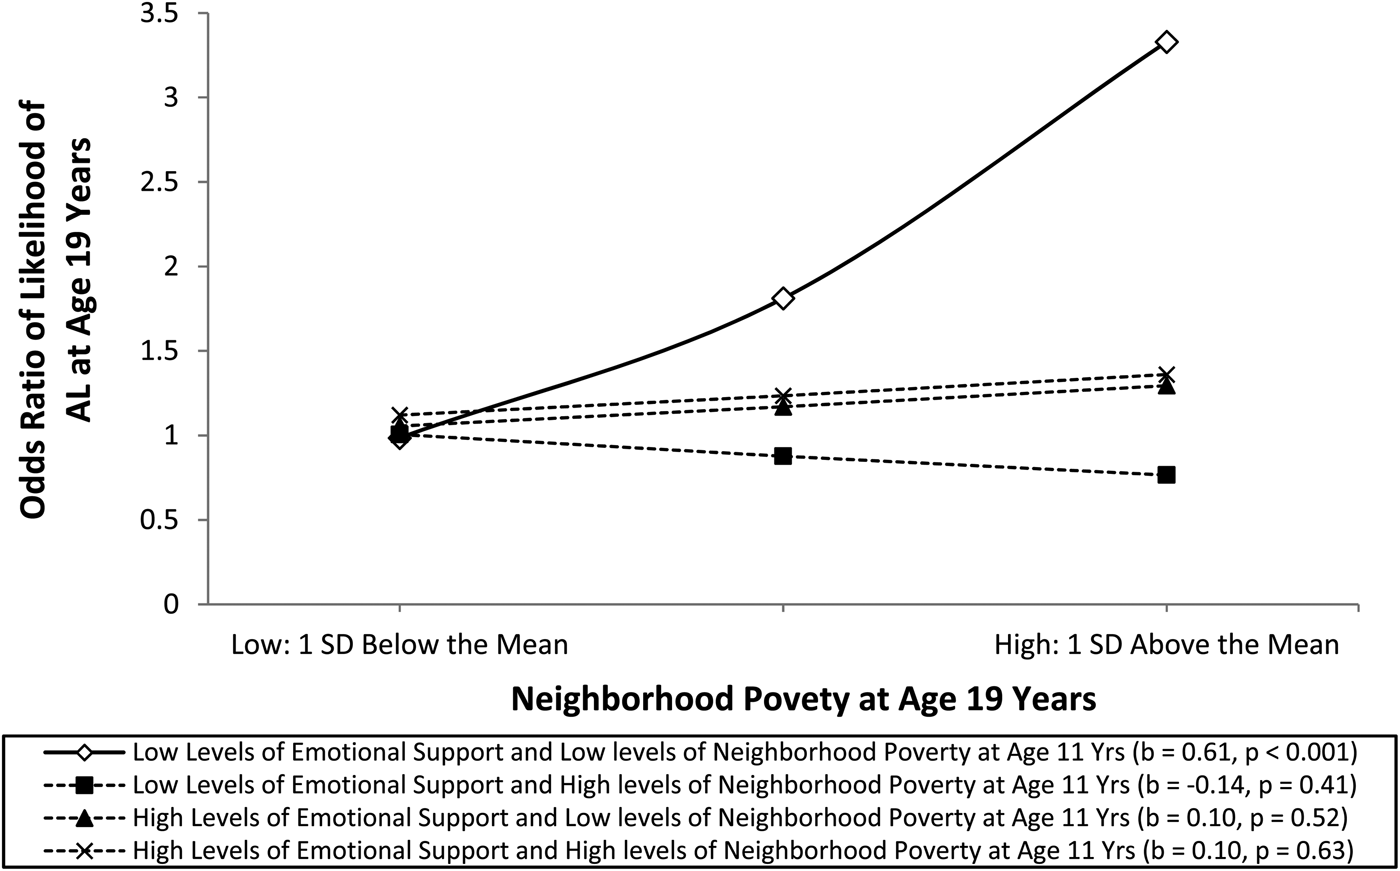
The results revealed that youths who lived in neighborhoods in which poverty levels increased from ages 11 to 19 evinced the highest levels of AL, even after accounting for individual-level covariates. The results also demonstrated the protective effects of emotional support from others in the adolescents’ family and peer networks on ameliorating neighborhood effects on AL. These results are depicted in Figure 3. Taken together, this study added to our proof of principle arsenal by illustrating how changes in neighborhood contexts contribute to biological adaptations that may render some youths more vulnerable to CDAs. AL was higher when the neighborhoods in which youths lived grew progressively poorer over time. These findings remained robust after controlling for change over time in family poverty and economic hardship. This association did not emerge, however, when youths received high levels of emotional support, underscoring the importance of relational support to youths’ stress reactivity and health.
The effect of neighborhood poverty at age 19 years on predicted allostatic load by level of neighborhood poverty at age 11 years and emotional support assessed by using a multilevel Poisson regression model. The analysis controlled for family poverty, gender, diet, smoking, binge drinking, perceived stress, unemployment, and financial stress. The lines represent the regression lines for different levels of neighborhood poverty (low = 1 SD below the mean, high = 1 SD above the mean) and emotional support (low = 1 SD below the mean, high = 1 SD above the mean). The numbers in parentheses refer to simple slope for each group. Adapted from “Neighborhood Poverty and Allostatic Load in African American Youth,” by G. H. Brody, M. K. Lei, E. Chen, and G. E. Miller, Reference Brody, Lei, Chen and Miller2014, Pediatrics, 134, p. e1367. Copyright 2014 by the American Academy of Pediatrics. Adapted with permission.
Studies 4 and 5: The biological weathering effects of racial discrimination and the protective benefits of supportive family environments
The fourth and fifth proof of principle studies were designed to test a hypothesis that had been proposed in the health disparities literature but had not yet been examined empirically: exposure to racial discrimination during childhood and adolescence will have negative effects on the functioning of biological stress regulatory systems and, ultimately, on health later in life (Geronimus et al., Reference Geronimus, Hicken, Keene and Bound2006; Shonkoff et al., Reference Shonkoff, Boyce and McEwen2009). This hypothesis was based on the premise that the health inequities that African Americans experience arise from more than class disadvantage. Racial discrimination presents daily challenges in the lives of many African American youths and their families (Williams & Mohammed, Reference Williams and Mohammed2013). These incidents are demeaning and induce stress, frustration, depression, and anxiety in adults (Pascoe & Smart Richman, Reference Pascoe and Smart Richman2009) and in adolescents (Priest et al., Reference Priest, Paradies, Trenerry, Truong, Karlsen and Kelly2013).
Associations have been found between racial discrimination and health-relevant physiological outcomes. Research conducted primarily with adults has demonstrated that discrimination is associated with a range of health-relevant biomarkers, including neuroendocrine risk markers for poor birth outcomes, elevated glucocorticoids, proinflammatory cytokines, C-reactive protein, and other markers of inflammation (Brondolo et al., Reference Brondolo, Brady, Thompson, Tobin, Cassells and Sweeney2008; Lewis, Cogburn, & Williams, Reference Lewis, Cogburn and Williams2015; Pascoe & Smart Richman, Reference Pascoe and Smart Richman2009). Together, these studies supported our examinations of the biological weathering effects of exposure to racial discrimination during adolescence, a developmental stage in which African American youths become keenly aware of their treatment by others and are particularly cognizant of targeted rejection (Stevenson, Reference Stevenson and Jones2004).
Our approach to racial discrimination effects focused on exposure to it across adolescence. A review of the research literature led us to believe that African American adolescents’ encounters with racial discrimination would best be characterized by qualitatively different subgroups, with many youths encountering low and increasing exposures to racial discrimination and others encountering consistently frequent exposure (Brody, Miller, Yu, Beach, & Chen, Reference Brody, Miller, Yu, Beach and Chen2016). On the basis of the heterogeneity reported in the literature, we hypothesized that adolescents who encountered qualitatively more interpersonal discrimination across time would be at greater risk for biological weathering. This hypothesis was based on the premise that exposure to frequent discrimination across time leads to frequent activations of stress response systems, the hormonal end products of which (cortisol, epinephrine, and norepinephrine) contribute to the weathering process and to poor health later in life (Miller, Chen, et al., Reference Chen, Miller, Kobor and Cole2011).
Despite exposure to high levels of discrimination, many rural African Americans will not experience biological weathering. We expected supportive family environments during adolescence to prevent racial discrimination from getting under the skin. For rural African American youths, supportive family environments promote psychological resilience to cumulative contextual stressors (Brody, Kogan, et al., Reference Brody, Kogan, Grange, King and Maholmes2012). Recent reports also suggest that family support can buffer metabolic, inflammatory, and cardiovascular reactions that children develop after experiencing adversity. In particular, family support buffers the effects of childhood maltreatment on AL (Carroll et al., Reference Carroll, Gruenewald, Taylor, Janicki-Deverts, Matthews and Seeman2013), of low childhood SES on adult genomic proinflammatory signaling profiles (Chen, Miller, et al., Reference Miller, Chen and Parker2011), and on metabolic profiles (Miller, Lachman, et al., Reference Miller, Lachman, Chen, Gruenewald, Karlamangla and Seeman2011). These findings led us to predict that supportive family environments would reduce the impact of exposure to high levels of racial discrimination on biological weathering.
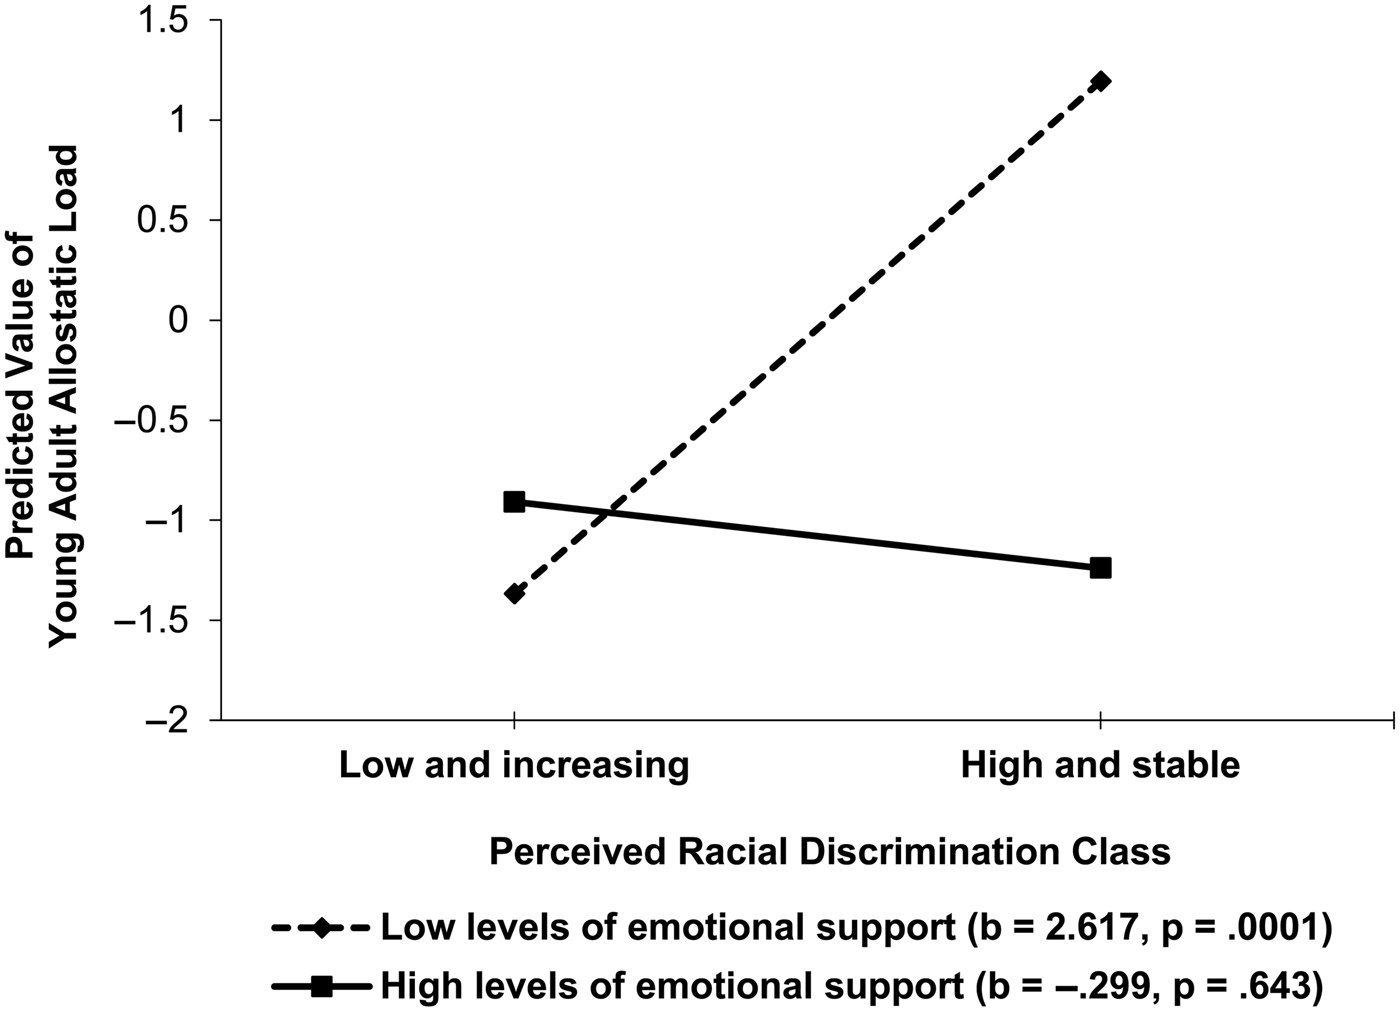
We conducted two studies to test the hypothesis that supportive family environments would reduce the likelihood of biological weathering among youths who frequently encounter discrimination. In the first study, conducted with a sample of 331 African Americans, we obtained assessments of racial discrimination from ages 16 to 18 years. When youths were 18 years of age, caregivers reported parental emotional support (Brody, Lei, Chae, et al., Reference Brody, Lei, Chae, Yu, Kogan and Beach2014). AL and potential confounder variables were assessed when youths were 20 years of age. Latent growth mixture models identified two classes of exposure to discrimination across adolescence: high and stable, and low and increasing. A main effect of exposure to racial discrimination and an interaction between exposure to discrimination and receipt of family support emerged even with confounder variables controlled. As expected, the prospective racial discrimination to AL link was not significant for young adults who received high levels of family emotional support. These findings are depicted in Figure 4.
The effect of perceived racial discrimination on young adults’ allostatic load by level of emotional support. The lines represent the regression lines for different levels of emotional support (low = 1 SD below the mean, high = 1 SD above the mean). The numbers in parentheses refer to simple slopes. Adapted from “Perceived Discrimination Among African American Adolescents and Allostatic Load: A Longitudinal Analysis With Buffering Effects,” by G. H. Brody, M. K. Lei, D. H. Chae, T. Yu, S. M. Kogan, and S. R. H. Beach, Reference Brody, Lei, Chae, Yu, Kogan and Beach2014, Child Development, 85, p. 997. Copyright 2014 by the authors. Adapted with permission.

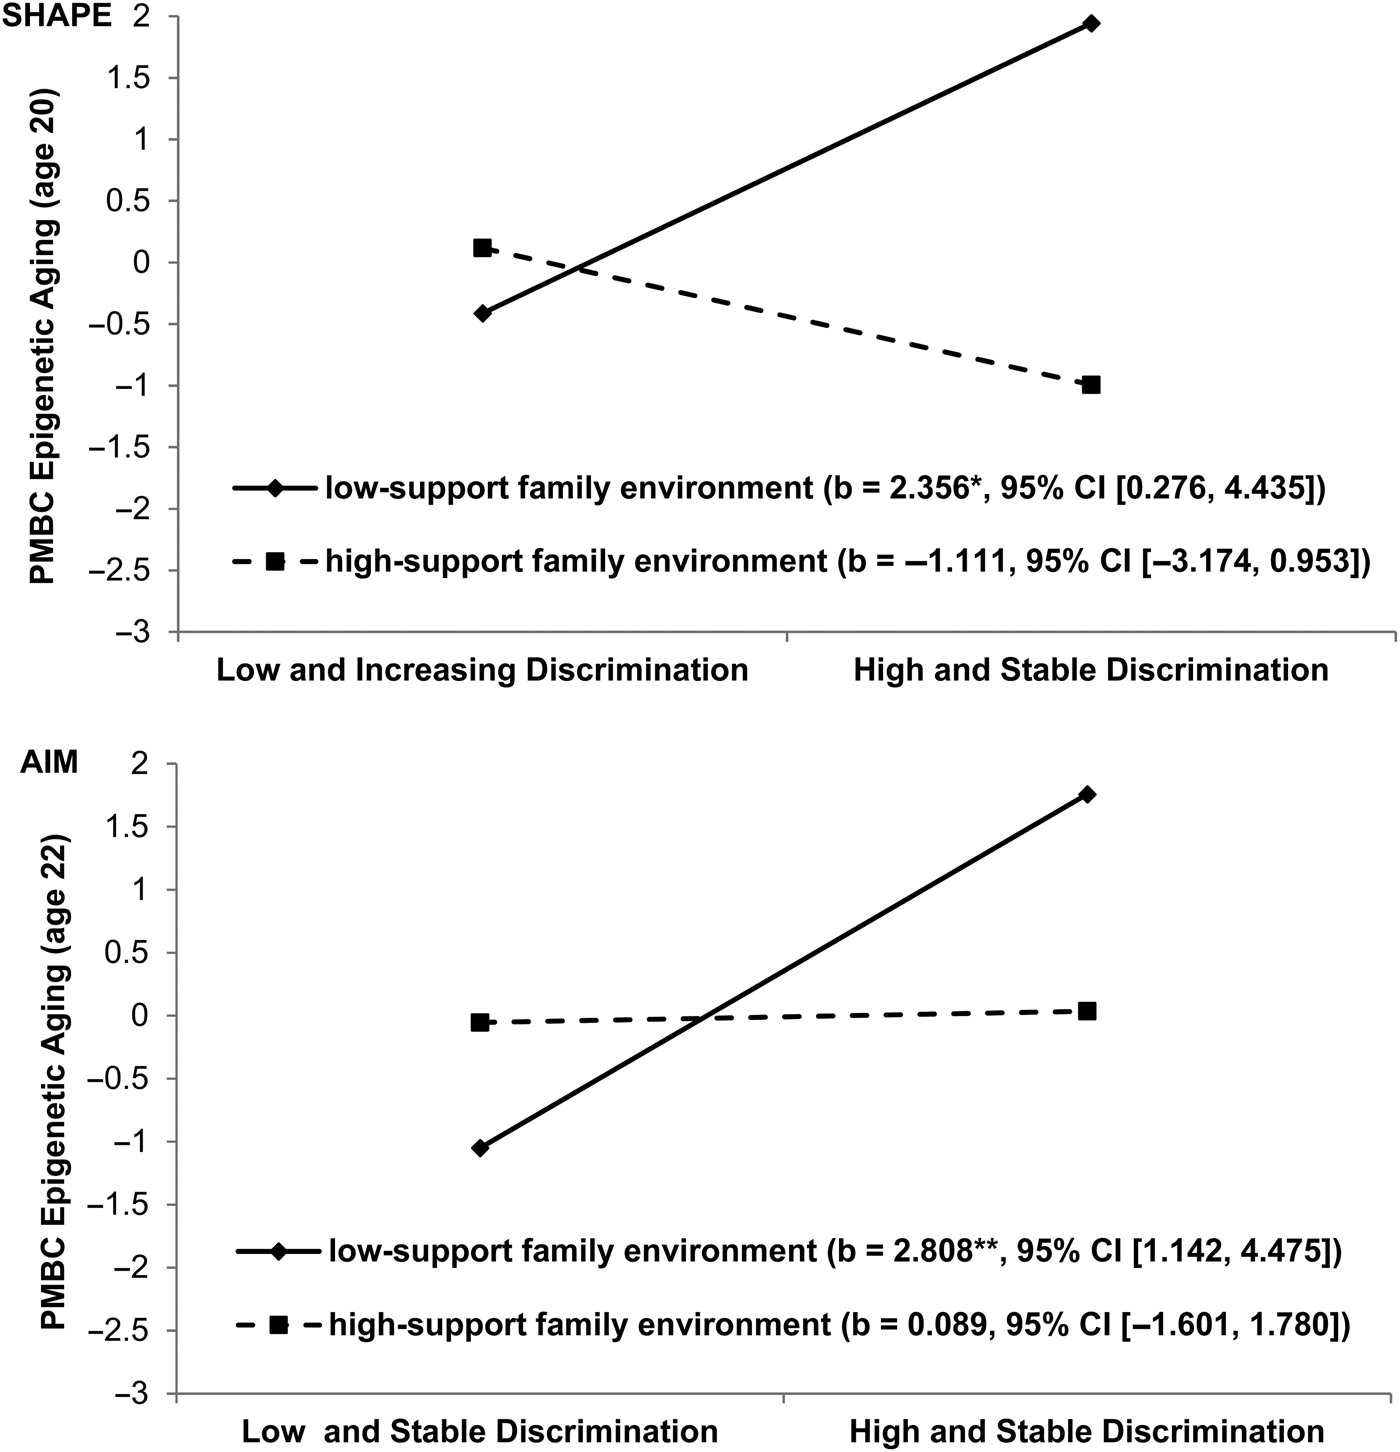
The second study was designed to extend the buffering effects hypothesis in two ways. First, the prospective contribution of racial discrimination to epigenetic aging was examined as an indicator of weathering. Second, two independent longitudinal samples were studied, allowing us to determine whether our findings could be replicated (Brody, Miller, et al., Reference Brody, Miller, Yu, Beach and Chen2016). Participants in the Strong African American Healthy Adult Project (SHAPE; N = 322) and the Adults in the Making project (AIM; N = 294) took part in this study. Racial discrimination and supportive family environments, along with confounder variables, were assessed when youths in SHAPE were 16 to 18 years of age and those in AIM were 17 to 19 years of age. Participants in each cohort provided antecubital blood samples (at age 20 in SHAPE and age 22 in AIM) that were used to assess epigenetic aging. Gender, cumulative SES risk, perceived life stress, depressive symptoms, and BMI were controlled in the analyses. The results are illustrated in Figure 5. Among youths in supportive family environments, exposure to high levels of racial discrimination did not forecast epigenetic aging. Among youths in less supportive family environments, exposure to high levels of racial discrimination forecast accelerated epigenetic aging. The results did not change when confounder variables were included in the data analyses, and the results were replicated across cohorts. Taken together, the results of both studies support the hypothesis that exposure to racial discrimination during early stages of development, particularly for youths without countervailing protective resources, can weather physiological systems, resulting in the premature aging of cells and perhaps a shorter life expectancy.
The effect of racial discrimination on youths’ epigenetic aging by supportive family environments for (top) the Strong African American Healthy Adult Project and (bottom) the Adults in the Making Project. The lines represent the regression lines for different levels of support from the family environment (low = 1 SD below the mean, high = 1 SD above the mean). The numbers in parentheses refer to simple slopes. For the outcome, higher values reflect immune cells that are epigenetically older than expected based on chronological age. Adapted from “Supportive Family Environments Ameliorate the Link Between Racial Discrimination and Epigenetic Aging: A Replication Across Two Longitudinal Cohorts,” by G. H. Brody, G. E. Miller, T. Yu, S. R. H. Beach, and E. Chen, Reference Brody, Miller, Yu, Beach and Chen2016, Psychological Science. Copyright 2016 by the authors. Adapted with permission.

What is the takeaway message of the proof of principal studies?
The proof of principal studies were based on research suggesting that children and youths who experience chronic stressors are vulnerable to a wide range of health problems across the life span (Miller, Chen, et al., Reference Chen, Miller, Kobor and Cole2011). They show heightened prevalence of CDAs such as metabolic syndrome, coronary heart disease, some cancers, and autoimmune conditions as they age (Shonkoff et al., Reference Shonkoff, Boyce and McEwen2009). The proof of principal studies support the hypothesis that changes in biological processes and the weathering of young bodies that foreshadow CDAs are presaged by economic hardship in families and neighborhoods, and by race-related stressors. This work is also consistent with extant literature that has identified supportive family processes that protect youths exposed to adversity from developing markers of biological weathering, such as AL and epigenetic aging. We recognize that these results are derived from longitudinal studies that cannot, by themselves, distinguish among causes, effects, and confounds. The results, however, converge with animal experiments that document long-term health consequences of early stress exposure (Avitsur, Hunzeker, & Sheridan, Reference Avitsur, Hunzeker and Sheridan2006; Lupien, McEwen, Gunnar, & Heim, Reference Lupien, McEwen, Gunnar and Heim2009). Considered together, the proof of principal studies suggest that the economic hardship and race-related stressors with which some children and adolescents contend contribute causally to health problems later in life.
Is Resilience Only Skin Deep? Can Striving for Success Cost African American Young Adults Their Health?
The resilience literature is characterized by a widespread assumption that, if children and youths who faced major adversities are doing well as indexed by external behaviors, for example, if they excel academically and evince markers of psychosocial adjustment, they have successfully negotiated those adversities. This is true for many African American children, youths, and young adults whom we have been following in our research program. They do so in part by cultivating a kind of determined persistence similar to the high-effort coping strategy termed John Henryism (James, Reference James1994). Often, with nurturing from a parent, relative, or mentor, they set goals for the future, work diligently toward them, navigate setbacks, stay focused on the long term, and resist temptations that might deter them from reaching their goals.
We began studying these resilient young people to find out if their self-control, planfulness, success at school, and determination to succeed also translated into physical health benefits. We reasoned that, if youths from rural low-SES backgrounds were succeeding academically and emotionally, they might also be protected from health problems that were more common in lower income youths. However, we found the exact opposite to be true. These young people were achieving success by all conventional markers: doing well academically, staying out of trouble, making friends, and developing a positive sense of self. However, their physical health was deteriorating underneath. Next, we describe the studies that led us to this conclusion.
Psychosocial competence and self-control as a double-edged sword for physical health among low-SES rural African American youths
Our first hints of this pattern came from a study of 489 rural African American youths in Georgia, whom we had been following for 15 years (Brody, Yu, Chen, Miller, et al., Reference Brody, Yu, Chen, Miller, Kogan and Beach2013). Most of them came from families who were working but poor. In 2010, their average family annual income was about $12,000; about half lived below the poverty line. We found a subgroup of resilient children who, despite these obstacles, were rated at age 11 by their teachers as being diligent, focused, planful, academically successful, and strong in social skills.
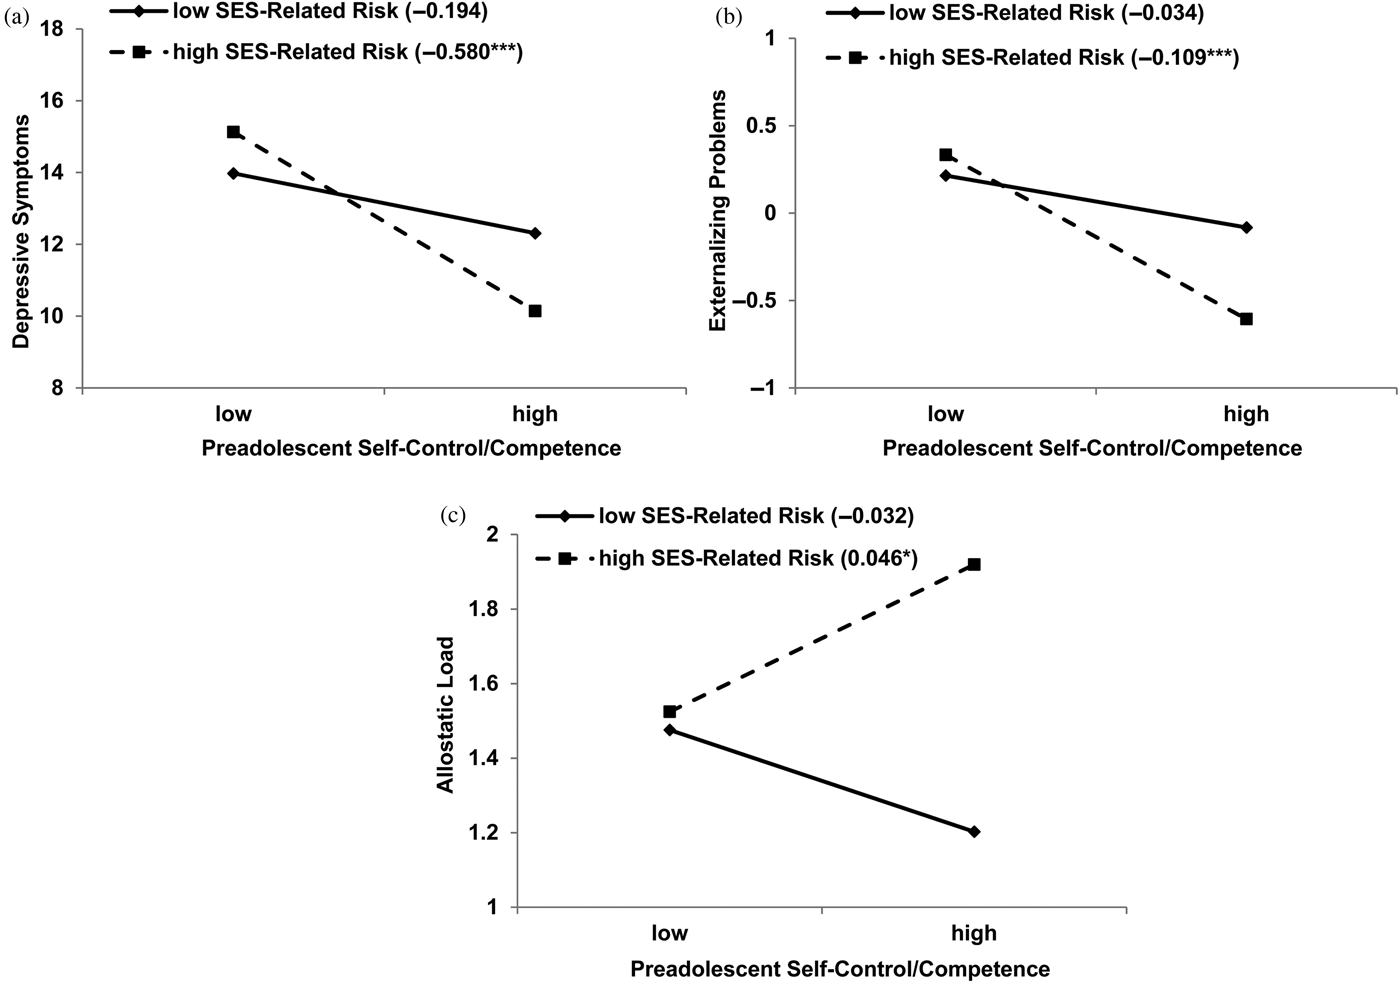
This sample was followed over time, and when the youths reached age 19 years, we assessed depression, externalizing behavior, and AL. As in past studies, those who were rated positively at age 11 by their teachers had relatively few problems with depression or externalizing behavior. When we looked beneath their skin at their AL levels, though, these apparently resilient young people were not faring well; they evinced higher AL levels compared with others in the study. Their AL was even worse than peers who, at age 11, had been rated by their teachers as having poorer self-control and psychosocial competence. They were at substantial risk for developing diabetes and hypertension in the future. Figure 6 depicts the results for depressive symptoms and externalizing behavior (Figure 6a, b) and AL (Figure 6c).
Young adults’ (a) depressive symptoms, (b) externalizing problems, and (c) allostatic load as a function of their socioeconomic status-related risk and self-control/competence in preadolescence (low = 1 SD below the mean; high = 1 SD above the mean). The lines represent the results of regression analyses at low and high levels of socioeconomic status related risk, and the numbers in parentheses refer to the simple slopes. *p < .05, ***p < .001. Adapted from “Is Resilience Only Skin Deep? Rural African Americans’ Socioeconomic Status-Related Risk and Competence in Preadolescence and Psychological Adjustment and Allostatic Load at Age 19,” by G. H. Brody, T. Yu, E. Chen, G. E. Miller, S. M. Kogan, and S. R. H. Beach, Reference Brody, Yu, Chen, Miller, Kogan and Beach2013, Psychological Science, 24, p. 1290. Copyright 2013 by the authors. Adapted with permission.

Neighborhood poverty, college attendance, and skin-deep resilience
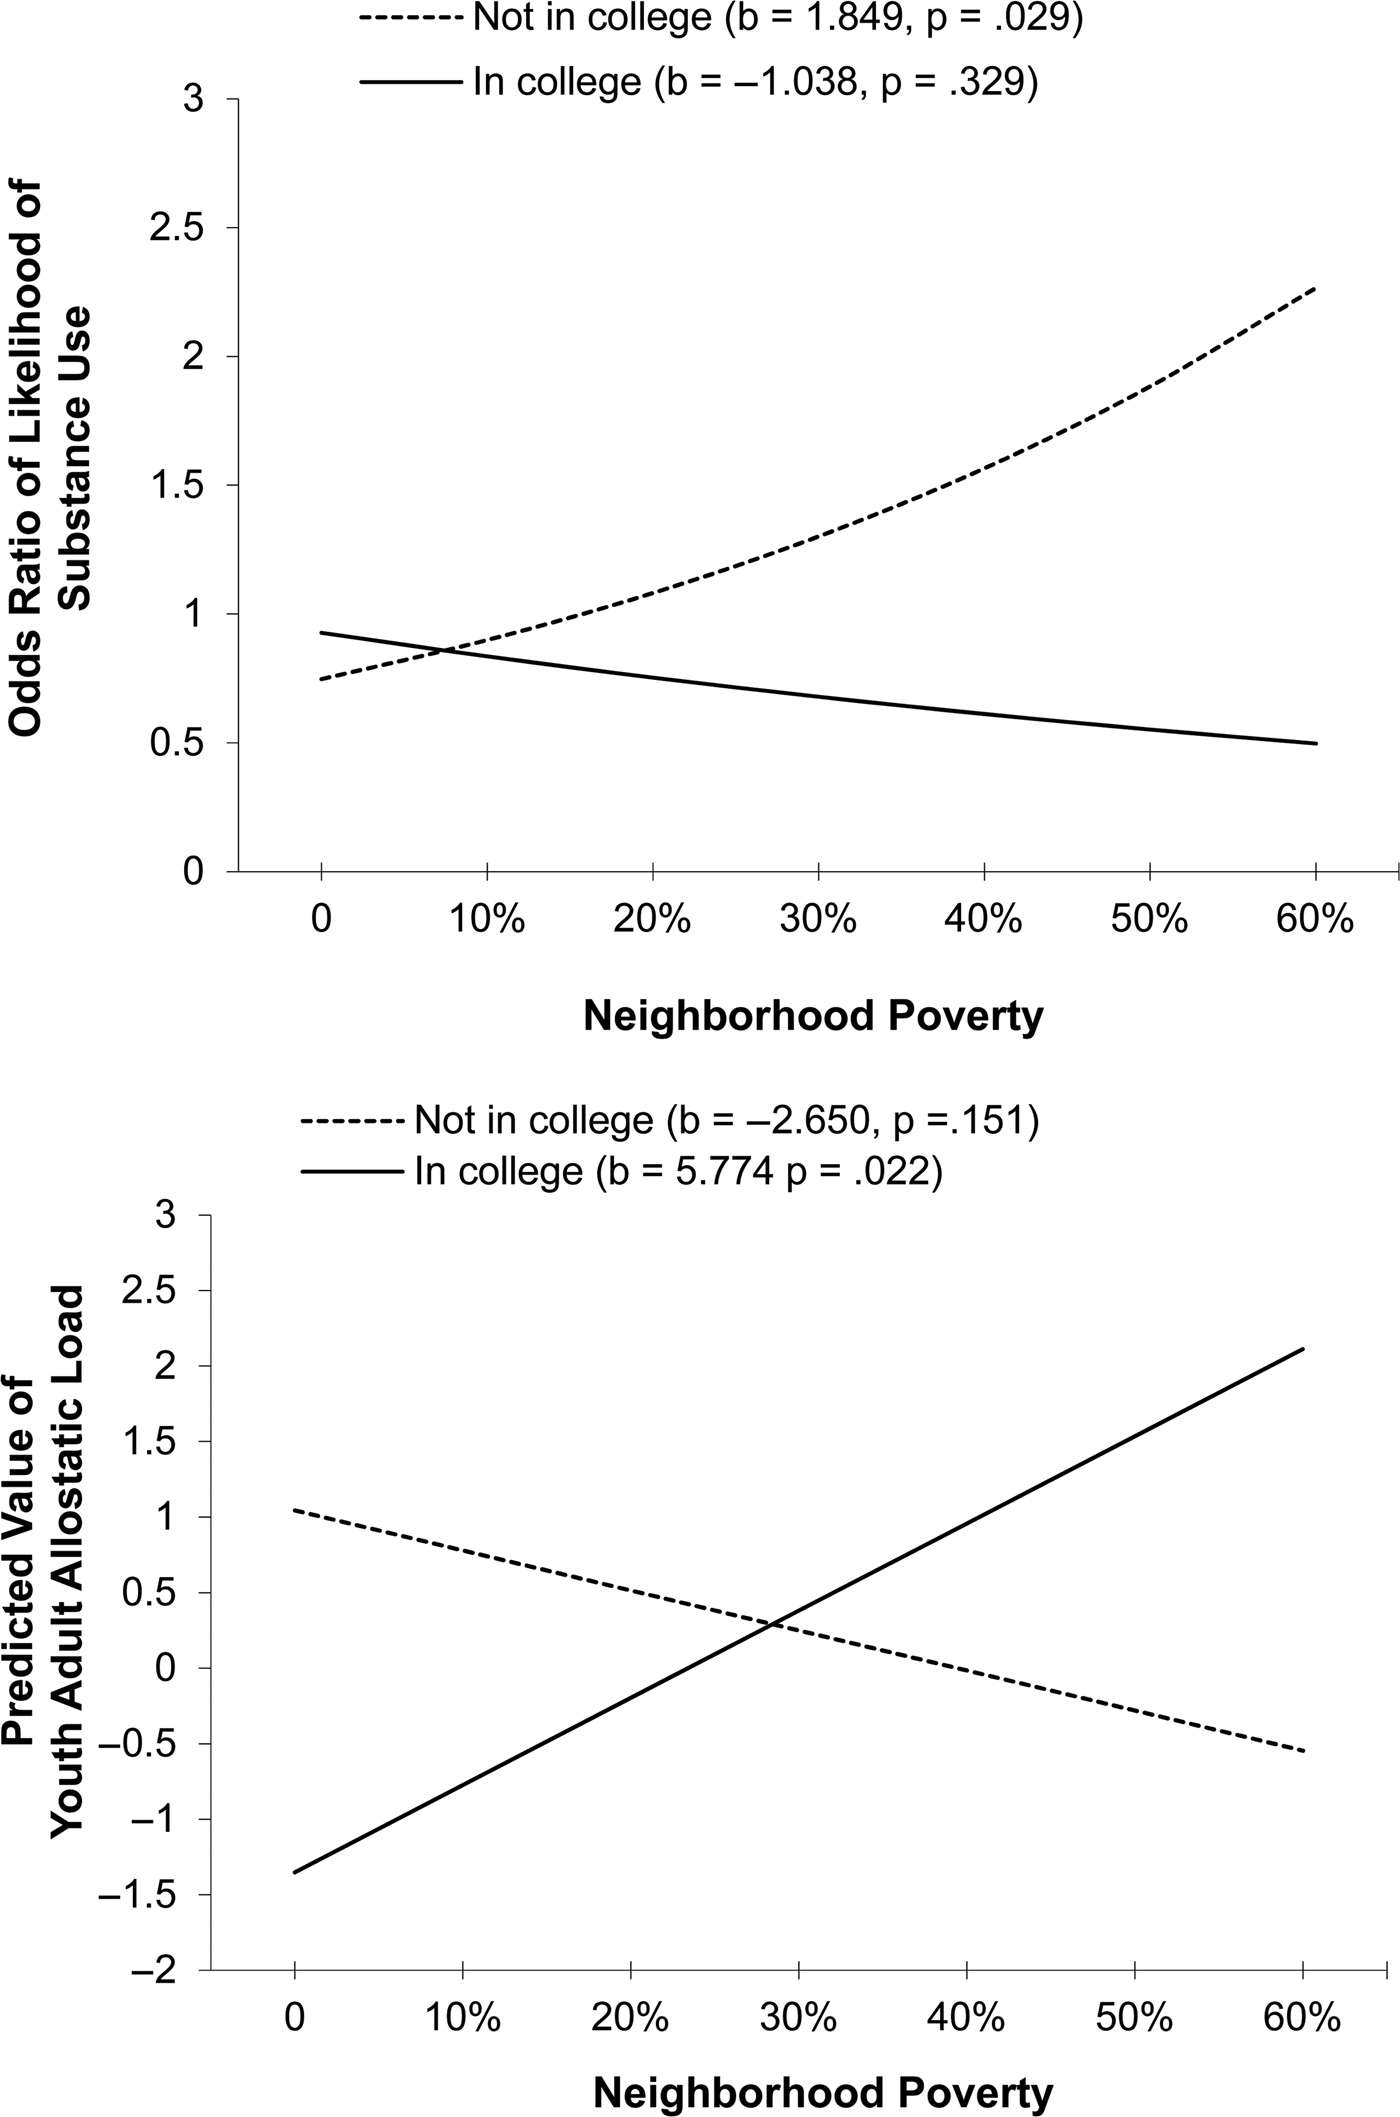
We continued studying the youths described in the preceding section as they transitioned into young adulthood. In this analysis, Chen et al. (Reference Chen, Miller, Yu and Brody2016) focused on a subgroup of participants who would normatively be viewed as resilient. These individuals maintained academic success, despite living in challenging neighborhoods with concentrated poverty: they had graduated from high school and were attending college. Compared with other participants, this cohort had lower rates of cigarette, alcohol, and marijuana use at 20 years of age. This resilience, however, was just skin deep. Despite their academic success and healthful lifestyles, these youths showed relatively poor health as indexed by higher levels of AL. Figure 7 depicts these results. These results and those of our first study in this research program were interpreted from the perspective of John Henryism theory (James, Reference James1994). The John Henryism construct takes its name from, and is inspired by, the legend of John Henry, “the steel-driving man.” According to the story (Williams, Reference Williams1983), John Henry was an African American railroad worker in the late 1800s whose fame was derived from his participation in a steel-driving contest in which he defeated a steam-powered drill. John Henry was forced to harness his great strength to overpower the mechanical drill, but afterward died of exhaustion. For James (Reference James1994), the fabled actions of John Henry illuminate associations among high-effort coping, chronic sympathetic nervous system (SNS) arousal, and health problems, including hypertension. The construct comprises three main characteristics: efficacious mental and physical vigor, a strong commitment to hard work, and a single-minded determination to succeed. According to this theory, many rural African Americans should resemble John Henry. While growing up in a high-risk context, they are highly goal oriented, hardworking, and focused persistently on success; they avoid behaviors that could derail their pursuit of success; and, eventually, they manifest indicators of physiological stress. These findings suggest that resilience is multidimensional; hidden indicators, such as AL, of compromised physiological health may accompany observable competence and positive adjustment. In such cases, resilience may be only skin deep.
Effect of neighborhood poverty on (top) substance use and (bottom) allostatic load by college attendance. Adapted from “Neighborhood Poverty, College Attendance, and Diverging Profiles of Substance Use and Allostatic Load in Rural African American Youth,” by E. Chen, G. E. Miller, G. H. Brody, and M. K. Lei, Reference Chen, Miller, Yu and Brody2015, Clinical Psychological Science, 3, p. 681. Copyright 2014 by the authors. Adapted with permission.

Self-control forecasts better psychosocial outcomes but faster epigenetic aging in low-SES youths
The development of self-control played a prominent role in the two studies just described. A growing research literature indicates that youths who exhibit greater self-control go on to perform better in school, earn higher salaries, remain more stably employed, and save more money. These youths are less likely to use drugs, be arrested for and convicted of crimes, and develop psychiatric disorders. In early adulthood, these youths also show better physical health (Moffitt et al., Reference Moffitt, Arseneault, Belsky, Dickson, Hancox and Harrington2011). The research previously reported, however, added a caveat to the role of self-control for rural African American youths by showing that, despite academic success and healthful lifestyles, youths from a low SES background evinced relatively poor cardiometabolic health as reflected in obesity, high blood pressure, and stress hormones. These findings suggested that self-control might act as a double-edged sword, facilitating academic success and psychosocial adjustment while at the same time undermining cardiometabolic health.
To extend this research program, Miller, Yu, Chen, and Brody (Reference Miller, Yu, Chen and Brody2015) tested the hypothesis that the self-regulatory demands that are described in John Henryism theory as being necessary for African American youths to attain normatively favorable life outcomes would prematurely age bodily tissues through a process known as weathering (Geronimus et al., Reference Geronimus, Hicken, Keene and Bound2006). This hypothesis was tested with a new sample of rural African American youths who were followed across the transition from adolescence to adulthood. To clarify the mechanisms by which skin-deep resilience develops, this study focused on the aging of immune system cells using an epigenetic biomarker derived from DNA methylation. This marker was described previously in the Chen et al. (Reference Chen, Miller, Yu and Brody2016) and Brody, Miller, et al. (Reference Brody, Miller, Yu, Beach and Chen2016) proof of principal studies. A hypothesis was examined with 292 participants from the AIM study. From 17 to 20 years of age, we annually assessed SES, self-control, depressive symptoms, substance use, aggressive behaviors, and internalizing problems. At age 22 years, we obtained DNA methylation profiles of peripheral blood mononuclear cells. These data were used to measure epigenetic aging, a methylation-derived biomarker reflecting the disparity between biological and chronological aging.
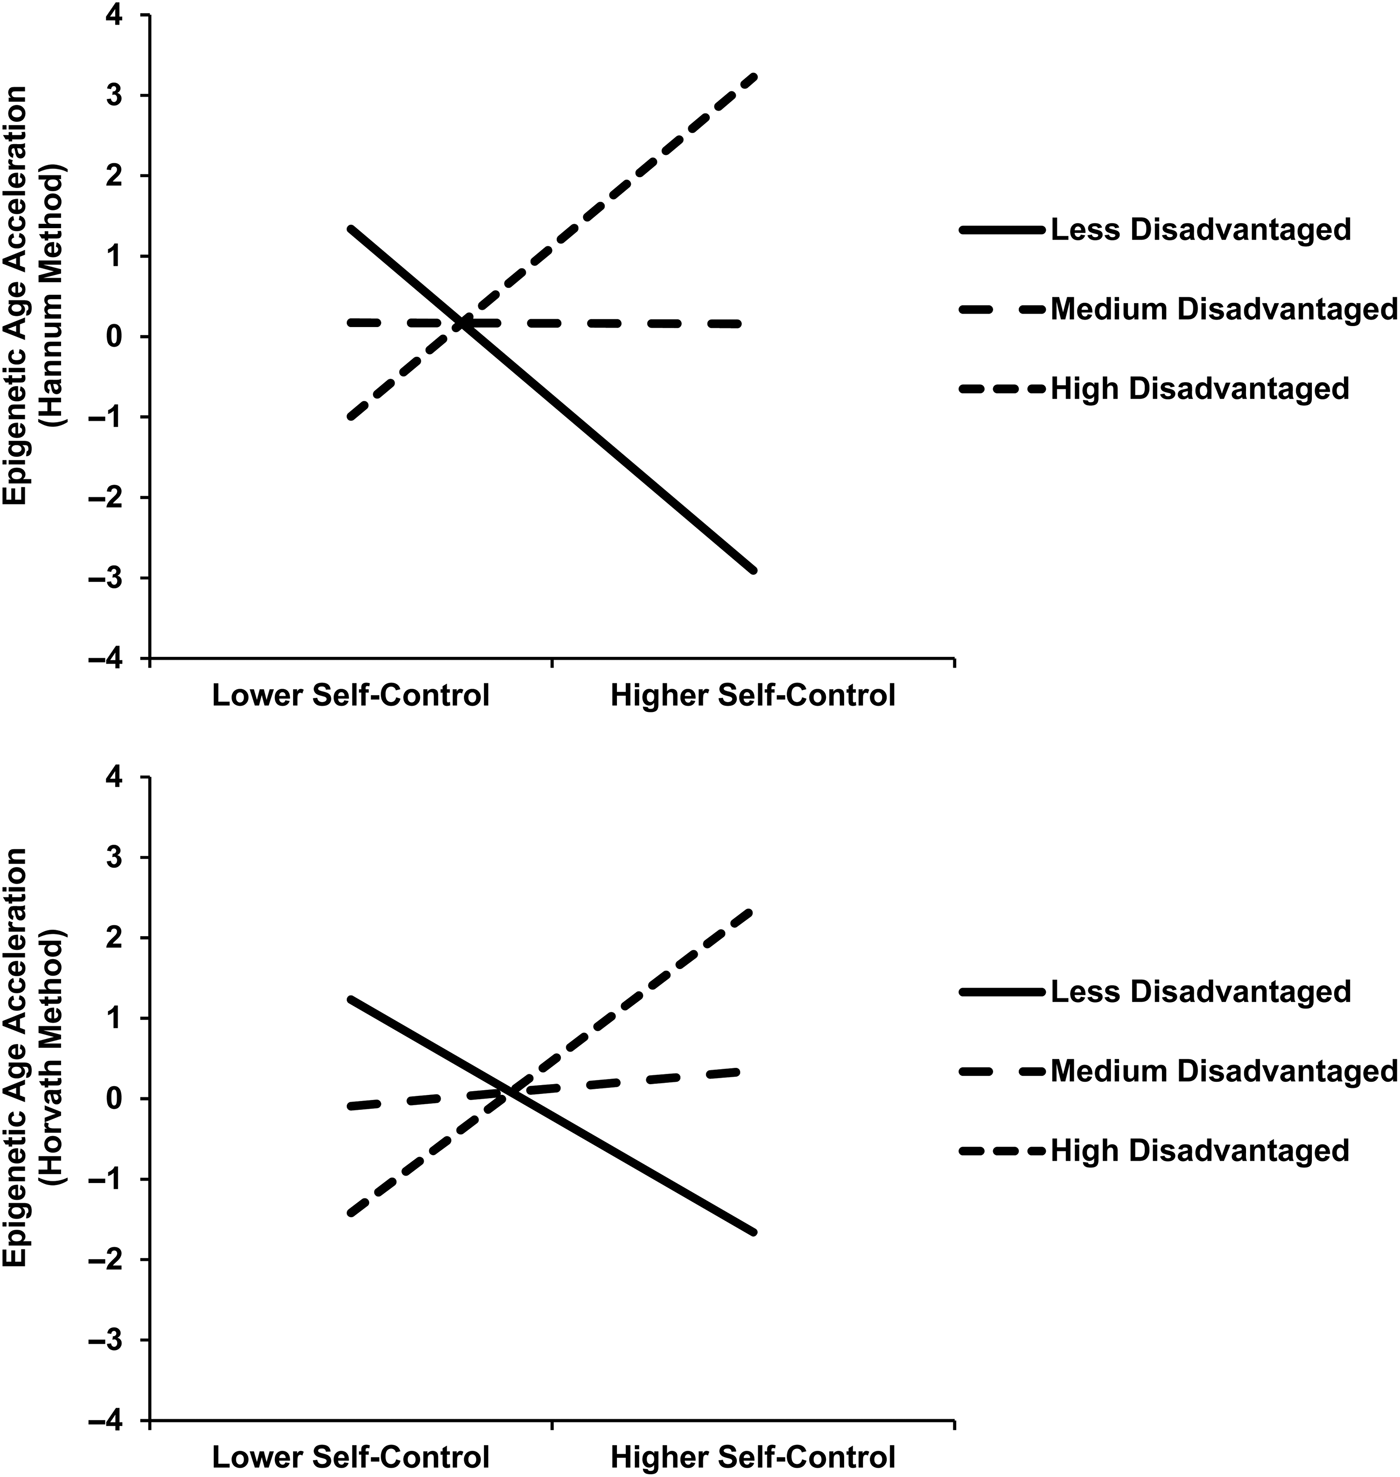
Among relatively higher SES youths, better midadolescent self-control presaged favorable psychological and epigenetic aging outcomes. However, among low-SES youths, self-control displayed divergent associations with these outcomes. Self-control forecast lower rates of depressive symptoms and other internalizing problems, substance use, and aggressive behavior, but faster epigenetic aging. The results for epigenetic aging are presented in Figure 8. These patterns again suggest that, for low-SES youths, resilience is a skin-deep phenomenon wherein outward indicators of success can mask emerging physical health problems. The patterns in this study are consistent with evidence indicating that relentlessly pursuing goals can detract from physical health (Wrosch, Scheier, & Miller, Reference Wrosch, Scheier and Miller2013), particularly when structural forces impede progress toward those goals. As rural African Americans strive for favorable life outcomes, they have substantial barriers to overcome and competing demands to balance, including resource-deprived schools, family obligations, and both interpersonal and structural discrimination (Johnson, Richeson, & Finkel, Reference Johnson, Richeson and Finkel2011). Navigating these challenges requires intense and persistent self-control (Vohs, Reference Vohs2013), which is demanding to maintain and, as our studies show, forecast health costs in the forms of cardiometabolic risks and rapid cell aging.
Self-control's association with epigenetic age acceleration varies according to socioeconomic status. Depiction of estimated (top) Hannum values and (bottom) Horvath values at lower (−1.5 SD) and higher (+1.5 SD) levels of self-control and socioeconomic disadvantage. Adapted from “Self-Control Forecasts Better Psychosocial Outcomes but Faster Epigenetic Aging in Low-SES Youth,” by G. E. Miller, T. Yu, E. Chen, and G. H. Brody, Reference Miller, Yu, Chen and Brody2015, Proceedings of the National Academy of Sciences, 112, pp. 10326–10327. Copyright 2015 by the authors. Adapted with permission.

What can be done to mitigate these negative health effects? To begin, schools and colleges that serve lower income African American students could provide health education, screenings, and check-ups as a part of their curricula and student services programs. This would allow the detection and correction of incipient health problems before they become serious. In addition, prevention programs could be developed to help young people learn ways of coping other than doubling down on their self-regulatory strengths and becoming even more determined to succeed. One such coping style, shift and persist, could be encouraged. Shifting entails accepting one's life circumstances and adapting to them, and persisting involves enduring those circumstances by holding on to meaning and optimism. Together, these strategies mitigate the health impact of stressors that many low-SES youths face. Research shows that low-SES youths who use shift and persist strategies have profiles of low inflammation similar to those of their high-SES peers (Chen, Lee, Cavey, & Ho, Reference Chen, Lee, Cavey and Ho2013; Chen, Strunk, et al., Reference Chen, Strunk, Trethewey, Schreier, Maharaj and Miller2011). Other prevention approaches could equip college-bound youths with (a) cognitive behavioral management skills to reduce negative and increase positive perseverative cognitions (Antoni et al., Reference Antoni, Lehman, Klibourn, Boyers, Culver and Alferi2001), (b) mindfulness training that can help youths to focus on the present and reduce ruminative stress-generating cognitions (Bishop, Reference Bishop2002), and (c) social networks of college-aged and older mentors who have navigated similar life challenges and can offer real-world guidance and support. Mentors and other trusted confidants could help temper feelings of social isolation and provide ways to cope with and address both explicit and subtle racial discrimination.
The Health Benefits of Family-Centered Drug Use Prevention Programs
To date, we have focused particularly on resilience in our research program. Our proof of principal studies demonstrated that, even in populations who experience high levels of SES risk or race-related stressors, only a minority experience indicators of biological weathering. Resources such as supportive family environments functioned as stress buffers for these youths. To increase confidence in our findings that supportive relationships offset biological weathering associated with SES and race-related stressors, we conducted secondary analyses of two randomized prevention trials. Both trials were designed to enhance parenting and strengthen family relationships among rural African American preadolescents and young adults. The Strong African American Families (SAAF) program (Brody et al., Reference Brody, Murry, Gerrard, Gibbons, Molgaard and McNair2004) was designed to enhance parenting, strengthen family relationships, foster youth competencies, and deter drug use among rural African American preadolescents. Its efficacy in enhancing protective parenting processes and deterring drug use has been well documented (Brody, Kogan, et al., Reference Brody, Kogan, Grange, King and Maholmes2012). The second prevention trial was the AIM project (Brody, Yu, Chen, Kogan, & Smith, Reference Brody, Yu, Chen, Kogan and Smith2012). AIM has been shown to enhance family support and deter drug use and the problems it brings, particularly among young adults confronting high levels of contextual risks (Brody, Yu, Beach, & Philibert, Reference Brody, Yu, Beach and Philibert2015; Brody, Yu, et al., Reference Brody, Yu, Chen, Kogan and Smith2012). To test the potential health benefits of these prevention programs, we collected biomarkers from youths who took part in these trials to determine whether participation in these family-centered interventions also reduced indicators of biological weathering.
SAAF and reductions in inflammation
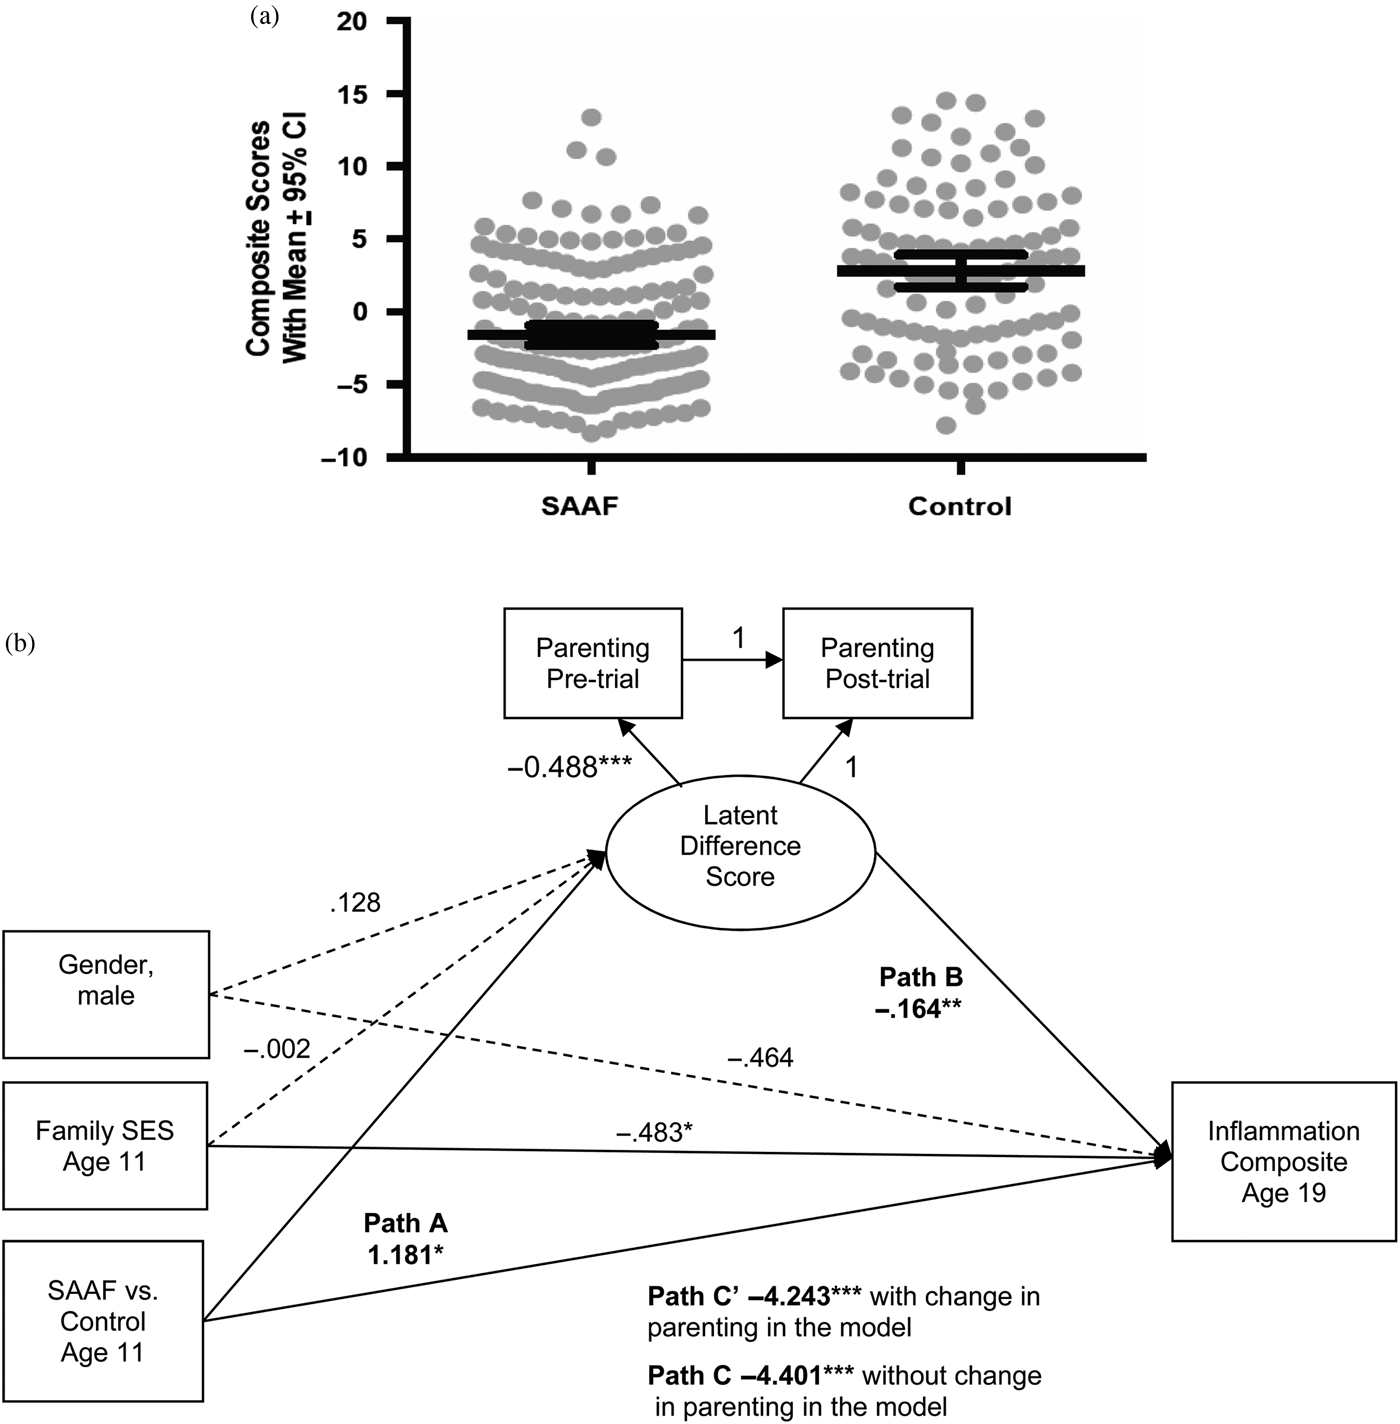
In this analysis, we sought to determine whether participation in SAAF at age 11 could reduce markers of low-grade inflammation measured when the participants were 19 years of age (Miller, Brody, Yu, & Chen, Reference Miller, Brody, Yu and Chen2014). Low-grade inflammation has clinical significance for African Americans because it is a common pathogenic mechanism in the progression of cardiovascular disease, diabetes, stroke, and hypertension, all of which are highly prevalent among African Americans residing in the Black Belt. When youths reached age 20 years, peripheral blood was collected to measure six cytokines that orchestrate inflammation. Youths who participated in SAAF had significantly less inflammation on all six cytokine indicators than did members of the control group. These results are depicted in Figure 9a. We also tested the hypothesis that SAAF-induced increases in nurturant parenting, combined with decreases in harsh parenting, would account for the intervention's effects on cytokines. Mediational analyses, presented in Figure 9b, suggested that improved parenting was partially responsible for SAAF's benefits. Inflammation was lowest among youths who, as a consequence of the intervention, received more nurturant–involved parenting and less harsh–inconsistent parenting. This study provided quasi-experimental evidence that a family-centered intervention can reduce inflammation in youths, in part by improving the quality of the parenting they receive. To the extent that they are substantiated in future research, these results may provide another strategy for combating racial and social disparities.
(a) Youth whose families participated in the Strong African American Families program had less inflammation than did controls. The endpoint is a composite indicator of inflammation, formed by summing each subject's z-scored values for interleukins-1β, 6, 8, and 10, plus tumor necrosis factor-α and interferon-γ. Dots represent individual data points. Within each group, the wide horizontal bar is the mean composite score, and the error bars reflect 95% confidence intervals. (b) The results are consistent with the hypothesis that the Strong African American Families program's ability to reduce inflammation is partially attributable to improved parenting. The figure shows results from a mediation model with latent difference scores. Solid and dashed lines reflect significant and nonsignificant paths, respectively. Unstandardized coefficients are shown. *p < .05, **p < .01, ***p < .001. Adapted from “A Family-Oriented Psychosocial Intervention Reduces Inflammation in Low-SES African American Youth,” by G. E. Miller, G. H. Brody, T. Yu, and E. Chen, Reference Miller, Brody, Yu and Chen2014, Proceedings of the National Academy of Sciences, 111, pp. 11289–11290. Copyright 2014 by the authors. Adapted with permission.

SAAF ameliorates the longitudinal association between risky family processes and epigenetic aging
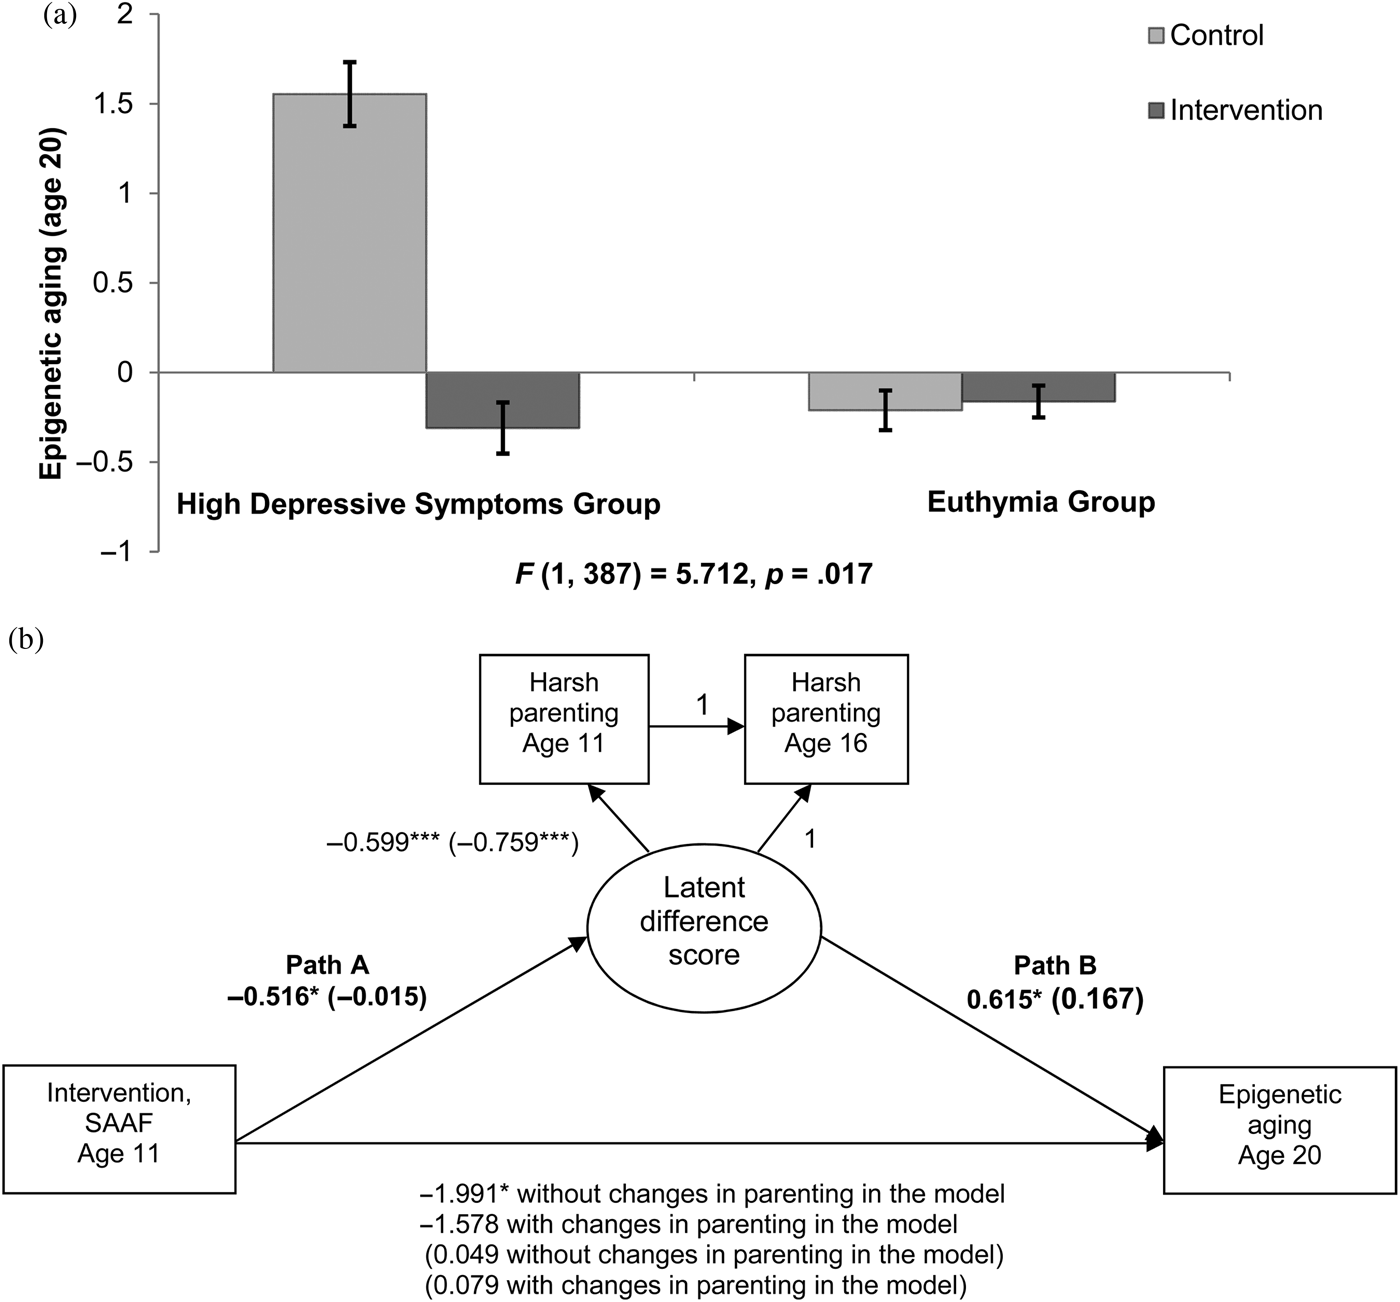
A growing body of research hints at the possibility that emotionally cold and harsh interactions with one's parents during childhood contribute not only to psychosocial and psychiatric problems but also to vulnerability to chronic diseases later in life (Miller, Chen, et al., Reference Chen, Miller, Kobor and Cole2011). The risky family model (Repetti, Taylor, & Seeman, Reference Repetti, Taylor and Seeman2002) posits that home environments headed by a primary caregiver who displays elevated levels of depressive symptoms and uses harsh parenting practices triggers a cascade of psychological and biological vulnerabilities that can weather physiological systems, resulting in premature aging of cells and a shortened life expectancy (Geronimus et al., Reference Geronimus, Hicken, Keene and Bound2006). This study was designed to further understanding of the ways in which risky family processes generate negative consequences for health. We tested three hypotheses: (a) elevated levels of parental depressive symptoms when children are 11 years of age will forecast accelerated epigenetic aging 9 years later at age 20, (b) participation in SAAF will ameliorate the association between parental depression and epigenetic aging, and (c) a moderation–mediation hypothesis will show that prevention-induced reductions in harsh parenting will account for SAAF effects in reducing accelerated epigenetic aging for youths living with a parent who reports elevated depressive symptoms (Brody, Yu, Chen, Beach, & Miller, Reference Brody, Yu, Chen, Beach and Miller2016). To test these hypotheses, parents reported their own depressive symptoms when their children were 11 years of age, and both youths and parents reported youth exposure to harsh parenting at ages 11 and 16 years. Blood was drawn at age 20 years to measure epigenetic aging. The results revealed that elevated parental depressive symptoms forecast accelerated epigenetic aging among youths in the control condition, but not among SAAF participants. These results are depicted in Figure 10a. Moderated-mediation analyses confirmed that reductions in harsh parenting accounted for SAAF's protective effects against epigenetic aging. This analysis is presented in Figure 10b. The results supported the study hypotheses and demonstrated that intervention-induced reductions in harsh parenting accounted for the association between parental depression levels and slowed epigenetic aging. Embedding the assessment of epigenetic aging in SAAF increased confidence in the causal nature of the hypothesized linkage between parenting and epigenetic aging.
(a) Means of epigenetic aging at age 20 for the control and intervention groups by parent-reported depression status. High depressive symptoms group, n = 111: control group = 42, Strong African American Families program group = 69. Euthymia group, n = 288: control group = 115, Strong African American Families program group = 173. Error bars = ±1 SE. (b) A moderated-mediation model of intervention status, changes in harsh parenting from age 11 to age 16, and epigenetic aging at age 20 for the high depressive symptoms group versus the euthymic group. Family socioeconomic-related risk, gender, body mass index, smoking, unhealthful behaviors, and batch assignment were controlled (not shown). Unstandardized coefficients are presented. Numbers in parentheses refer to coefficients for the euthymic group. *p < .05, ***p < .001, both two tailed. Adapted from “Family-Centered Prevention Ameliorates the Longitudinal Association Between Risky Family Processes and Epigenetic Aging,” by G. H. Brody, T. Yu, E. Chen, S. R. H. Beach, and G. E. Miller, Reference Brody, Yu, Chen, Beach and Miller2016, Journal of Child Psychology and Psychiatry. Copyright 2015 by the Association for Child and Adolescent Mental Health. Adapted with permission.

AIM moderates the association between nonsupportive parenting and diminished TL
To understand how social environments and psychological processes impact health and the aging process, researchers have sought biomarkers that provide a window into social environments’ associations with aging. TL, like epigenetic aging, appears to be such a marker. Telomeres, the protective caps at the tips of chromosomes, shorten with age. This shortening predicts both disease and longevity (Blackburn, Reference Blackburn2005; Epel, Reference Epel2009). TL may be viewed from a life span approach because it partly reflects the cumulative number of cell divisions that have occurred and the long-term biochemical environment. Many studies find a negative association between age and TL (Monaghan & Haussmann, Reference Monaghan and Haussmann2006), but substantial variation in TL exists among age-matched individuals. Reduction in TL has been associated contemporaneously with the presence of subclinical cardiovascular disease, stroke, diabetes, and autoimmune disease (D'Mello et al., Reference D'Mello, Ross, Briel, Anand, Gerstein and Paré2015; Haycock et al., Reference Haycock, Heydon, Kaptoge, Butterworth, Thompson and Willeit2014). Although in these conditions TL could be only an indicator of ongoing disease processes, other evidence implicates TL as a predictor of the likelihood of future disease states despite current health status. Prospective studies have indicated that short TL predicts the occurrence of cancer (Weischer et al., Reference Weischer, Nordestgaard, Cawthon, Freiberg, Tybjærg-Hansen and Bojesen2013), hypertension (Yang et al., Reference Yang, Huang, Jiang, Zhang, Liu and Qin2009), and all-cause mortality (Rode, Bojesen, & Nordestgaard, Reference Rode, Bojesen and Nordestgaard2015).
A growing body of evidence has demonstrated that telomeres shorten with exposure to chronic stress via oxidative, endocrine, and inflammatory processes, along with other forms of biological stress (Shalev, Entringer, et al., Reference Shalev, Entringer, Wadhwa, Wolkowitz, Puterman and Lin2013). Studies have found chronic psychological stress (Epel et al., Reference Epel, Blackburn, Lin, Dhabhar, Adler and Morrow2004), caregiving strain (Kiecolt-Glaser et al., Reference Kiecolt-Glaser, Gouin, Weng, Malarkey, Beversdorf and Glaser2011), social deprivation (Drury et al., Reference Drury, Theall, Gleason, Smyke, De Vivo and Wong2012), family violence (Drury et al., Reference Drury, Mabile, Brett, Esteves, Jones and Shirtcliff2014), and exposure to extrafamilial violence (Shalev, Moffitt, et al., Reference Shalev, Moffitt, Sugden, Williams, Houts and Danese2013) to be associated with diminished TL. Together, these data suggested that TL would be useful as another marker of the ways in which the stress associated with risky family environments forecasts biological aging at the cellular level.
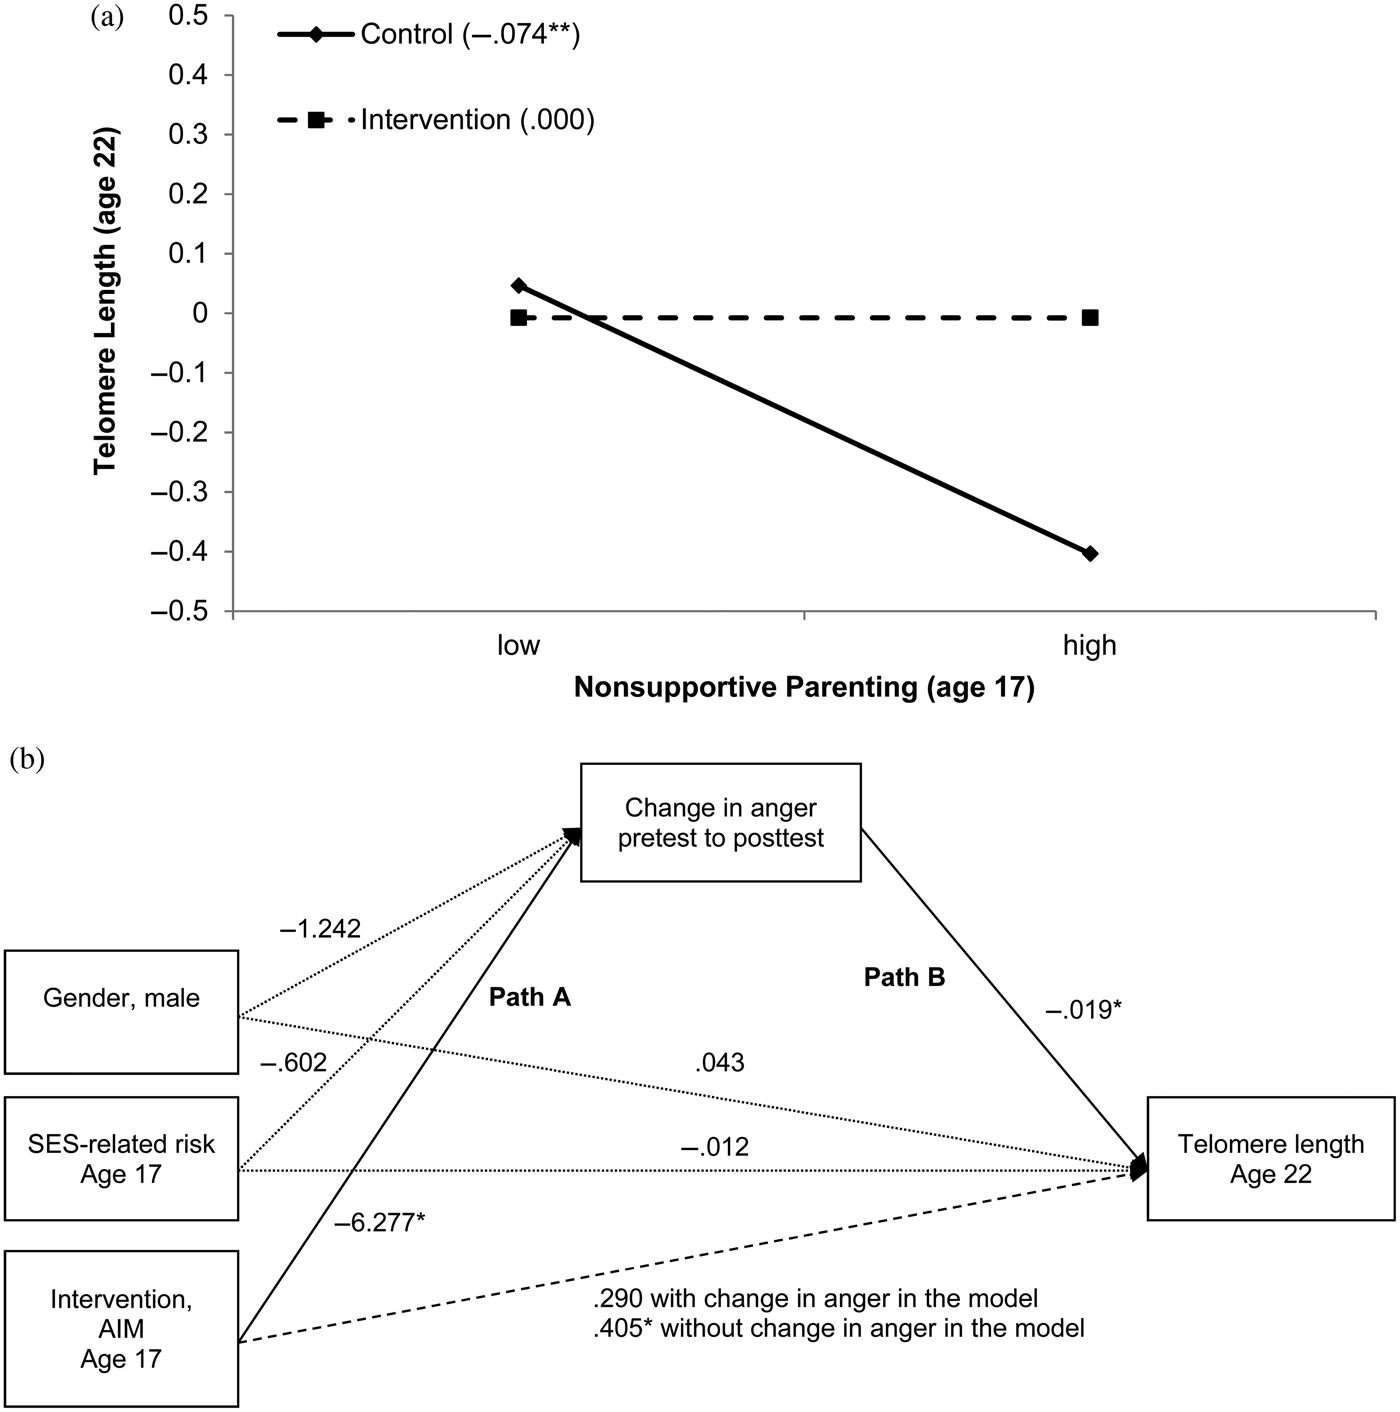
In this study, we tested hypotheses about the association between risky family processes and subsequent TL involving participants in the AIM prevention trial (Brody, Yu, Beach, et al., Reference Brody, Yu, Beach and Philibert2015). The purposes of the study were (a) to determine whether exposure to nonsupportive parenting, defined by high levels of conflict and rancor with low levels of warmth and emotional support, at age 17 years would forecast TL 5 years later; and (b) to determine whether participation in AIM could ameliorate these associations. An exploratory moderation–mediation hypothesis was also tested. We proposed that AIM-induced reductions in anger (a by-product of nonsupportive parenting; Brody, Yu, et al., Reference Brody, Yu, Beach, Kogan, Windle and Philibert2014) among adolescents who received high levels of nonsupportive parenting would account for AIM's effects on TL. Rural African American adolescents (N = 216) were assigned randomly to participation in the AIM program or a control condition. Primary caregivers provided data on nonsupportive parenting at baseline, when adolescents were 17 years of age. Adolescents provided data on anger at the pretest and a posttest administered 7 months later. When the participants were 22 years of age, TL was assayed from a blood draw.
The results indicated that heightened nonsupportive parenting forecast diminished TL among young adults in the control condition but not among those who took part in AIM. SES risk, life stress, and drug use at age 17 years, and BMI and blood pressure at age 22 years, were controlled in this analysis. These results are displayed in Figure 11a. In addition, the exploratory moderated-mediation analysis shown in Figure 11b suggested that AIM-induced reduction in adolescents’ anger served as a mediator connecting group assignment to TL. Presumably, anger sponsors frequent activations of the hypothalamus–pituitary–adrenal axis and SNS, the end products of which weather cells and tissues, helping to shorten TL. Taken together, this study's demonstration of program-induced maintenance of TL for young adults who, during adolescence, experienced high levels of parental conflict and rancor along with low levels of warmth, are important. From a theoretical viewpoint, the results show that the developmental progression from a parenting risk factor to TL is not immutable. From a public health perspective, this study, along with the others described in this section, show that developmentally appropriate prevention programs designed to enhance supportive parenting can ameliorate the effects of contextual risk factors on health-relevant outcomes that are evident at the cellular level.
(a) The contribution of nonsupportive parenting to youths’ telomere length by intervention status. Numbers in parentheses refer to simple slopes for control group and intervention group. **p < .01. (b) A moderated-mediation model of intervention status, change in anger from pretest to posttest, and telomere length at age 22 with socioeconomic-related risk and gender controlled. Unstandardized coefficients are presented; n = 65, *p < .05. Adapted from “Prevention Effects Ameliorate the Prospective Association Between Nonsupportive Parenting and Diminished Telomere Length,” by G. H. Brody, T. Yu, S. R. H. Beach, and R. A. Philibert, Reference Brody, Yu, Beach and Philibert2015, Prevention Science, 16, pp. 176–177. Copyright 2014 by the Society for Prevention Research. Adapted with permission.

Conclusion
Understanding the origins of health disparities and ways of preventing them requires a new, developmentally focused approach to research. Accordingly, our initial work was designed to determine whether and how the sociocontextual environments in which rural African Americans grow up presage biological residues that signal dysregulations in biological stress regulatory systems, immunological functioning, and cellular aging. This effort, using longitudinal, epidemiological research designs and randomized prevention trials, also showed how exposure to resilience-promoting environments functions as a stress buffer for youths. These studies further our understanding of the reasons why only a minority of youths who contend with economic hardship and race-related stressors go on to develop health problems (Chen & Miller, Reference Chen and Miller2012).
The biological mechanisms underlying the studies described in this paper remain unclear. Navigating the challenges posed by economic hardship and life in rural contexts can be metabolically and behaviorally demanding. These experiences seem likely to cause persistent activation of stress-response systems, in particular the hypothalamus–pituitary–adrenal axis and SNS. The hormonal end products of these systems can have downstream effects on immune functions, epigenetic aging, and TL. A second generation of research is needed that includes multiple waves of psychosocial, hormonal, and other biomarker data to pinpoint the neuroendocrine mechanisms involved in the processes through which stress gets under young people's skin. More important, such a research program would reveal the ways in which close relationships and certain coping styles interrupt this process to foster in youths resilience both above and below the skin. Some of this new generation of research should focus on processes beginning before birth, as the uterine environment is affected by the mother's environmental exposures and physiological responses. As we mentioned previously, early risks associated with low SES are linked not only to childhood health problems but also to adult health status regardless of one's SES in adulthood. Finally, our findings to date suggest ways to design more effective interventions that buffer the pathways by which economic hardship and SES-related stressors undermine health. Our research suggests that developmentally appropriate family-centered interventions designed to enhance parenting and strengthen families can buffer the biological residues of growing up in challenging contexts.