INTRODUCTION
Biodiversity encompasses all of life's variety including intraspecific genetic variation, species diversity within communities and variation in species composition of communities both within and among regions (Poulin and Morand, Reference Poulin and Morand2004). Parasites have proved to be an essential part of any comprehensive biodiversity survey because they provide insights into the history and biogeography of other organisms, the structure of ecosystems and the processes behind the diversification of life (Brooks and Hoberg, Reference Brooks and Hoberg2000; Poulin and Morand, 2000). Parasites represent a substantial portion of global biodiversity because most free-living metazoan species host one or more unique parasite species. Unfortunately, the biodiversity of most parasite groups is poorly understood, with only a fraction of the estimated number of species collected and fewer described; relatively little progress has been made in recent years considering the scope of the challenge. For example, during a recent two-year period (2007–2008) only 407 new parasite species were described in the main journals publishing such papers (Journal of Parasitology, Systematic Parasitology, Acta Parasitologica Folia Parasitologica and Comparative Parasitology). It is unlikely that the current rate of description even keeps pace with the loss of parasite species diversity caused by host extinction events. It is difficult to reconcile the scope of this problem with reductions in professional systematic expertise (and support for biological collections) that seems pervasive in universities and other research institutions worldwide. Despite the extreme shortage of trained taxonomists for most groups of organisms, the skills of such scientists are needed to accomplish high priority research, including biodiversity assessment, restoration ecology and conservation biology (Meier, Reference Meier and Wheeler2008).
Based on the observation that traditional taxonomy for all organisms is in crisis, scientists worldwide have advocated for a ‘New Taxonomy’ (see Wheeler, Reference Wheeler2008) in an effort to promote modern approaches and perspectives for the discipline, and revitalize it by molecular techniques that have greatly advanced many other biological disciplines. The ‘DNA taxonomy’ (Tautz et al. Reference Tautz, Arctander, Minelli, Thomas and Volger2003) and ‘DNA barcoding’ (Hebert et al. Reference Hebert, Cywinska, Ball and deWaard2003) initiatives appear to have broken ground for the New Taxonomy approach. These approaches are resulting in an increased rate of species discovery, including cryptic species, in many taxonomic groups. Studies to date show that protists, arthropods, nematodes and most parasite groups examined appear to have many cryptic species (Baldwin et al. Reference Baldwin, Nadler, Freckman, Raven and Williams1999; Corliss et al. Reference Corliss, Raven and Williams1999), however, systematists are also discovering cryptic species in well-known groups of organisms such as vertebrates (e.g. Vieites et al. Reference Vieites, Walenberg, Andreone, Kölher, Glaw and Vences2009).
In parasitology, the concept of cryptic species traces to the use of molecular tools during the 1980s when such species were revealed using isoenzyme electrophoresis (Nadler, Reference Nadler1990; Andrews and Chilton, Reference Andrews and Chilton1999). No formal definition of cryptic species was proposed in these publications, but it was recognized that taxonomic identification of certain closely related species using morphological data might be problematical, whereas molecular data could reveal underlying hidden genetic differences that could then be used to delimit morphologically similar but genetically distinct (cryptic) species (see Andrews et al. Reference Andrews, Monis, Ey and Mayrhofer1998). Andrews and Chilton (Reference Andrews and Chilton1999) established a distinction between cryptic and sibling species when noting that one of the most important applications of multilocus enzyme electrophoresis was the detection of sibling species, particularly those that are genetically distinct but morphologically similar (hence ‘cryptic’). Later, Blouin (Reference Blouin2002) distinguished between molecular diagnostics, which uses DNA-based methods to demonstrate diagnosable genetic differences between species that are already established as different, and prospecting, where sequence data and a genetic distance yardstick are used deliberately to search for individual parasites that may represent cryptic species. Subsequently, the term “molecular prospecting” was coined (Criscione et al. Reference Criscione, Poulin and Blouin2005; Vilas et al. Reference Vilas, Criscione and Blouin2005) for the process of using DNA sequences to search for cryptic species of parasites. These formal terms describe different research activities and goals but a more common scenario in parasitology has been the chance discovery of genetically distinct but morphologically very similar species as a consequence of population genetic, phylogeographic or phylogenetic investigations of what was thought to be a single species. One outcome of such serendipity is that without a common conceptual and methodological framework, there is not only variation in procedures leading to the discovery of cryptic species, but also variation in what is recognized, such that the term has little uniformity of application (Pérez-Ponce de León and Nadler, Reference Pérez-Ponce de León and Nadler2010). This situation is not however unique to parasitology and it is worthwhile to consider different common applications of the term cryptic species, to evaluate whether usage should be more precise and to review the advantages and disadvantages of various approaches to delimit species in nature.
Herein we evaluate the use of molecular tools in the study of parasite systematics with a particular focus on cryptic species. We begin by considering the conceptual aspects of cryptic species in order to develop a fuller understanding of the implications that their discovery may have for systematic parasitology and related disciplines. We then consider the theoretical and practical problems of species delimitation in parasites and provide a current overview of the molecular tools that have been used to address taxonomic issues at the species level in several parasitic groups, with consideration of the number and kind of loci needed to delimit species from both a practical and theoretical standpoint. We focus on nucleotide sequencing approaches for cryptic species detection, because this is the most common molecular systematic practice. Different analytical approaches to discovering biodiversity (e.g. genetic divergence, phylogenetic analysis, phylogeography, population genetics) are discussed with reference to the wealth of literature that has been produced, particularly in the last two decades. In doing so, we review the historical background for the development of research programmes involved in discovering parasite biodiversity (including cryptic species). Using several examples, we end by discussing the implications of cryptic species for different aspects of parasitological research. We have focused this review on animal parasites, and emphasized examples from nematodes, cestodes and trematodes, reflecting our own research areas, however examples with other parasitic groups are also presented.
WHAT ARE CRYPTIC SPECIES?
As a simple definition, cryptic species are those that are difficult to recognize using traditional systematic methods (Knowlton, Reference Knowlton1986). Numerous non-morphological traits have been used to distinguish cryptic species (Mayr, Reference Mayr1963), such as karyology, reproductive isolation experiments, distribution patterns, resource use, life-history and development, mating behaviour and biochemical/molecular characters. However, the development of polymerase chain reaction (PCR)-based molecular methods was clearly of vital importance to the widespread use of DNA sequences for the discovery and documentation of cryptic species, particularly for small organisms.
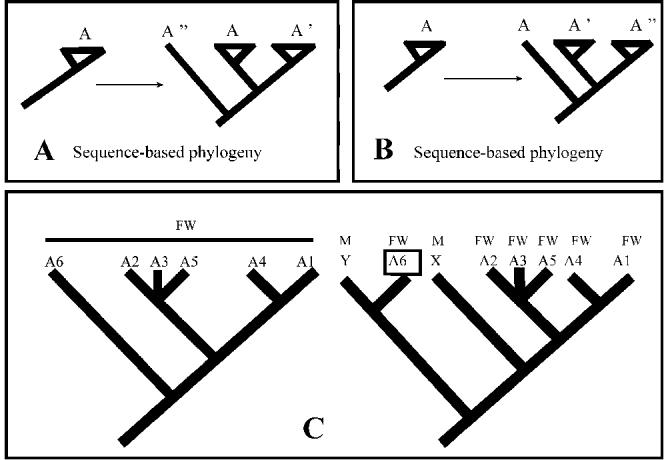
Ernst Mayr first used the term ‘sibling species’ as early as the middle of the 20th century to describe separate species that are difficult to recognize using traditional methods (Sáez and Lozano, Reference Sáez and Lozano2005). Initially, sibling species was the name given to sets of species that were difficult to distinguish with common morphological characters (Mayr, Reference Mayr1963). ‘Cryptic species’, when used in a taxonomic rather than in an ecological sense (i.e. ecologically cryptic includes camouflage and mimicry), is another term used for the same concept as sibling species, and some authors have used these terms interchangeably (Sáez and Lozano, Reference Sáez and Lozano2005). However, ‘sibling’ implies a particularly close phylogenetic relationship, technically meaning sister-species, whereas the term ‘cryptic’ does not directly address recency of common ancestry (Knowlton, Reference Knowlton1986). Taxonomic literature of the last 2 decades generally uses these 2 terms as synonyms; however, as shown in Fig. 1, a phylogenetic framework is necessary to determine if in any individual case these terms are synonymous. Under some evolutionary histories, ‘sibling’ and ‘cryptic’ species might be referring to the same phenomenon (Fig. 1A), but might not be synonyms in other cases (Fig. 1B). The term sibling species is expected to have many fewer opportunities for its precise application, if for no other reason than phylogenetic hypotheses are often unavailable for the study group. The term cryptic species is more general with much wider application, for example, when such species (even those in sympatry) are not closest relatives and have evolved the cryptic condition independently. In a recent review article, Bickford et al. (Reference Bickford, Lohman, Sodhi, Ng, Meier, Winker, Ingram and Das2007) defined both terms as follows: (1) cryptic species – two or more distinct species that are erroneously classified (and hidden) under one species name and (2) sibling species – cryptic sister species, or 2 species that are each other's closest relative and have not been distinguished from one another taxonomically. For Bickford et al. 2 or more species are cryptic if they are, or have been, classified as a single nominal species because they are at least superficially morphologically indistinguishable. Despite Henry's 1985 assertion that ‘sibling’ is etymologically preferable, Knowlton (Reference Knowlton1986) referred to all morphologically indistinguishable but different species as cryptic species, unless biochemical (molecular) data existed to show that they were sister species. To avoid potential misunderstanding, we suggest that cryptic species is the terminology of choice, whether or not newly discovered cryptic species share a most recent common ancestor, because even with a strongly supported phylogenetic hypothesis, incomplete species sampling may obscure true sister-species relationships (Fig. 1C).
Distinction between ‘sibling’ and ‘cryptic’ species. For panels A and B, bona fide species A is compared to potential species A’ and A” (all 3 taxa are morphologically indistinguishable). A. Given the phylogeny inferred from sequence data, sister species A and A’ are both cryptic and sibling species. B. Given this sequence-based phylogeny, A’ and A” are sister taxa and this clade is sister to species A. In this example, species A and A’ are cryptic but not sibling species, whereas species A’ and A” are both cryptic and sibling species. C. Interpretation of sibling and cryptic species is dependent on taxon sampling. Six morphologically indistinguishable species labeled A1–A6 inhabit freshwater hosts (FW), whereas species X and Y are from marine hosts. Without sampling marine hosts for these parasites, the inferred A1–A6 relationships (tree on left) could be construed as representing a freshwater cryptic species complex with sibling species (e.g. A4 plus A1). Additional taxon sampling of marine hosts (M) yields additional morphologically indistinguishable parasites (X and Y) and the molecular phylogenetic tree (on right). In this tree, species A6 does not share most recent common ancestry with A1–A5, and therefore A6 should be recognized as the sibling species of species Y. Additionally, parasites from freshwater or marine hosts do not form monophyletic groups. Sibling species status depends on interpretation of the phylogeny, which can be dependent on taxon sampling.

The modern view (New Taxonomy) of cryptic species discovery in nature as revealed by surveys of DNA variation was succinctly described by Sáez and Lozano (Reference Sáez and Lozano2005) as follows: “..a number of individuals belonging to a morphologically recognized species are sequenced (or otherwise genetically characterized), normally at several points (loci) within the genome. Then, often unexpectedly the various genotypes will cluster in reciprocally monophyletic groups, with no signs of genetic exchange between them”. By highlighting the importance of finding cryptic species in nature, Bickford et al. (Reference Bickford, Lohman, Sodhi, Ng, Meier, Winker, Ingram and Das2007) also emphasized that molecular data should be routinely incorporated in alpha taxonomic research, considering the frequency of cryptic species discovery with DNA sequence data. Other authors have emphasized the relevance and importance of morphology-based alpha taxonomy by suggesting that once discovered using molecular data, many so-called cryptic species can be identified through careful morphological examination, particularly when features not normally used for comparing species in the group are explored (Schlick-Steiner et al. Reference Schlick-Sateiner, Seifert, Stauffer, Christian, Crozier and Steiner2007).
There is no doubt that identifying independent evolutionary lineages (species) with sequence data can lead to a type of ‘reciprocal illumination’ (Hennig, Reference Hennig1966) wherein reexamination of specimens leads to identification of other features correlated with the species, including morphological characters (e.g. Nicolalde-Morejón et al. Reference Nicolalde-Morejón, Vergara-Silva, González-Astorga, Vovides and Espinosa de los2009). Molecular data provides a practical framework for partitioning specimens into groups such that previously confusing patterns of morphological variation may be resolved into diagnostic patterns. These molecular clades also provide a basis for greater investment in study of structure as revealed by SEM or other high-resolution methods (e.g. imaging by confocal microscopy). This raises the question of what constitutes ‘cryptic’, and cryptic species in the strict sense. For some authors (Knowlton, Reference Knowlton1986; Sáez and Lozano, Reference Sáez and Lozano2005) species initially determined to be cryptic ‘graduate’ to the category of ‘pseudo-cryptic species’ once diagnosable morphological characters are found. Recently, Pérez-Ponce de León and Nadler (Reference Pérez-Ponce de León and Nadler2010) suggested that cryptic species in the strict sense are always provisionally cryptic in that the possibility exists that additional morphological study or application of new techniques will reveal previously unknown diagnostic structural differences that permit rapid and practical morphological diagnosis. In the ideal circumstance, such discovery will result in a formal species description and morphological differential diagnosis, obviating the need for the category of pseudo-cryptic species. Of course there is no guarantee that the discovery of cryptic species through use of molecular data will be accompanied by the discovery of diagnostic morphological features for these same species, even if such morphological differences exist. This leads to the practical issue of describing the species in the absence of any morphological differential diagnosis, that is, diagnosing them based only on the known molecular differences. In such cases, the species remain provisionally cryptic because they cannot be diagnosed by morphological features, but instead must be diagnosed based on their distinguishing molecular characteristics. Implicit in our definition of cryptic species is that the term applies to morphologically indistinguishable species regardless that such species may be fully diagnosable based on molecular data.
A striking feature of the parasitological literature on hidden diversity is the variable usage of terminology including cryptic variation, cryptic speciation and cryptic diversity. For example, when considering malaria species infecting humans, some authors use ‘cryptic species’ for undetected species in mixed Plasmodium infections as diagnosed by microscopy, a situation that can be resolved using PCR methods to detect all 4 species commonly found in human infections (Mayxay et al. Reference Mayxay, Pukrittayakamee, Newton and White2004). Although detecting mixed infections has important epidemiological implications, this use of the term ‘cryptic’ is quite different from detecting previously unrecognized species. This example clearly shows how different applications of the same terms yields a potential for misunderstanding. Another common complication in parasitology research is when ‘cryptic species’ is applied to morphologically indistinguishable larval forms that show high genetic differentiation (e.g. Donald et al. Reference Donald, Kennedy, Poulin and Spencer2004, Reference Donald, Sijnja and Spencer2007; Miura et al. Reference Miura, Kuris, Torchin, Hechinger, Dunham and Chiba2005; Palm et al. Reference Palm, Damriyasa and Oka2008). Among anisakids and other nematodes, for example, it is not unusual for larvae (juveniles) of different species to be morphologically indistinguishable, even when the adult stages are morphologically distinct. Without evaluating the adult stages of such genetically distinct (but morphologically indistinguishable) larvae, there is no sound basis for characterizing the incompletely known taxa as cryptic species. Thus, as with certain other organisms, the presence of several different life history stages, some of which are more readily obtained, can complicate investigation and interpretation.
Even when considering more appropriate usage, the concept of cryptic species generally lacks a common conceptual and methodological framework within parasitology, and as a result, authors have recognized cryptic species of parasites using very different approaches (Pérez-Ponce de León and Nadler, Reference Pérez-Ponce de León and Nadler2010), including those that are specifically not taxonomic. In some cases, the results may only suggest that unknown species are present (e.g. ‘molecular prospecting’), and confirmation requires additional research such as sequencing additional loci and appropriate analyses (corroboration of lineage independence) in conjunction with suitable morphological studies to differentiate between cryptic species and those that are morphologically distinct but inadequately studied. Although this situation is not unique to parasitology, it is advantageous to standardize the terminology and methodology for recognizing cryptic species of parasites in nature, so that parasitologists will share precise meaning when such species are discovered and referenced. Standardized approaches will facilitate inferences into the mechanisms responsible for the origin of these species, and lead to better estimates of parasite species richness. This necessity, however, poses several challenges for parasite systematics. Like many other disciplines, ours suffers from a shortage of well-trained taxonomists relative to the scope of the work remaining to be done. In addition, the phylogenetic and biological diversity of animal parasites, from protists to complex multicellular organisms, makes it more difficult to describe parasite diversity within a common framework. Furthermore, parasite taxonomists must accept that our species descriptions will benefit from meeting expectations of the New Taxonomy by being integrative, merging traditional morphological approaches with contemporary technologies (e.g. virtual access to specimens and DNA sequences via the internet, Knapp, Reference Knapp and Wheeler2008); this framework can integrate conceptual and recent methodological developments to illuminate the origins, boundaries and evolution of species (Padial et al. Reference Padial, Miralles, De la Riva and Vences2010). Providing an accessible inventory of parasitic organisms in a modern context is challenging in an age with too little monetary support for collections and systematic research, even when the importance of biodiversity, museums and curated collections has been widely demonstrated and acknowledged (see Hoberg, Reference Hoberg2002; Hoberg et al. Reference Hoberg, Pilitt and Galbreath2009). Perhaps more widespread prospecting for and delimiting of cryptic species will substantially alter our understanding of parasite biodiversity, leading to acceptance that parasite systematists must be well-versed in both morphological and molecular methodologies, thus integrating these different approaches under one conceptual framework while increasing the funding priorities for this research.
THEORY AND PRACTICE OF DELIMITING SPECIES
Criscione et al. (Reference Criscione, Poulin and Blouin2005) summarized three key uses of molecular markers in parasite species identification. First, linking morphologically indistinguishable life stages such as larvae to the adult stages of known species; such studies are important for understanding disease transmission and establishing clinical diagnostics. Second, to elucidate life cycles by establishing the species that may serve as intermediate or paratenic hosts for larval stages of a parasite, i.e. using species-specific genetic markers to find and track intermediate and definitive hosts within natural ecosystems. Finally, the use molecular markers can be used in the search for cryptic species (cryptic species prospecting).
Molecular tools offer an unprecedented opportunity to include new components in our discovery and description of parasite biodiversity, for example, characterization of genetic variability, population genetic structure, genetic differentiation and phylogenetic relationships. Several major reviews have been published on molecular approaches to studying parasite population genetics and phylogeny (Nadler, Reference Nadler1990, Reference Nadler1995; Tibayrenc, Reference Tibayrenc1995; McManus and Bowles, Reference McManus and Bowles1996; Anderson et al. Reference Anderson, Blouin and Beech1998). From a microevolutionary perspective, different evolutionary mechanisms are often invoked in an attempt to explain distinct patterns of genetic differentiation among parasite taxa. A common explanation for geographically partitioned differentiation is the interruption of gene flow among populations as a result of events such as vicariance or dispersal. Parasite taxa may also show genetic differentiation in sympatry, suggesting that gene flow was either interrupted in sympatry, or that the sympatry is secondary (following cessation of gene flow in allopatry). In this way, population genetic (microevolutionary) studies often operate at the interface between quantifying gene flow within species and finding evidence for the absence of gene flow between taxa (i.e. evidence of biological species).
With ‘species prospecting’ using molecular tools (sensu Blouin, Reference Blouin2002), it is relatively commonplace to find evidence of genetic differentiation among parasite individuals that would appear to be morphologically identical. In some cases, these preliminary findings are taken as prima facie evidence of cryptic species, whereas other investigators take this first evidence as demonstrating the need for additional data and analysis (e.g. more loci and individuals; more detailed morphological study) to fully test the hypothesis of cryptic species. There are, however some cases where the opposite occurs, i.e. what are thought to be cryptic species turn out to represent one widespread species. For example, Koehler et al. (Reference Koehler, Hoberg, Dokuchaev and Cook2007) reported that the nematode Soboliphyme baturini represents a single species with a broad geographic range across Beringia and northwestern North America, based on assessment of molecular sequence data, refuting the hypothesis that several cryptic species were partitioned either among different mustelid definitive hosts or across the vast region that links North America and Eurasia. In other cases, two apparently separate species (based on morphological criteria), have been found to be genetically undifferentiated, leading to synonymy (e.g. Stevenson et al. Reference Stevenson, Gasser and Chilton1996; Dallas et al. Reference Dallas, Irvine and Halvorsen2000; Desdevises et al. Reference Desdevises, Jovelin, Jousson and Morand2000; Bell and Summerville, Reference Bell and Sommerville2002; Li and Liao, Reference Li and Liao2003). This documentation of parasite phenotypic plasticity (e.g. host-induced morphological change) is another value-added outcome of using molecular tools that can lead to improved understanding of biodiversity (León-Règagnon et al. Reference León-Règagnon, Guillén-Hernández and Arizmendi-Espinosa2005).
The vast majority of parasite species (particularly macroparasites) are described solely on adult morphology and with reference to their final host and known geographic distributions. Practitioners of parasite taxonomy are rarely explicit about their view of what species are, or how data are being used to delimit species (finding them in nature) prior to their formal description (Nadler, Reference Nadler2002). The advent of molecular systematics brought new characters for finding parasite species in nature, addressing concerns that morphology alone may be insufficient to identify unequivocally all species and providing the advantages of DNA for studying parasite systematics and evolution (Nadler, Reference Nadler1990; McManus and Bowles, Reference McManus and Bowles1996). For parasitic organisms, particularly those infecting humans, correct identification is crucial to understanding epidemiology, designing control programmes, effective drug treatment and prophylaxis and investigating the potential for gene flow of drug resistance genes among populations (Nadler, Reference Nadler1995; Criscione et al. Reference Criscione, Poulin and Blouin2005). For example, knowledge of which individuals to include in a population-level analysis is required to estimate genetic structure accurately; accidental inclusion of cryptic species will inflate estimates of intraspecific genetic differentiation and potentially reveal erroneous estimates of structure that results from the differential distribution of the species (or confounding effects of sampling species) rather than different historical patterns of gene flow within a species.
The molecular assessment of parasite biodiversity, including testing for cryptic species, is a largely unexplored opportunity for parasitologists. Deciding what species are and how to find them in nature (species delimitation) are prerequisite to characterizing this biodiversity (Adams, Reference Adams1998; Nadler, Reference Nadler2002); these topics merit careful consideration when studying parasite biodiversity. In addition, although the testing process for assessment of cryptic species is driven by molecular data, most theoretical aspects of this process are independent of the kinds of data employed, and this hypothesis-testing framework for delimitation should be considered apart from specific caveats inherent in different types of data. Adams (Reference Adams1998) discussed three types of predictive systematic errors that impact on the application of different species concepts in evaluating the status of taxa as species. Type I errors occur when more species than actually exist are predicted; type II errors occur when fewer species are predicted than exist; type III errors involve inaccurate depiction of historical relationships among taxa. The Linnean or typological morphological species concept, which groups individual organisms with the most overall similarity as members of the same species (Mayr, Reference Mayr1963), is the concept that has been most frequently used by parasitologists. Overall similarity in the Linnean concept is determined based on all characters, regardless of whether they are ancestral or derived (and in some cases, homologous or not), and thus it is phenetic in approach. The presence of cryptic species will lead to type II errors for the Linnean approach because underlying different evolutionary histories of cryptic species will be masked by their overall similarity. Similarly, with its emphasis on phenetics, the Linnean concept is also prone to type III errors involving problems of tree reconstruction. In contrast, Adams (Reference Adams1998) showed that delimitation methods grounded in evolutionary or phylogenetic approaches are advantageous for reducing potential bias in assessments of biodiversity, including the recognition of cryptic species (reducing type II errors). The main underlying assumptions of lineage-based evolutionary approaches are that species are monophyletic and that speciation results from cladogenesis. Investigating species using evolutionary tree-based methods involves testing the null hypothesis of a single species (Adams, Reference Adams1998, Reference Adams2002; Wheeler, Reference Wheeler1999; Nadler, Reference Nadler2002); the null hypothesis is rejected when the individuals sampled and analysed constitute more than one reciprocally monophyletic group. Reciprocally monophyletic clades representing different species may be separated by moderate-to-high levels of sequence divergence but there is no requirement that this be the case, and relatively few congruent derived character states defining each lineage can yield support for reciprocal monophyly. A potential disadvantage of evolutionary or phylogenetic species concepts is that they are more prone to type I errors if, for example, intraspecific genetic lineages are misidentified as evidence of historically independent species lineages (Nadler, Reference Nadler2002). This potential caveat emphasizes the need for assessing concordance among lineages representing independent gene loci when delimiting species (Nadler, Reference Nadler2002).
Debates about species concepts and how to best define them (describe what species are) have occupied a tremendous volume of scientific and philosophical literature (e.g. Mayden, Reference Mayden, Claridge, Dawah and Wilson1997; Wheeler and Meier, Reference Wheeler and Meier2000 and references therein), but these debates have not yet changed how most systematists go about deciding that a taxon is a new species. As for most other organisms, parasite species delimitation has typically involved an individual taxonomist deciding that a particular taxon is ‘different enough’ from other described species, based on the available data (morphological or molecular), to merit separate species status. This traditional process does not usually involve formal hypothesis testing as part of the decision-making process (Adams, Reference Adams1998; Nadler et al. Reference Nadler, Adams, Lyons, DeLong and Melin2000). Rather, traditional species description reflects acceptance of the experience, knowledge and ‘artistry’ of the taxonomist in making decisions about which taxa are different enough to merit recognition as species. Molecular systematists have often used their data in the same way, deciding that a particular taxon (such as a putative cryptic species) is ‘different enough’ in molecular divergence from other known congeners to merit separate species status (Hung et al. Reference Hung, Chilton, Beveridge, McDonnell, Lichtenfels and Gasser1997, Reference Hung, Chilton, Beveridge, Zhu, Lichtenfels and Gasser1999; Romstad et al. Reference Romstad, Gasser, Nansen, Polderman and Chilton1998; Zhu et al. Reference Zhu, Gasser, Chilton and Jacobs2001).
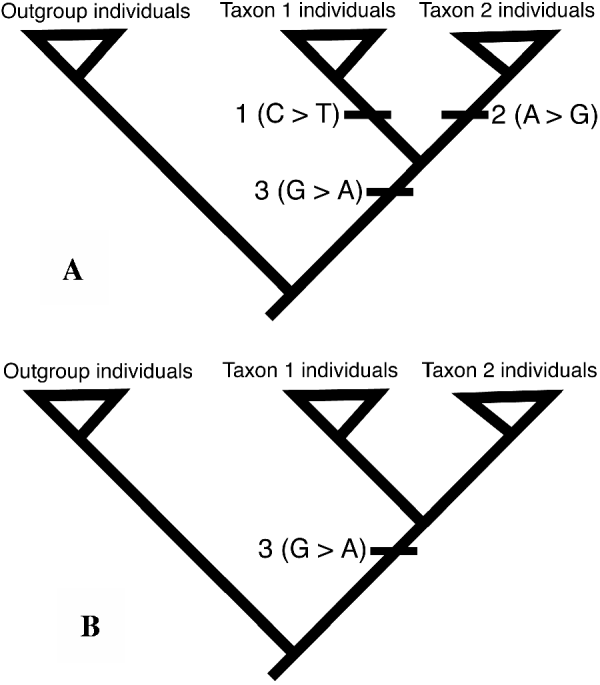
Although species delimited by this traditional process may be valid, this subjective approach (how much is ‘different enough’?) lacks the framework of formal hypothesis testing characteristic of most science. Of course, when the taxa being compared are very different at the morphological and/or molecular level, subjective and formal hypothesis-testing methods are both likely to find that they are separate species. However, full characterization of parasite biodiversity requires finding all species, including for example those that have formed relatively recently and therefore may have minimal levels of genetic and morphological divergence. It should also be recognized that two different species might have no morphological divergence, either because the speciation event is very recent (and structural changes have not yet evolved), or conversely due to morphological stasis over long periods of evolutionary time, such as is known for ‘living fossil’ species. It is this requirement to discover these valid but very similar species in an unbiased fashion that necessitates replacing subjective approaches with species discovery operations that evaluate data by hypothesis-testing and operational procedures, including explicitly evolutionary methods (Fig. 2) such as phylogenetic species delimitation (Adams, Reference Adams1998; Wheeler, Reference Wheeler1999; Nadler, Reference Nadler2002; Sites and Marshall, Reference Sites and Marshall2003). In addition to these evolutionary approaches to discovering species based on evidence of historical lineage independence, non-tree based methods are available that make use of population genetic data, such as Hardy-Weinberg equilibrium expectations and estimates of population genetic structure (Porter, Reference Porter1990; Good and Wake, Reference Good and Wake1992; Doyle, Reference Doyle1995). These applications of molecular data, which are focused on characterization of individuals, can be used to test (falsify) the hypothesis of genetic panmixia for individuals sampled from a sympatric distribution, potentially revealing reproductively isolated or biological species.
Testing hypotheses of species using nucleotide sequence data and evolutionary analysis of individuals. Greater-than symbol indicates direction of character-state change (e.g. character 1 from C to T). A. Evidence of lineage exclusivity for individuals of taxon 1 and taxon 2. Individuals of taxon 1 have a fixed autapomorphy (derived character state, character 1), and individuals of taxon 2 are defined as an exclusive group by the autapomorphy of character 2. Another character (character 3) provides evidence of phylogenetic relationship between these 2 species. Based on phylogenetic analysis, individuals of taxon 1 and taxon 2 are delimited as separate species based on fixed derived states of characters 1 and 2, respectively. B. Lack of evidence of lineage exclusivity. In this hypothetical example, the sequenced regions are identical for individuals of taxon 1 and taxon 2. Thus, these data provide no evidence for lineage exclusivity for individuals of these taxa. However, phylogenetic analysis does show a derived state (character 3) for all of the ingroup individuals. These data are consistent with failure to falsify the null hypothesis of a single species (i.e., individuals of taxon 1 and taxon 2 belong to the same species). Figure modified from Nadler (Reference Nadler2002).

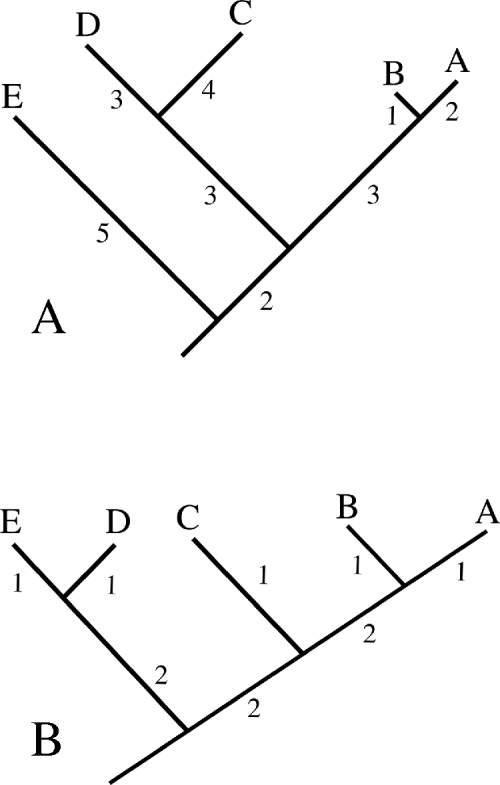
Several recent publications using molecular tools to find and delimit cryptic species of parasites have used pair-wise distance data or a ‘genetic yardstick’ to evaluate if the putative taxa are ‘different enough’ to merit recognition as separate species (e.g. Krone et al. Reference Krone, Friedrich and Honisch2007; Miranda et al. Reference Miranda, Tennessen, Blouin and Rabelo2008; St-Onge et al. Reference St-Onge, LaRue and Charpentier2008). The genetic distance between two putative species is compared to values obtained from comparison of other available ‘benchmark’ species (typically congeners), and if the test taxa meet or exceed the benchmark threshold, then they are considered to be distinct species. The underlying basis for this approach rests on the assumption that there is a certain minimum distance threshold, that when exceeded means the taxa must be distinct biological species. Employing pair-wise distance thresholds for initial cryptic species prospecting (are cryptic species likely present?) appears reasonable because high levels of divergence are unlikely to occur among individuals of a single species (Blouin, Reference Blouin2002; Vilas et al. Reference Vilas, Criscione and Blouin2005). However, this exploratory approach is problematic for species delimitation because critical assumptions implicit in these benchmark comparisons may be violated. One of the more problematic underlying assumptions of the ‘genetic yardstick’ is that the genes used are accumulating changes at roughly equal rates among different evolutionary lineages. This assumption is needed because heterogeneity in molecular substitution rates among lineages will confound comparing values of pair-wise genetic distance, because increased relative-rates of change (nucleotide substitution) in some lineages will increase all pair-wise distances involving those taxa (Fig. 3A). Thus, variation in the relative-rate of molecular evolution among lineages potentially compromises establishing and interpreting any minimum distance threshold for species.
Pitfalls of using distance approaches for species delimitation. A. Hypothetical phylogeny with branch lengths depicting unequal rates of sequence evolution. The number of substitutions (and pairwise distance) between sister-taxa is different as a result of rate heterogeneity (i.e. 7 substitutions between D and C, versus 3 between A and B). Such rate variation will confound attempts to use a distance-based approach or ‘genetic yardstick’ to delimit species. B. Hypothetical phylogeny without rate heterogeneity. Pairwise distances between species reflect recency of common ancestry. Ideally, sister-species (e.g. A and B; D and E) would be used to estimate the minimum amount of genetic differentiation characteristic of species. In the absence of a phylogeny, pairwise comparisons of sequences for available species (e.g. distance between C and D=6 substitutions) may overestimate the minimum amount of differentiation characteristic of species, even if there is no sequence rate heterogeneity. Figure modified from Nadler (Reference Nadler2002).

Another serious problem involves calibrating the minimum threshold of distance characteristic of interspecific comparisons (Fig. 3B). There is no universal similarity ‘cut-off’ characteristic of the interspecific level due to overlap of inter- and intra-specific distances among different lineages (Goldstein et al. Reference Goldstein, DeSalle, Amato and Vogler2000). Instead, several sister-species pairs would need to be used to determine the minimum level of genetic distance characteristic of species for that particular clade. Unfortunately, genetic yardsticks are typically applied without benefit of phylogenetic information (or data for sister species), and the benchmark calculations involve available congeners (often what has been deposited in GenBank). Genetic distance values obtained from comparison of available species are unlikely to be characteristic of a minimum threshold between species, and perhaps at best may represent an average similarity value between members of that particular genus. Even with no confounding effects of rate heterogeneity, such a benchmark distance may have little relationship to the true minimum level between species for that clade.
Another recent molecular systematic approach, DNA barcoding, also typically employs a distance-based approach for species identification and discovery, although nothing inherent in barcoding per se precludes character-based analysis (DeSalle et al. Reference DeSalle, Egan and Siddal2005). DNA barcoding is based on sequencing the same gene region (typically ∼650 bp of the mitochondrial COI gene) among taxa as a standard basis for comparison. Barcoding data have been used for two separate tasks. One task is to distinguish between known species (species diagnosis or identification with DNA), and the second is to discover new species. Some advocates of DNA barcoding have suggested that the second task is equivalent to species delimitation, however, the two barcoding tasks differ greatly in the type and amount of data required (DeSalle et al. Reference DeSalle, Egan and Siddal2005), and it is more appropriate to regard the species discovery aspects of DNA barcoding as molecular prospecting rather than definitive species delimitation. For distance-based analyses, the success of DNA barcoding in fulfilling these two tasks is dependent on the assumption of a ‘barcoding gap’, essentially that interspecific variation of the sequenced gene exceeds intraspecific variation by at least one order of magnitude (Hebert et al. Reference Hebert, Cywinska, Ball and deWaard2003, Reference Hebert, Stoeckle, Zemlak and Francis2004). Recently however, Wiemers and Fiedler (Reference Wiemers and Fiedler2007) demonstrated that for certain Lepidoptera, a ‘barcoding gap’ artifact results from insufficient sampling across taxa; as a result, these authors advocate using barcodes in combination with other data (such as other loci) to avoid species misidentification. Wiemers and Fiedler (Reference Wiemers and Fiedler2007) also noted that although large differences in DNA barcode sequence can reveal cryptic species, a significant fraction of morphologically well-differentiated lepidopteran species had highly similar or even identical COI sequences and such species would be missed through exclusive use of DNA barcoding based on a single locus. Comparative studies of known parasite morphospecies with barcoding results are few. Ferri et al. (Reference Ferri, Barbuto, Bain, Galimberti, Shigehiko, Guerrero, Ferté, Bandi, Martin and Casiraghi2009) showed that COI sequences from filarioid nematodes recovered 44 of 46 species; 2 morphospecies (genera Onchocerca and Cercopithifilaria) did not meet the calculated COI threshold (barcoding gap). There is little doubt that comparative analysis of DNA sequences of parasites (barcoding of COI or other standardized genes, as appropriate) will be of utility for diagnostics and molecular prospecting for parasite biodiversity. In terms of explanatory power, single locus DNA barcodes and the ‘barcoding gap’ are insufficient approaches to delimit species, and concordance of independent information, including other genes, is required. As noted by Wheeler et al. (Reference Wheeler, Raven and Wilson2004, p. 285), “Fashionable DNA bar-coding methods are a breakthrough for identification, but they will not supplant the need to formulate and rigorously test species hypotheses.”
The empirical application of DNA barcoding to questions in parasite systematics is quite recent, and molecular prospecting with barcodes are few. Investigating Gyrodactylus (Monogenea), Hansen et al. (Reference Hansen, Bakke and Bachmann2007) reported that COI mtDNA sequences revealed substantial diversity within this genus of ectoparasites. More specifically, barcoding of G. salaris and G. thymalli revealed 44 haplotypes that grouped into 15 clades (haplogroups) that often reflected fish host species. However, the two Gyrodactylus species were not reciprocally monophyletic according to COI sequences (Hansen et al. Reference Hansen, Bakke and Bachmann2007) and the clades did not reflect parasite virulence. Given that other genes examined between G. salaris and G. thymalli populations (e.g. ITS rDNA) show little or no divergence (Zietara and Lumme, Reference Zietara and Lumme2002), the mitochondrial gene tree remains uncorroborated, and it is unclear if the mtDNA clades reflect intraspecific haplotype variation, or reflect independent historical lineages that should be recognized as species (Hansen et al. Reference Hansen, Bakke and Bachmann2007). More recently, Moszczynska et al. (Reference Moszczynska, Locke, McLaughlin, Marcogliese and Crease2009) developed COI PCR primers specific for Diplostomatidae (Trematoda) and reported that these sequences are useful for species-level identification of larval stages and to screen samples for cryptic species which are believed to be present in Diplostomum. These authors noted the advantages of molecular approaches, including barcoding for species identification of digeneans, which are often encountered as larval stages that can often only be identified to genus. Applying these trematode barcoding primers and internal transcribed spacer (rDNA) primers, Locke et al. (Reference Locke, Mclaughlin and Marcogliese2010) compared some COI barcodes with results from the ITS gene (nuclear locus) and uncovered evidence of previously unknown diplostomoid diversity, finding evidence of 47 species in fish collected from the St. Lawrence River. In these metacercarial infections, ‘sibling species’ were discovered from the same tissues of fish hosts, whereas certain other species appeared to be widespread geographically, for example, occurring in both North America and Europe (Locke et al. Reference Locke, Mclaughlin and Marcogliese2010).
Evolutionary approaches to delimiting species are receiving increasing application for parasites (e.g. Littlewood et al. Reference Littlewood, Rohde and Clough1997; Adams, Reference Adams1998; Nadler et al. Reference Nadler, Adams, Lyons, DeLong and Melin2000; Nadler, Reference Nadler2002, Johnson et al. Reference Johnson, Reed, Parker, Kim and Clayton2007; Leung et al. Reference Leung, Keeney and Poulin2009; Malenke et al. Reference Malenke, Johnson and Clayton2009), and results to date have been promising. For example, phylogenetic analysis of nuclear and mitochondrial gene sequences among Uncinaria hookworms from California sea lions and northern fur seals yields strong evidence of separate species from these hosts; this is based on three autapomorphies that define the northern fur seal hookworm clade and 6 autapomorphies for the California sea lion hookworm clade (Nadler, Reference Nadler2002). The strict requirement for evidence of reciprocal monophyly to delimit species is more stringent than certain other evolutionary concepts advocated by some investigators (Nixon and Wheeler, Reference Nixon and Wheeler1990; Wheeler, Reference Wheeler1999). For molecular sequence data, testing hypotheses of species can be performed using evolutionary tree inference methods such as maximum parsimony, maximum likelihood and Bayesian inference. These methods are based on analysis of character-state data, which has the advantage of revealing the particular changes in states supporting individual species. In addition, character-state data (e.g. aligned nucleotide sequences) are amenable to analysis using inference methods employing more complex, and presumably realistic, substitution models. It is unfortunate that many studies comparing the genetic divergence of parasite species and evaluating their ‘species status’ have used distance-based approaches (and often distances uncorrected for multiple substitutions) to produce phenograms of average pairwise similarity. Trees inferred by such methods depend upon unrealistic evolutionary assumptions (e.g. equal rates of evolution among lineages), and average distances represented in such phenograms can be misleading in comparison to pairwise distances between taxa.
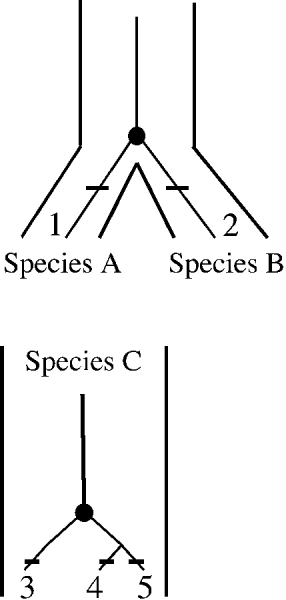
Every tree inference method has different explicit or implicit assumptions (Felsenstein, Reference Felsenstein1988, Reference Felsenstein2004) and it is well known that different methods may recover different groups, particularly when the data have low resolving power (poor phylogenetic signal) or when underlying assumptions of a particular inference method is violated. This suggests that a conservative approach to tree-based delimitation will benefit from assessments of clade reliability. Ideally, the monophyletic groups defined as species using evolutionary approaches would be insensitive to choice of inference method, but this is unlikely for most real datasets. Thus, to avoid the potential for subjectivity, investigators should be consistent and justify their choice of inference method and other parameters, such as the substitution model. The latter can be selected from a larger group of available models by using a programme to choose the best-fit substitution model and parameters for a dataset. Additional potential pitfalls of tree-based methods include circumstances that compromise the interpretation of phylogenetic trees inferred from a single gene locus as tests of lineage independence (Nadler, Reference Nadler2002). Among the most important of these is the potential for lineage sorting artifacts for genes (Nichols, Reference Nichols2001). Phylogenetic evidence of lineage independence must also be distinguished from reticulate or tokogenetic lineages within species, for example, the transmission of mitochondrial haplotypes among individuals within populations (Adams, Reference Adams1998; Nadler, Reference Nadler2002). With insufficient sampling of individuals or genetic loci, tokogenetic relationships could be mistaken for historical patterns of species, with trees grouping individuals based on shared intraspecific polymorphisms (Fig. 4). It is difficult to make recommendations concerning the number of individuals to sample from each presumptive species, but it is clear that adequate sampling is required to identify molecular characters that are uniquely shared among all individuals of a species. An analysis of published data by Poulin (Reference Poulin2010) showed that for helminths, the number of individuals sequenced was the best predictor for the number of cryptic species discovered. Generally, morphological investigations of parasites are eventually extended (if not originally in the description) to comparisons of individuals across a broad geographic range of their hosts. Similarly, for molecular data, distinguishing variation within species from variation partitioned among species is key, whether analysis is focused on genetic distances or characters in delimiting species and finding diagnosable features. Studies using one or few individuals may not be representative of species, particularly for those with wide geographic distributions, as has been shown for other organisms (Davis and Nixon, Reference Davis and Nixon1992; Goldstein et al. Reference Goldstein, DeSalle, Amato and Vogler2000). Strategies for estimating the number of individuals required for assessment of within-species genetic variation depend upon factors that, with the exception of life histories, are often poorly known for parasite species, such as dispersal ability, mating patterns, geographic range and features that are likely to influence the genetic structure of populations. In most cases designing a sampling strategy in advance will remain difficult, and exploratory sampling studies will be required to assess intraspecific variation.
Gene trees as evidence of species? Species A and species B contain the gene tree (marked with a circle) for a hypothetical locus. In this ideal case, each species contains a unique gene lineage (lineage 1 and 2, respectively), and each lineage is characterized by an autapomorphy (bars), providing evidence of lineage exclusivity for individuals of each species. In the second hypothetical example (species C), variation within a species is also diagnosed based on derived sequence characters (apomorphies). Three different apomorphy-defined gene lineages (3–5) have been recovered for this locus (as might occur for haplotypes of mitochondrial-DNA) within species C. When genetic data are used to test hypotheses of species, investigators recover gene trees, but lack information about how many species these genetic lineages come from. This hypothetical example shows how evolutionary lineages from a single locus might be misleading for delimiting species. Figure modified from Nadler (Reference Nadler2002).

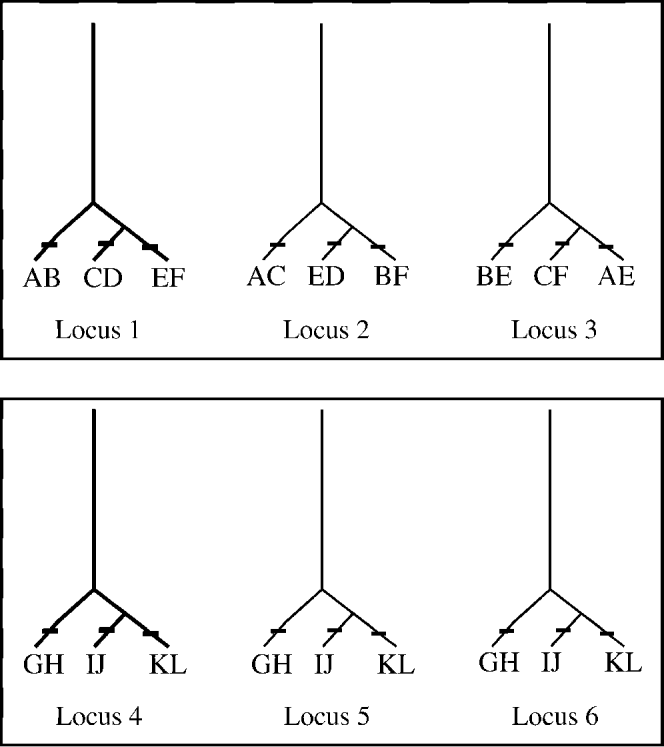
Different patterns of lineage sorting for different loci could also lead to incongruence between trees (for sampled individuals) (Nichols, Reference Nichols2001) such that concordant patterns of exclusive lineages would not be evident, even if separate species exist. This potential incongruence between gene and species trees argues for using more than a single locus for delimiting species whenever possible (Fig. 5). When investigators are presented with patterns of tree incongruence between loci (e.g. comparing trees inferred from mtDNA and nuclear ribosomal DNA), resolving the incongruence for the purpose of delimiting species would require sampling additional loci, with the number of loci needed relating to application of concordance principles (Avise, Reference Avise2000) for testing patterns of common cause (i.e. speciation). It is possible that for recent speciation events, a large number of loci would be required to resolve the underlying pattern. However, as more independent loci (and not simply more genes from a single locus, such as nuclear ribosomal SSU, LSU and ITS sequences) yield a concordant pattern of reciprocal monophyly, the stronger the inference that the pattern results from speciation. However, even when few independent loci reveal concordant patterns of lineage exclusivity (e.g. define the same individuals as members of reciprocally monophyletic groups), this constitutes a reasonable working hypothesis that the pattern reflects the underlying common cause of speciation and is clearly preferred to topological results based on a single locus. In the absence of a statistically significant discordance between datasets for different loci (e.g. incongruence length difference test, Farris et al. Reference Farris, Källersjö, Kluge and Bult1994), combined analysis of all sequence data is warranted for delimitation and should provide the best estimate of the clade support for delimitation and relationships among the species. In addition to appropriately delimiting parasite species with molecular data (e.g. reciprocal monophyly recovered using multiple loci), other sources of information need to be integrated into the comparative assessment, including morphometrics, host relationships, geographic distributions and a thorough examination for morphological differences that may be correlated with the monophyletic groups. As Nolan and Cribb (Reference Nolan and Cribb2005) noted, if characterization of a parasite species is exclusively genetic, more research is warranted to explore the morphology and biology of the newly discovered species. However, if cryptic species are thoroughly investigated and the sole delimiting characters are molecular, such data, if robust, are sufficient for recognition of separate species.
Gene trees and concordance principles for species delimitation. If a single locus can provide misleading patterns relative to species delimitation, what perspective can multiple loci provide? In this hypothetical example, individual organisms are characterized for three separate loci. For individuals A–F (top panel), the evolutionary lineages inferred for each locus provide no evidence of concordant patterns across loci (i.e. grouping of individuals differ among loci), indicating that the gene tree topologies do not reflect one underlying common cause (e.g. speciation). For individuals G–L (bottom), evolutionary lineages for all three loci group individuals identically. This corroboration across multiple loci is consistent with an underlying common cause of speciation, such that the three groups of individuals (G+H, I+J, and K+L) forming distinct lineages can be delimited as three separate species. Figure modified from Nadler (Reference Nadler2002).

CRYPTIC SPECIES DELIMITATION: ALTERNATIVES TO SEQUENCING-BASED MOLECULAR METHODS
During the last 25 years and prior to the frequent application of nucleotide sequences, a variety of other types of molecular data were used for parasite molecular systematics, including multilocus enzyme electrophoresis (and its more restrictive variant, allozyme electrophoresis), RAPDs, RFLPs, SSCPs, microsatellites and AFLPs. These techniques have genetic applications beyond systematics and only some are particularly well suited for detecting cryptic species. Certain of these methods are known to lack reproducibility (i.e. RAPDs) or require significant development and investment for each species that they are applied to (microsatellites). The utility of different methods also depends upon the design of the original study and the accompanying data analysis. For example, polymorphic allozyme loci are useful for cryptic species prospecting and delimitation from a population genetics approach (Andrews and Chilton, Reference Andrews and Chilton1999). Polymorphic loci showing departures from Hardy-Weinberg equilibrium (e.g. a deficiency of heterozygotes) for sympatric population samples or indirect estimates of gene flow showing significant structure are results that can falsify the null hypothesis of a single species. Discontinuities in allele frequencies for multiple loci in sympatric parasite taxa is also indicative of a lack of current gene flow, although natural selection can maintain such patterns under certain circumstances (Nadler, Reference Nadler1995). Unfortunately, allozyme data are not as well suited to the types of phylogenetic analysis required for tree-based species delimitation because data from multilocus electrophoresis are better suited for distance-based tree construction due to complications of coding allele presence and frequencies for character-based tree inference. More importantly, although each separate electrophoretic locus is independent (barring linkage disequalibria), each allozyme locus does not normally yield a separate estimate of phylogenetic relationships, so that patterns of concordance or discordance between loci cannot be compared.
Several long-standing molecular methods represent less precise tools for resolving small amounts of genetic differences between very closely related species, as predicted for many cryptic species. For example, the number of sequence sites evaluated by RFLP analysis depends on the number of restriction enzymes used and the DNA coverage of their cutting recognition sites (e.g. varying between 4–8 nucleotides). Similarly, multilocus enzyme electrophoresis fails to reveal substantial underlying genetic variation, because only differences that change protein net charge (due to replacements of acidic and basic amino acids) and some that affect protein conformation alter electrophoretic mobility (Nadler, Reference Nadler1990; Andrews and Chilton, Reference Andrews and Chilton1999). The requirements for detecting cryptic species (and for documenting biodiversity) necessitate the highest potential sensitivity for finding genetic differences among specimens. Many parasites are relatively small, and this effectively restricts the range of methods that can yield molecular data from individual (non-culturable) specimens, as is required for examination of cryptic species in most instances. Given both theoretical and practical considerations discussed in detail elsewhere (Adams, Reference Adams1998, Reference Adams2002; Nadler, Reference Nadler2002), robustly testing hypotheses of species with tree-based methods for the most closely related cryptic taxa may require datasets of moderate-to-large size and several genetic loci, combined with population-level sampling. In theory, other approaches that effectively detect differences in sequence indirectly (e.g. SSCP or Single-Strand Conformational Polymorphism) can also play an important role in screening large numbers of individuals in prospecting for cryptic species. However, rapid advances in sequencing technology and reductions in cost per sample are likely to replace such indirect methods.
Bullini et al. (Reference Bullini, Nascetti, Ciafre, Rumore, Biocca, Montalenti and Rita1978) were the first to apply molecular data to document cryptic species of parasites; they used isoenzyme methods to distinguish Parascaris equorum and P. univalens (these species were also distinguished by karyotype). This was soon followed by studies focused on long-standing questions concerning the species status of host-associated nematodes such as the intestinal human and pig roundworms, Ascaris lumbricoides and A. suum (e.g. Nascetti et al. Reference Nascetti, Grappelli, Bullini and Montalenti1979). At this time, parasite molecular systematics was primarily based on native (undenatured) protein electrophoresis and specific enzymatic staining (mainly allozyme electrophoresis), which had already been established for use in studies of human genetic variation and characterization of other animal populations, including Drosophila spp. (Lewontin and Hubby, Reference Lewontin and Hubby1966). Characterization of parasites by allozyme electrophoresis at multiple loci permitted investigators to determine if taxa (such as parasites associated with different hosts) were fixed for different alleles or showed population genetic parameters consistent with lack of interbreeding. During the decade of the 1980s, a few papers were published where morphologically similar species of parasites were distinguished using allozyme electrophoresis and as a result of this research were first recognized as distinct genetic groups (Baverstock et al. Reference Baverstock, Adams and Beveridge1985) or were considered as ‘sibling’ species (Nascetti et al. Reference Nascetti, Paggi, Orecchia, Smith, Mattiucci and Bullini1986; Orecchia et al. Reference Orecchia, Paggi, Mattiucci, Smith, Nascetti and Bullini1986; Nadler, Reference Nadler1987a). Baverstock et al. (Reference Baverstock, Adams and Beveridge1985) were among the first investigators to apply molecular systematics to investigate a moderately large sample of parasites, documenting extensive electrophoretic diversity for the anoplocephalid cestode Progamotaenia festiva, and recognizing that different genetic forms occurring in allopatry were also likely different species, although the terms ‘sibling’ or ‘cryptic’ species were not used by these authors.
Although various applications of molecular systematics based on proteins (allozyme electrophoresis, immunology) and to a lesser extent DNA-DNA hybridization were widely used by vertebrate systematists by 1980, these methods received relatively limited use by parasitologists at that time. One explanation is that the small size of some parasites limited their utility for protein-based methods, although these techniques were feasible for many larger helminths. Within parasitology, pioneering protein electrophoretic studies tended to focus on characterizing the genetic variability of natural populations (genetic polymorphism, heterozygosity and allelism, Nadler, Reference Nadler1987b) rather than systematic applications such as phylogenetic inference or species delimitation. Similarly, empirical studies of parasite population genetics were only beginning in the 1980s, and few studies investigating the genetics of geographic variation were published. Although systematic applications within parasitology were relatively few at this time, it was widely understood that molecular data had great potential for phylogenetic reconstruction, confirming the conspecificity of different life-cycle stages (Flockhart and Denham, Reference Flockhart and Denham1984; Andrews et al. Reference Andrews, Beveridge, Adams and Baverstock1988) and identifying cryptic species (Nadler, Reference Nadler1990).
It was not until the 1990s that genetic differences between parasite species were frequently described based on investigations using allozymes (e.g. Goater et al. Reference Goater, Mulvey and Esch1990; Rannala, Reference Rannala1990; Jackson et al. Reference Jackson, Chilton, Beveridge, Morris and Andrews1998). Perhaps most notably, allozymes were used for extensive characterization of ascaridoid nematodes parasitizing marine mammals and piscivorous birds, particularly anisakids (e.g. Bullini et al. Reference Bullini, Arduino, Cianchi, Nascetti, D'Amelio, Mattiucci, Paggi, Orecchia, Plotz, Berland, Smith, Brattey, Battaglia, Valencia and Walton1997; Mattiucci et al. Reference Mattiucci, Nascetti, Bullini, Orecchia and Paggi1986). Electrophoretic surveys of anisakids provided the first molecular data revealing the true species level diversity of this group, including cryptic species complexes within the genus (see Paggi and Bullini, Reference Paggi and Bullini1994; Mattiucci and Nascetti, Reference Mattiucci and Nascetti2008 for reviews), although this approach has mainly been replaced by sequenced-based studies of nuclear and mitochondrial DNA. A few publications (e.g. Aho et al. Reference Aho, Mulvey, Jacobson and Esch1992) even managed to bridge the gap between molecular systematics and ecology by emphasizing the importance of proper identification of parasites for ecological analyses and illuminating how morphological plasticity may confound species identification when congeners co-occur, as in the case of Neoechynorhynchus (acanthocephalan) species in turtles. A few studies transcended the documentation of genetic (electrophoretic) differences between taxa and specifically dealt with the recognition of cryptic species. For example, Tibayrenc (Reference Tibayrenc1993) argued that cryptic species could be recognized among human parasitic protozoans including Entamoeba, Giardia and Toxoplasma, and Andrews et al. (Reference Andrews, Monis, Ey and Mayrhofer1998) argued that the magnitude of the genetic differences detected within Giardia muris provided an indication of the range of genetic differentiation that could be used to characterize morphologically similar but genetically distinct species within this genus.
For parasitic helminths, studies that integrated population-level sampling with assessments of genetic distinctiveness were conducted for several different organisms. For example, investigations of Trichinella using allozymes showed the absence of gene flow among isolates of the genus, leading to the conclusion that Trichinella consisted of several sibling species (see La Rosa et al. Reference La Rosa, Pozio, Rossi and Murrell1992; Pozio et al. Reference Pozio, La Rosa, Murrell and Lichtenfels1992 and references therein). Many subsequent studies continued to apply allozyme electrophoresis for detecting non-interbreeding populations within larger samples, leading to the detection and description of cryptic species. For example, Chilton et al. (Reference Chilton, Beveridge and Andrews1992) conducted an allozyme analysis on 98 individuals of the strongylid nematode Hypodontus macropi collected from 8 different host species. The 28 loci used in that study revealed a complex of at least 6 cryptic species, with 15–50% fixed genetic differences between taxa. Similarly, Nascetti et al. (Reference Nascetti, Cianchi, Mattiucci, D´Amelio, Orecchia, Paggi, Brattey, Berland, Smith and Bullini1993) identified 3 cryptic species within Contracaecum osculatum, a parasite of seals from the Atlantic Arctic-Boreal by analysis of 1,657 individuals at 17 enzymatic loci. These authors reported that these genetically differentiated cryptic (sibling species in their terminology) species were reproductively isolated and showed differences in their geographic ranges and host preference. Beveridge et al. (Reference Beveridge, Chilton and Andrews1993) used multi-locus electrophoresis to detect the presence of 2 cryptic species within what had been formerly recognized as Macropostrongyloides baylisi, a strongylid parasite of marsupials. Enzyme electrophoresis was also applied to the systematics of cestodes; for example, Ba et al. (Reference Ba, Wang, Renaud, Euzet, Marchand and De Meeûs1994) reported finding a complex of cryptic species in African (Senegal) domesticated ruminants that were previously considered to represent 2 species (Avitellina centripunctata and Thysaniezia ovilla).
Although allozyme methods are still used in rare instances (e.g. Vilas et al. Reference Vilas, Sanmartin and Paniagua2004; Saijuntha et al. Reference Saijuntha, Sithithaworn, Wongkham, Laha, Pipitgool, Tesana, Chilton, Petney and Andrews2007; Chilton et al. Reference Chilton, O'Callaghan, Beveridge and Andrews2007), protein-based techniques have essentially been replaced by DNA-based approaches that use the polymerase chain reaction. Advantages of nucleotide sequence-based approaches are that all differences for a particular gene region can be detected, and the sensitivity of PCR permits application to tiny amounts of tissue for very small parasites, even single helminth eggs for example. Although individuals with different ‘electromorphs’ (proteins of different mobility) for a locus show evidence of underlying DNA differences, individuals with proteins of the same mobility may not share the same DNA sequence (e.g. allele) for the locus under comparison. Yet, one practical advantage of allozyme electrophoresis is that it can be readily used to generate data from multiple loci (often 15–30) when sufficient tissue is available, whereas until recently investigators have most frequently applied DNA-based PCR methods to obtain sequence data from one or few loci, although extension to multiple loci is now quite technically feasible for most parasites. Remaining barriers to obtaining data from multiple loci by sequence involve cost per individual sample and the labour needed for proper sequence dataset assembly and management.
Other non-sequence based PCR-driven techniques have also been applied to investigate parasite genetic variation, including PCR-restriction fragment length polymorphism (PCR-RFLP) assays, and random amplified polymorphic DNA (RAPD) markers. Although these techniques have generally augmented discovery of genetic divergence, they have not in the strict sense been used to definitively diagnose cryptic species. For instance, Miura et al. (Reference Miura, Kuris, Torchin, Hechinger, Dunham and Chiba2005) found distinguishable RFLP patterns among the intramolluscan stages of digeneans (Heterophyidae and Philophthalmidae) in Japan, and subsequent sequence analysis of mitochondrial and nuclear genes demonstrated the presence of cryptic species in these families. Anderson and Barker (Reference Anderson and Barker1993) found genetic differences among 6 didymozoid trematode species using RFLP analysis of internal transcribed spacer (ITS) and 5·8S ribosomal RNA, but these species had already been distinguished on morphological grounds. Donald et al. (Reference Donald, Sijnja and Spencer2007) investigated the accuracy of cercarial species identification based on host information, morphology, and molecular techniques in a group of common intertidal hosts and parasites; these investigators showed that host information plus RFLP data provided a rapid, unambiguous method of species diagnosis that host information and morphological measurements did not provide. Many RFLP studies have proved useful for providing genetic markers for the reliable identification of known species, characterizing levels of genetic variation (e.g. McManus, Reference McManus1990; Dame et al. Reference Dame, Yowell, Courtney and Lindren1991; Zarlenga et al. Reference Zarlenga, McManus, Fan and Cross1991; Christensen et al. Reference Christensen, Zarlenga and Gasbarre1994) and investigating the epidemiology of parasites (see Singh, Reference Singh1997 and references therein). For instance, Gasser and Hoste (Reference Gasser and Hoste1995) used PCR-RFLP of ITS rDNA to characterize five species of Trichostrongylus from ruminant hosts and demonstrated that each species could be identified reliably by their restriction pattern.
CRYPTIC SPECIES DELIMITATION: SEQUENCE-BASED MOLECULAR METHODS
The requirement for methods with high sensitivity, precision, and data applicability (i.e. appropriate methods of data analysis), means that PCR amplification and DNA sequencing is currently the most useful approach for finding and delimiting species, including cryptic species. This paradigm shift was facilitated through rapid advances in molecular technology (e.g. fluorescent cycle sequencing, capillary automated sequencers, gradient PCR machines), and improved computational tools for analyzing DNA sequence data. There is little doubt that new ‘next generation’ sequencing technologies will replace current methods, offering unparalleled opportunities for obtaining data from large numbers of individual parasites at reduced cost, increasing the potential for comprehensive molecular assessments of parasite biodiversity. From an empirical standpoint, selection of loci with appropriate substitution rates is also key to recovering evidence of cryptic species. Genetic data representing the most rapidly evolving gene regions are expected to be of greatest value for detecting and delimiting closely related species, such as sister-species and potentially many cryptic species. Separate species might fail to be delimited by loci evolving at slower rates – for example, if the gene is under relatively high functional constraint. Thus, genes that are quite suitable for inferring phylogenetic relationships among genera may be misleading for testing hypotheses of species. For example, the 28S D2-D3 region, which is typically informative for nematode phylogenetics (e.g. Nadler et al. Reference Nadler, De Ley, Mundo-Ocampo, Smythe, Stock, Bumbarger, Adams, De Ley, Holovachov and Baldwin2006) showed no variation between Uncinaria species delimited using more variable regions (ITS) from the same ribosomal RNA locus (Nadler et al. Reference Nadler, Adams, Lyons, DeLong and Melin2000). However, a consequence of using rapidly evolving gene regions (e.g. introns and certain ribosomal RNA genes) is that errors inferring homologous characters (positional homology) are likely to occur more frequently, compromising the accuracy of lineage identification and inference of relationships among species. This problem of positional homology inference can be compounded when very distantly related outgroups (rather than sister groups) are used for outgroup rooting of trees. Despite these potential problems, the most rapidly evolving genes provide the most useful data for ensuring that hypotheses of species are accurately tested for the most recent speciation events. This requires that researchers investigate if their conclusions are sensitive to alignment-ambiguity. Fortunately, probabilistic multiple alignment programmes are available that permit such investigations without introducing potential investigator bias (manually choosing which sites are to be considered ambiguous).
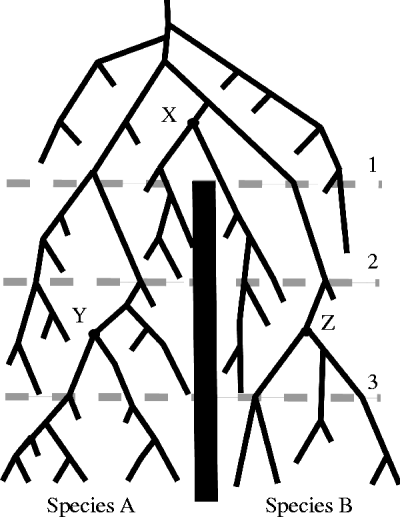
Mitochondrial DNA genes can be of value for testing hypotheses of species for closely related taxa because of their relatively rapid rate of substitution coupled with the smaller effective population size (Ne) of mtDNA which, for allogamous species, is one-quarter that of nuclear genes because mtDNA is haploid and transmitted exclusively from females to offspring. Smaller Ne leads to more rapid lineage sorting (shorter coalescence time) which, in theory, favours concordance between gene and species trees. Ancestral mtDNA polymorphisms present in descendants at speciation will tend to sort to reciprocal monophyly more quickly than for autosomal loci (Fig. 6), providing evidence of lineage exclusivity in a shorter period of time (on average) following speciation (Avise, Reference Avise1994; Nadler, Reference Nadler2002). Parasites that are hermaphroditic reproduce by autogamy, which results in an mtDNA effective size of one-half that of nuclear genes. Similarly, skewed sex-ratios such as polygynous mating systems (which are known for some parasitic nematodes) may alter the effective size of mtDNA in allogamous species, and under certain conditions, the coalescence time for mtDNA can exceed that for nuclear genes (Hoelzer, Reference Hoelzer1997). These observations suggest that standard assumptions concerning mtDNA coalescence may not be valid for certain parasites and that in some cases nuclear genes may actually be superior to mtDNA for resolving cryptic species. Other caveats regarding interpretation of mtDNA include the potential for artifacts due to nuclear mitochondrial pseudogenes or numts (Bensasson et al. Reference Bensasson, Zhang, Hartl and Hewitt2001), and the observation that cytoplasmic markers such as mtDNA appear to introgress more rapidly than nuclear markers (Ballard and Whitlock, Reference Ballard and Whitlock2004; Chan and Levin, Reference Chan and Levin2005). Such introgression may occur even when hybridization appears uncommon – for example, when the hybridizing parental species are present in very different frequencies, a situation that might be expected for parasites that are normally (but not entirely) host-specific. These caveats are additional arguments favouring use of multiple loci for testing hypotheses of cryptic species, yet, of the 68 such papers published between January 1999 and November, 2009, as reviewed by Pérez-Ponce de León and Nadler (Reference Pérez-Ponce de León and Nadler2010), only 27% are based on more than one locus. The most common combination of multiple loci in these studies involves use of one mitochondrial gene and one or more nuclear ribosomal genes, presumably due to the availability of PCR primers for these genes and the relative ease of amplification of mitochondrial DNA and nuclear ribosomal genes, due to their presence in multiple copies per cell (mtDNA) or nucleus (rDNA repeats). A larger fraction of these 68 papers sample one or more nuclear ribosomal RNA genes (different genes but from a single locus), such as the internal transcribed spacers (ITS1, ITS2), and a few studies employed only mitochondrial genes (also effectively a single locus). Single copy nuclear (SCN) genes have seldom been used for investigating cryptic species or the biodiversity of parasites. Only ∼10% of the papers noted by Pérez-Ponce de León and Nadler (Reference Pérez-Ponce de León and Nadler2010) employed SCN genes. This paucity may be due to methodological restrictions, including the difficulty of amplifying SCN genes directly from genomic DNA (including effects of intron size and distribution). Technical advancements in alternative methods such as reverse-transcription PCR (RT-PCR) and whole genome amplification have the potential to facilitate collection of SCN gene data from many small parasitic taxa. Irrespective of these technical advances for obtaining sequences, appropriate use of these nucleotide data will require careful analysis, including application of operational criteria and delimiting cryptic (and other) species through a hypothesis testing process.
Lineage sorting of a mitochondrial gene tree following speciation. Speciation is represented by the vertical bar originating at time 1, with time elapsing from figure top toward the bottom. Extant individuals (bottom of figure) of species A trace their mtDNA to a most recent common ancestor (MRCA, node Y); likewise, extant individuals of species B share a MRCA for their mtDNA (node Z). In contrast, between the time interval labeled 1–3, some individuals of species B share more recent common mtDNA ancestry with individuals from species A (see node X and descendants). Earlier in time (between intervals 1–2), individuals of both species lack monophyly with respect to their mtDNA lineages. For genes within species to reflect reciprocal monophyly and delimit species, genetic polymorphisms such as occur in mtDNA must be sorted through differential loss (or natural selection), the time course for which depends on population-genetic parameters (Figure modified from Nadler, Reference Nadler2002 and adapted from Avise, Reference Avise1994).

Despite a focus on relatively few genetic loci, there has been a significant increase during the last decade in research using sequence data to characterize parasite biodiversity at all levels. In some cases this has involved searching in a deliberate manner for potential cryptic species (Blouin, Reference Blouin2002; Vilas et al. Reference Vilas, Criscione and Blouin2005; Criscione et al. Reference Criscione, Poulin and Blouin2005) by molecular prospecting. In such studies, levels of sequence divergence (genetic distance) have been used to compare individuals from different host species or representing different geographic isolates. Finding unexpectedly high levels of sequence divergence has been used to question the conspecificity of such individuals (see Chilton et al. Reference Chilton, Gasser and Beveridge1995; Blouin et al. Reference Blouin, Yowell, Courtney and Dame1998). In this way, sequence-based prospecting uses the expectation of relatively low intraspecific differentiation (a form of genetic yardstick) to assess if the individuals examined are the same species (Blouin, Reference Blouin2002). According to Vilas et al. (Reference Vilas, Criscione and Blouin2005) molecular prospecting studies are usually initiated when the presence of cryptic species is suspected or when it is desirable to confirm that the focal taxon of an investigation is a single species. For instance, cryptic species might be predicted when parasites occur in multiple host species, different habitats within definitive hosts, or have an extensive geographic range (within single or multiple definitive host species). Molecular prospecting is only an initial step for testing the hypothesis that cryptic species may be present. Preliminary findings of unexpectedly large genetic divergence among individual parasites require additional investigation, including more data (often sequencing more individuals and additional loci) and formal hypothesis testing for the absence of gene flow or evolutionary lineage exclusivity.
Empirical evidence on cryptic species of parasites is beginning to accumulate more rapidly. A literature review conducted by Pérez-Ponce de León and Nadler (Reference Pérez-Ponce de León and Nadler2010) showed that discovery methods for cryptic species are different when pursued by parasitologists in different research areas (e.g. taxonomy, ecology and epidemiology). Some of these discoveries were made entirely by chance, whereas others resulted from molecular prospecting studies sensu Blouin (Reference Blouin2002). In most of the papers cited by Pérez-Ponce de León and Nadler (Reference Pérez-Ponce de León and Nadler2010), cryptic species were discovered but not described (named) as is required for formal recognition.
PARASITE CRYPTIC SPECIES: IMPLICATIONS OF THEIR DISCOVERY
From a general point of view, discovering cryptic species has very important implications for understanding the relative frequency of parasitism as a mode of life, particularly for non-parasitologists, who may tend to underestimate the plethora of parasite species relative to hosts. Thus, enumerating cryptic parasite species from all kinds of hosts will permit a more accurate understanding of parasite biodiversity, systematics, epidemiology, evolutionary biology and biogeography. Parasite systematists have been describing new species with regularity for ∼200 years, but it is difficult to estimate what fraction of morphologically distinct parasites is known. In comparison, molecular systematics is a relatively new practice and only a minute fraction of extant cryptic parasites species have been discovered. Clearly, biologists are far from having a complete inventory of parasite biodiversity (Poulin and Morand, Reference Poulin and Morand2004), however, our knowledge can clearly be augmented through use of gene sequences and through such approaches parasitologists will enhance understanding of species richness, including the contribution of cryptic species. The available data suggest that different clades of parasites may have different frequencies of cryptic species. For example, an analysis by Poulin (Reference Poulin2010) showed that when corrected for other potentially confounding variables, there was an uneven distribution of cryptic species, with more among trematodes than other helminths.
Morphology remains the dominant way of describing new parasite species and distinguishing them from previously described species; it is the main way that parasitologists characterize parasite biodiversity and evaluate factors such as host specificity. However, it is evident that morphology alone may frequently yield inadequate taxonomic resolution and, at worst, can provide misleading answers to basic questions about host-parasite relationships. Although not a panacea, molecular systematic methods are tools that can provide an evolutionary framework for parasite diversity that is independent of morphology, yielding historical hypotheses ranging from the highest taxonomic levels (e.g. relationships of exclusively parasitic lineages to free-living lineages) to species-level prospecting and delimitation. Molecular data can independently corroborate that species recognized by morphological criteria are separate genetic lineages or conversely, uncover evidence that individuals appearing to be morphologically indistinguishable belong to independent evolutionary lineages (Nadler et al. Reference Nadler, Adams, Lyons, DeLong and Melin2000; Nadler, Reference Nadler2002). Species complexes of parasites are being revealed by molecular data where it was once thought there was either a single phenotypically variable species or a single morphologically uniform species (e.g. Leung et al. Reference Leung, Keeney and Poulin2009; Blasco-Costa et al. Reference Blasco-Costa, Balbuena, Raga, Kostadinova and Olson2009; Martínez-Aquino et al. Reference Martínez-Aquino, Reyna-Fabián, Rosas-Valdez, Razo-Mendivil, Pérez-Ponce de León and García-Varela2009; Razo-Mendivil et al. Reference Razo-Mendivil, Vázquez-Domínguez, Rosas-Valdez, Pérez-Ponce de León and Nadler2010; Levikainen et al. Reference Lavikainen, Haukisalmi, Lehtinen, Laaksonen, Holmström, Isomursu, Oksanen and Meri2010; Locke et al. Reference Locke, Mclaughlin and Marcogliese2010). The recognition that ‘well-established’ species, especially those that seem to have a wide geographical distribution or a low host-specificity (i.e. they parasitize several distantly related species of hosts), might actually represent complexes of cryptic species, reinforces the idea that parasite biodiversity is grossly underestimated (Poulin and Morand, Reference Poulin and Morand2004) and that the outcome of inventory work for certain parasites might be greatly altered if a molecular approach is used (Pérez-Ponce de León and Choudhury, Reference Pérez-Ponce de León and Choudhury2010). However, a contrasting idea (Poulin and Morand, Reference Poulin and Morand2004) is that given the potential for host-induced morphological plasticity of many kinds of parasites, estimates of species diversity that have been based on morphological data may need to be revised downward for certain groups, and this could also be explored through molecular prospecting (sensu Blouin, Reference Blouin2002) and resolved using more detailed investigation, as previously described. The outcome of the more frequent application of molecular approaches is that estimates of parasite biodiversity will be improved. As an example, Bensch et al. (Reference Bensch, Perez-Tris, Waldenstrom and Hellgren2004) used results from mtDNA to suggest that the number of avian Plasmodium species was 10,000 instead of the 175 that have been recognized based on morphology. If true, this result calls into question the value of trying to delimit species of avian Plasmodium based on morphological criteria alone and suggests that many existing species are cryptic. Similarly, Sehgal et al. (Reference Sehgal, Hull, Anderson, Valkiunas, Markovets, Kawamura and Tell2006) suggested that cryptic species are common in blood parasites that infect humans and lizards, where several morphologically similar taxa are composed of distinct reproductively isolated species. This clearly demonstrates that the most accurate count of parasite species must include an evaluation of cryptic species, particularly among those species in which traditional criteria such as the natural host range have played a significant role in influencing taxonomic decisions.
It is widely accepted that some parasite species exhibit a preference for a particular host species (specialists), while others can infect a wider range of host species (generalists). For these distinctions to be useful, estimates of specificity must be reliable, since this feature reveals important life history differences between parasite species (Glennon et al. Reference Glennon, Perkins, Chisholm and Whittington2008). In host-parasite systems with strong co-evolutionary patterns, co-speciation and co-adaptation events are usually considered to underlie host-specificity (Brooks, Reference Brooks1979, Reference Brooks1981; Brooks and McLennan, Reference Brooks and McLennan1993; Hoberg and Brooks, Reference Hoberg and Brooks2008) but in parasites with complex life cycles that involve dispersal of free living stages, host vagility and local adaptation rather than co-speciation processes may determine specificity. For example, Bouzid et al. Reference Bouzid, Štefka, Hypša, Lek, Scholz, Legal, Kalthoum, Hassine and Loot2008 examined the phylogenetic structure of the tapeworm Ligula intestinalis on a global scale using sequences from mtDNA and nuclear ITS2. Measures of sequence divergence were used to explore the presence of cryptic species and to consider potential mechanisms of speciation. These authors found a correlation between levels of genetic structure and geography on a broad geographic scale or an isolation-by-distance effect. They did not find any correspondence between tapeworm phylogeny and specificity to fish intermediate hosts for two clades (clades A and B) that contained most of the samples from diverse locations and hosts in Europe. These authors suggested that clades A and B represent 2 different biological species, acknowledging that estimates of genetic divergence alone are not definitive for delimiting cryptic species. Interestingly, despite their low specificity for intermediate hosts, these 2 putative species (A and B) were found in the same avian definitive host, Podilymbus cristatus, sampled from the same locality (Bouzid et al. Reference Bouzid, Štefka, Hypša, Lek, Scholz, Legal, Kalthoum, Hassine and Loot2008), suggesting that these species are reproductively isolated even though they share the same definitive host. This example provides a glimpse of the immense potential that cryptic species discovery may have for revealing undiscovered diversity and information about the host-specificity of parasites. There are likely many other instances where what is commonly believed to be a widespread generalist parasite may consist of an undetected species complex.
Undetected species also have the potential to confound biogeographical analyses and studies of host-parasite co-phylogeny. Co-speciation and biogeographical analyses rely on thorough sampling and precise identification of the organisms associated with hosts or areas and accurate distribution data for both hosts and their parasites (including the occurrence of parasite species on more than one host species). For example, uncollected or otherwise unknown species of parasites can markedly change co-phylogenetic interpretations under certain circumstances (Page, Reference Page1996; Light and Hafner, Reference Light and Hafner2007). Similarly, when a parasite species occurs on more than one host species, this distribution has implications for host-switching or with other co-phylogenetic models, the distribution of an ancestral parasite lineage to descendant host species (Page, Reference Page1993). Although many recent studies of host-parasite co-speciation have employed both genetic and morphological data, it is not unusual for parasite sample sizes to be small, possibly causing cryptic species and species of parasites distributed on multiple host species, to be overlooked. If this scenario is common in a host-parasite system, then co-speciation and biogeographic conclusions may require reevaluation.
Cryptic species also have consequences for classification and interpretation of sister-group relationships among parasitic organisms. From a practical standpoint, phylogenetic reconstructions at any level of the taxonomic hierarchy may lack robustness and explanatory power when extant members of a particular taxon are missing from the analysis (e.g. species within a genus). The discovery of cryptic species among what has been considered a single species will impact sister-group relationships and potentially interpretation of the evolution of other biological features, as inferred from character reconstruction with reference to the phylogeny. Phylogenetic classifications, whether they derive from the use of morphological characters, molecular markers, or both are intended to provide a powerful predictive tool for biological investigations. Proper taxon sampling is among the most relevant issues for obtaining accurate phylogenetic classifications but currently, lack of information concerning the frequency of cryptic species may negatively impact such classifications. For instance, the dove louse genus Columbicola included 80 species until 2007, when Johnson et al. published the most comprehensive molecular phylogeny for any genus of parasitic louse, based on sequencing three genes (mitochondrial COI and 12S, nuclear EF-1a) for 49 known species from 78 species of hosts. This study included multiple louse individuals from most host species for a total of 154 individual Columbicola and, based on sequence divergence levels and phylogenetic tree topology, 33 cryptic species were discovered. Based on their results, classification among the taxonomic groups, previously based on morphology, was re-evaluated and several of the new species have been described (Bush et al. Reference Bush, Price and Clayton2009).
Likewise, the existence of cryptic species has the potential to impact many aspects of human and veterinary parasitology, including understanding of pathogenicity, epidemiology, chemotherapy, and implementation of diagnostic, control and surveillance programmes (Conn et al. Reference Conn, Mitchell and Cockburn1997; Cepicka et al. Reference Cepicka, Kutišova, Tachezy, Kulda and Flegr2005; Saijuntha et al. Reference Saijuntha, Sithithaworn, Wongkham, Laha, Pipitgool, Tesana, Chilton, Petney and Andrews2007). For instance, sequence data from multiple genes were used by Cepicka et al. (Reference Cepicka, Kutišova, Tachezy, Kulda and Flegr2005), along with other sources of information, to show that Tetratrichomonas gallinarum, an intestinal flagellate considered common in fowl and other galliniform and anseriform birds, does not represent a single species but rather is a species complex consisting of at least 3 putative morphospecies, with some of these including additional cryptic species. This heterogeneity was not known when pathogenicity studies were first performed and Cepicka et al. (Reference Cepicka, Kutišova, Tachezy, Kulda and Flegr2005) have suggested that different studies may have used different species, which likely differ in pathogenic potential. Some of the newly discovered species can even infect humans, leading Cepicka et al. (Reference Cepicka, Kutišova, Tachezy, Kulda and Flegr2005) to conclude that studies on T. gallinarum pathogenicity should be repeated.
Discovering and delimiting cryptic species, in the light of different epidemiological data (e.g. prevalence, intensity, morbidity, host range, etc.) is essential to determining the appropriate control strategy and treatment for parasitic diseases. Recently, Saijuntha et al. (Reference Saijuntha, Sithithaworn, Wongkham, Laha, Pipitgool, Tesana, Chilton, Petney and Andrews2007) detected a cryptic species within Opisthorchis viverrini, a food-borne trematode that infects humans and is an endemic species in Southeast Asia. This discovery provided an explanation for the considerable variation they found in the epidemiological data relating to O. viverrini, which led these authors to propose a re-evaluation to determine what these differences are and whether control strategies and treatment will be equally effective between areas in Southeast Asia. Similarly, Cantacessi et al. (Reference Cantacessi, Riddell, Morris, Doran, Woods, Otranto and Gasser2008) found three cryptic species of the apicomplexan genus Eimeria in chickens in Australia. These findings raised concerns regarding the effectiveness of commonly used control and surveillance programmes. Coccidiosis is one of the most important diseases of poultry worldwide, with annual production losses estimated at billions of dollars; preventative anticoccidial drugs, together with the induction of species-specific natural immunity are used for the control and surveillance of the disease. A clear understanding of the biology and epidemiology of each cryptic species will be crucial for designing and implementing effective vaccination and control strategies (Cantacessi et al. Reference Cantacessi, Riddell, Morris, Doran, Woods, Otranto and Gasser2008). Similarly, Grillo et al. (Reference Grillo, Jackson, Cabaret and Gilleard2007) demonstrated the existence of a cryptic species of the nematode Teladorsagia as a result of a multilocus population genetic study of Teladorsagia circumcincta. This nematode is one of the most economically important parasites of sheep and goats in temperate regions of the world and the control of Teladorsagia is dependent upon the use of broad-spectrum anthelminthics. However, the increasing prevalence of anthelminthic resistance threatens the sustainability of parasite control. Characterizing the diversity of these Teladorsagia species, including comparative pathology, drug resistance and potential for spread of drug resistance genes is essential knowledge for planning effective parasite control.
Cryptic species also pose challenges for assessments of population-level (intraspecific) variation in parasitic organisms. For example, Steinauer et al. (Reference Steinauer, Parham and Nickol2006) analysed the literature on the acanthocephalan Leptorhynchoides thecatus, which parasitizes freshwater fish throughout eastern North America and found that populations differed in traits such as the range of host species, microhabitat specificity within the host and life-cycle transmission patterns. Based on a statistical analysis of distributional data, these authors detected that variation in these traits was correlated with geographical patterns and hypothesized the existence of cryptic species or broad scale environmentally-induced variation. Steinauer et al. (Reference Steinauer, Nickol and Ortí2007) sequenced a mitochondrial gene (COI) and the nuclear internal transcribed spacer region and used these sequences in a phylogenetic context to test whether variation in host use, habitat use and transmission were due to environmental or phylogenetic influences. They concluded that most of the variation could be explained by the presence of cryptic Leptorhynchoides species.
Studies of parasite population genetic structure can lead to the discovery of cryptic species, and may also be of predictive value in suggesting why some taxa have the potential to be more species rich than others (Poulin and Morand, Reference Poulin and Morand2004; Criscione and Blouin, Reference Criscione and Blouin2004). For example, Criscione and Blouin (Reference Criscione and Blouin2004) demonstrated that differences in life cycles predispose parasites to different genetic structures, thereby affecting the evolutionary potential of those parasites. Studies of intraspecific genetic variation in salmon trematodes (Criscione and Blouin, Reference Criscione and Blouin2004) revealed that autogenic species (those that cycle only in freshwater hosts) had much more highly structured populations (lower gene flow among subpopulations), than allogenic species (those that cycle through freshwater and terrestrial hosts). A natural extension of this observation is to assess if taxa with greater genetic structure also have more species (including cryptic species). Likewise, comparative investigations are needed to ascertain if there is a relationship between speciation rates and factors that appear to influence genetic structure, such as certain aspects of parasite life histories and transmission patterns (Nadler, Reference Nadler1995). For example, we might predict that monogeneans, which have direct life cycles, would tend to have both more highly structured populations and more species than plathyhelminths with indirect life cycles. Aspects of host-parasite relationships may also affect the probability of finding unknown species in nature. For example, the relatively reduced host specificity of certain larval stages (e.g. trematode metacercariae) may enhance opportunities for collection and molecular prospecting of taxa in comparison to difficulties of obtaining adult parasites from many different definitive host species when host specificity is greater in the final host (Locke et al. Reference Locke, Mclaughlin and Marcogliese2010).
Criscione and Blouin (Reference Criscione and Blouin2004) also showed that mitochondrial DNA sequences for Derogenes aspina, an autogenic species, included 2 haplogroups, suggesting the existence of a cryptic species. This cryptic species prospecting result was corroborated by sequences of the nuclear ITS1 gene; the resulting concordance of the nuclear and mitochondrial partitioning was inconsistent with the hypothesis of a single species. This information was essential for proper analysis of the population genetic data – that is, the data from the unexpected cryptic species was excluded. Interestingly, while conducting a phylogeographical study of Plagioporus shawi and its congruence with salmon evolutionary significant units (a focus of salmon conservation efforts), Criscione and Blouin (Reference Criscione and Blouin2007) discovered another potential cryptic species. Of 207 individuals genotyped and sequenced using microsatellites and mtDNA, they excluded 15 from analysis because they appeared to represent a cryptic species. Clearly undetected cryptic species have the potential to alter the outcome of population genetic studies, with the expectation that additional genetic structure will result from inadvertently combining data representing two or more reproductively isolated species.
Although it is not feasible to provide a comprehensive analysis of the potential impact of cryptic species in all areas of parasitology, these selected examples show that undetected cryptic species can confound understanding of many research areas. Given the paucity of available data, it is premature to try and assess patterns of cryptic species diversity among different parasite groups. Nevertheless, it is worthwhile to develop predictive hypotheses regarding speciation of parasites generally; for example, which parasite life histories and genetic structures are more likely to yield higher speciation rates and which groups of parasites are more likely to undergo speciation without discernable morphological differentiation. Such predictions would be useful for guiding efforts at cryptic species prospecting. It is our hope that this review will promote research designed to discover, delimit and describe cryptic species. Such research is essential not only because it is fundamental to promote a better understanding of the basic biology, ecology and evolutionary history of host-parasite relationships but also because it is relevant to many applied research programmes, such as those with the goals of improving parasite diagnostics, control and eradication.
ACKNOWLEDGMENTS
This paper was written during the sabbatical leave of G.PPL to the Department of Nematology, University of California, Davis. Thanks are due to the programme UC MEXUS-CONACyT (University of California Institute for Mexico and the United States-Consejo Nacional de Ciencia y Tecnología, México) for fellowship support.
FINANCIAL SUPPORT
This study was partially supported by grants from the Consejo Nacional de Ciencia y Tecnología (G.PPL., CONACyT, No. 83043), the Programa de Apoyo a Proyectos de Investigación e Innovación Tecnológica (G.PPL., PAPIIT-UNAM IN 209608) and the US National Science Foundation PEET award (S.A.N., DEB-0731516).