
Introduction
In 1999, a team led by Jürgen Seeher of the Deutsches Archäologisches Institut made a remarkable discovery during excavation of a subterranean storage complex at the Hittite capital city of Hattusha: a series of intact storage chambers filled with hundreds of tonnes of charred cereal grain (Seeher Reference Seeher2000, Reference Seeher2006). To the best of our knowledge, this remains the world's largest archaeobotanical assemblage. The recovery and analysis of several tonnes of the well-preserved plant material offers new insights into the nature of agricultural production at the Hittite capital in the early sixteenth century BC. Previous discussions of Hittite agriculture have been constrained by the restricted archaeobotanical data available (a key exception being ongoing work at Kaman-Kalehöyük; Fairbairn & Omura Reference Fairbairn and Omura2005), and have, instead, relied on documentary evidence (e.g. Hoffner Reference Hoffner1974). In the present study, the wealth of new archaeobotanical data from the Hattusha storage complex, combined with a multi-stranded agroecological approach, opens a new window onto Hittite crop-husbandry methods and regimes, as well as on crop mobilisation and taxation by this early state.
Hattusha
The city of Hattusha is situated on the north-central Anatolian plateau, approximately 210km east of Ankara, Turkey. The site lies at an altitude of 900–1250m asl, in a region characterised by fertile intermontane plains and river valleys (Branting Reference Branting1996). Palaeoclimatic reconstructions for the third to second millennia BC suggest that climatic conditions in this region were similar to those of today (Yakar Reference Yakar2000: 227; Dörfler et al. Reference Dörfler, Harking, Neef, Pasternak, von den Driesch, Genz and Mielke2011; Schachner Reference Schachner2011: 36). Currently, the plateau experiences warm, dry summers and cold, wet winters, with rainfall averaging approximately 450mm/year. These conditions, however, can often be unpredictable, leading to periods of intense drought (Seeher Reference Seeher2006: 83). Pollen records indicate that this region was heavily forested through the Early Holocene (Roberts et al. Reference Roberts, Eastwood, Kuzucuoğlu, Fiorentino and Caracuta2011), but considerable deforestation by the Hittites during the mid second millennium BC led to a dramatic decline in woodland species (Wright et al. Reference Wright, Fairbairn, Tyler Faith and Matsumura2015).
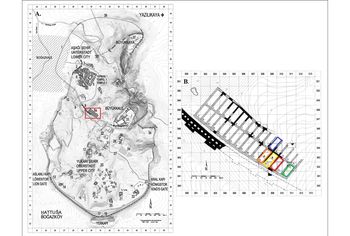
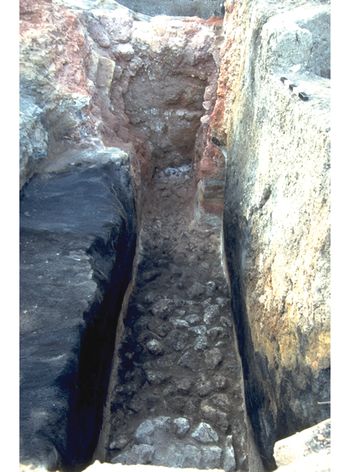
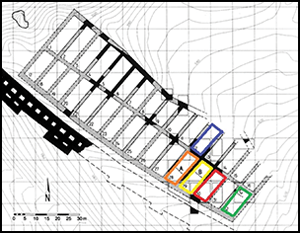
Hattusili I established Hattusha c. 1650 BC. During the Old Kingdom period (c. 1700–1400 BC), the city encompassed an area of 0.74km2—known as the Lower City (Seeher Reference Seeher2000; Bryce Reference Bryce2002: 12). In this phase, the site was dominated by the Büyükkale acropolis, which contained administrative and palatial buildings, as well as a temple complex to the north-west (Figure 1a). The site was rediscovered during the late nineteenth century AD, and excavation—undertaken by the Deutsches Archäologisches Institut—began in the 1930s (Seeher Reference Seeher1995). In 1960–1961, an underground structure was uncovered on the north-western slope of Büyükkale, behind the defensive postern wall of the Lower City (Seeher Reference Seeher2000). Further excavation in 1999 revealed a massive subterranean grain storage complex, or silo, measuring 118m in length and 33–40m in width (Seeher Reference Seeher2006: 49). The total capacity of the complex has been estimated at 7000–9000m3 (Seeher Reference Seeher2006: 81)—sufficient to store between 5512 and 7087 tonnes of cereal grain, which is enough to feed a population of 20 000–30 000 for one year. Internally, the silo was divided into 32 individual storage chambers that were hermetically sealed and could be filled and emptied independently (Figure 1b). The silo was partially destroyed by fire during the early sixteenth century BC, not long after its construction. Twelve of the 32 chambers were destroyed (Seeher Reference Seeher2006: 49). Upon excavation, the most spectacular feature of this discovery was that some of these chambers were full, containing hundreds of tonnes of intact charred cereal grain in layers approximately 1.20m thick (Dörfler et al. Reference Dörfler, Harking, Neef, Pasternak, von den Driesch, Genz and Mielke2011) (Figure 2). Overall, excavation removed four tonnes of material from five individual chambers (chambers 12, 28, 29, 30 and 32; Figure 1b). This material is currently being analysed in a collaborative project between the School of Archaeology at the University of Oxford and the Deutsches Archäologisches Institut in Berlin (Diffey et al. Reference Diffey, Neef, Bogaard and Schachner2017).
A) Plan of Hattusha (courtesy of the Deutsches Archäologisches Institut), with the silo in red; B) plan of the silo complex (after Seeher Reference Seeher2006), with the five excavated chambers indicated by colour: blue) chamber 12; orange) chamber 28; yellow) chamber 29; red) chamber 30; green) chamber 32 (figure by the authors).

Chamber 30 during excavation, showing the mass of carbonised cereals above the stone floor (photograph by J. Seeher).

Methods
Each excavated chamber was sampled both vertically and horizontally to assess the compositional heterogeneity of the grain fill (see the online supplementary material (OSM)). The sample sizes from each chamber varied due to differential preservation and exposure. Initial sub-sampling, sorting and preliminary identification of the Hattusha material was undertaken by Reinder Neef. Full quantification, identification and analysis of 45 samples was subsequently undertaken at the School of Archaeology, University of Oxford, from 2014–2018 (for further methodological details, see the OSM). Here, we report on compositional variation using correspondence analysis, which arranges samples along a set of axes (typically axis 1 and 2, which account for the most variation) based on similarity in taxon composition, and taxa along the same axes based on similarity of co-occurrence in samples. Associations among samples or species are expressed as the direction and distance of divergence from the origin. Correspondence analysis was carried out using CANOCO 5 (Ter Braak & Smilauer Reference Ter Braak and Smilauer2012); in all diagrams shown here, axis 1 is plotted horizontally and axis 2 vertically.
Crop stable isotope analysis was undertaken to interpret crop-management systems in relation to water availability and soil nitrogen composition (see the OSM). In total, 64 subsamples, each containing 10 homogenised emmer wheat or hulled barley grains, were selected for stable carbon and nitrogen isotope analysis (Table S2 in the OSM). Individual sample errors for δ13C and δ15N values were calculated using the within-run variability of the raw measurements and the known uncertainty of two reference standards using the approximation method (Kragten Reference Kragten1994; see the OSM). Accuracy or systematic error (u(bias)) following the Szpak et al. (Reference Szpak, Metcalfe and Macdonald2017) protocol was determined to be ±0.091 for δ13C and ±0.14 for δ15N based on the difference between the observed and known δ values of an in-house alanine and the long-term standard deviations of the alanine (the latter provides a measure of the accuracy of the values). Details of the analytical conditions are reported in Tables S3–S4.
Functional weed ecology is used to characterise crop-growing conditions, and to assess the overall labour-intensity of farming regimes (Jones et al. Reference Jones, Bogaard, Charles and Hodgson2000; Bogaard et al. Reference Bogaard2016, Reference Bogaard2018). This method measures the functional traits of weed species in order to estimate species’ potential performance in relation to major ecological factors, such as fertility and mechanical disturbance (Jones et al. Reference Jones, Bogaard, Charles and Hodgson2000; Bogaard et al. Reference Bogaard2016, Reference Bogaard2018). This approach complements stable isotope analysis of crops, in that it provides a net assessment of arable fertility—to which practices such as water management and manuring may contribute. It also incorporates the additional factor of disturbance, as determined by tillage and weeding practices (Bogaard et al. Reference Bogaard2016, Reference Bogaard2018).
Applying a model presented by Bogaard et al. (Reference Bogaard2018), discriminant analysis can be used to make direct comparisons between archaeobotanical weed data and modern weed floras that developed under known conditions of high or low management intensity. This statistical technique combines relevant discriminating variables (here, functional ecological traits of weed species) to produce a linear equation that maximises the separation between pre-defined groups (here, modern fields managed under low- and high-intensity regimes). We use this equation to classify the Hattusha samples as unknown cases. Forty-four of the 45 samples, each containing at least 100 weed seeds identified to species, were included. IBM SPSS Statistics 22 was used to perform the discriminant analysis.
Results
Assemblage overview
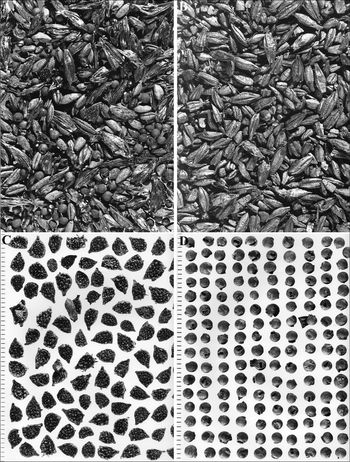
All 45 samples from the five excavated chambers contained a mixture of exceptionally well-preserved cereal grains, cereal chaff, pulse seeds and weed seeds (Figure 3a–d; see Table S5). Of these groups, grains of hulled barley (Hordeum vulgare) and grains or whole spikelets (grains enclosed by glumes) of the hulled wheats emmer (Triticum dicoccum) and einkorn (Triticum monococcum) dominate the assemblage. Hulled barley was the most frequently identified cereal, a preference that may be attributed to the drought tolerance of this species (Hillman Reference Hillman1985; Nesbitt Reference Nesbitt and Duru1996) in a region subject to dramatic rainfall fluctuation. Analysis of crop-processing status, based on the methodology developed by Jones (Reference Jones, van Zeist and Casparie1984, Reference Jones1987), indicates that all of the cereals were in an advanced state of processing. The presence of barley grain and hulled wheat spikelets (the latter represented primarily as grain due to a charring bias against chaff; see Table S5) accompanied largely by weed seeds that mimic cereals is indicative of prior threshing, winnowing and coarse- and fine-sieving.
Carbonised crop and weed material from the silo complex: A) spikelets and grains of hulled wheats, and associated weed seeds; B) hulled barley (Hordeum vulgare) grain; C) seeds of corn buttercup (Ranunculus arvensis); D) seeds of wild bishop (Bifora radians) (photographs by R. Neef).

The predominance of cereal grains throughout the assemblage accords with use of the silo as a storage depot for taxed produce (see below). More surprising is the large quantity of weed seeds within every sample. Of the 100 taxa identified, 17 were found in over 50 per cent of samples, and seven were found in over 80 per cent of samples. Frequently occurring species include wild bishop (Bifora radians), corn buttercup (Ranunculus arvensis) and cow herb (Vaccaria pyramidata), all of which are native to the central Anatolian plateau and associated with modern arable agriculture. Other plant taxa identified from the silo include potential cultivars: free-threshing wheat (Triticum aestivum/durum), bitter vetch (Vicia ervilia), lentil (Lens culinaris), grass pea (Lathyrus sativus/cicera) and a variety of small-seeded broad bean (Vicia faba var. minuta) (Neef et al. Reference Neef, Cappers and Bekker2012). These species were not abundant, however, and likely represent crop contaminants. A possible exception is Vicia faba var. minuta, which was present in higher numbers throughout the silo, particularly in chambers 12 and 32. This may indicate that such pulses were being grown within the same agricultural area(s) as the cereals in these chambers, and/or that these fields had been used for the cultivation of pulses in the past.
Compositional analysis
Figure 4a–b shows correspondence analysis plots exploring the relationships between cereal crops and weed taxa, with samples coded by chamber number, or shown as pie charts. Samples from chambers 29 and 30 occur in two distinct compositional groups: samples dominated by hulled barley grain are located towards the left (negative) end of axis 1, and samples with greater proportions of emmer grain and weed taxa towards the top (positive) end of axis 2. The position of samples from chambers 12 and 32 towards the bottom (negative) end of axis 2 indicates that these chambers contained larger proportions of weed/wild taxa and pulse species.
Correspondence analysis of 42 archaeobotanical samples and 50 taxa, showing: A) samples coded by chamber number; B) samples as pie charts indicating proportions of major categories (figure by the authors).

A further correspondence analysis was performed on weed taxa only. Figure 5a shows that samples again cluster into separate groups by chamber. Chamber 12 has the most variable composition, containing large proportions of particular weed taxa (Turkish rocket (Bunias orientalis) and other Cruciferae), and appears distinct from the other chambers. By contrast, chambers 29 and 32 have relatively similar weed/wild compositions—a relationship that is not apparent in Figure 4a. Finally, samples from chamber 30 cluster together towards the negative end of both axes. In Figure 4b, samples from chamber 30 divide into those dominated by hulled barley and those dominated by hulled wheat. Figure 5a–b, however, shows that, although variable in crop composition, the weed/wild species composition of chamber 30 is relatively uniform across all samples (for acronyms used in Figure 5b, see Table S6). The chamber-specific plant taxon combinations suggest that the crops stored within each chamber were cultivated under distinct growing conditions.
Correspondence analysis of 39 archaeobotanical samples and 37 weed taxa, showing: A) samples coded by chamber number; B) weed taxa (figure by the authors).

Stable carbon and nitrogen isotope analysis of cereals
Table S7 provides full results of the stable carbon and nitrogen isotope measurements of the Hattusha cereal samples. The C:N ratios of the archaeobotanical samples are variable, but resemble those of modern, experimentally charred cereal grains (Bogaard et al. Reference Bogaard2013). Figure 6 shows the Δ13C values (for the calculation of Δ13C values, see the OSM) of hulled barley and emmer grain, coded by chamber number. Overall, there is limited variability (standard deviations of 0.54 and 0.56‰, respectively; cf. Nitsch et al. Reference Nitsch, Charles and Bogaard2015) within each taxon. Hulled barley values tend to be higher than emmer values (Welch two-sample T-test = T(50.454) = −3.55, p = 0.0008), likely reflecting physiological differences between wheat and barley, such as earlier ripening in the latter (Araus et al. Reference Araus, Febrero, Buxo, Camalich, Martin, Molina, Rodriguez-Ariza and Romagosa1997; Wallace et al. Reference Wallace, Jones, Charles, Fraser, Halstead, Heaton and Bogaard2013). The visible clustering of values by chamber in Figure 6 suggests variation in crop-water status (for statistical tests, see Table S8). Overall, the crops from chambers 12 and 32 appear to have better water status, with some values indicative of well-watered conditions. In contrast, the crop values from chambers 30 and 29 suggest drier growing conditions. These differences are consistent with rain-fed farming and the exploitation of different growing conditions within the Hattusha hinterland.
Δ13C values of the two major cereal species, coded by chamber number; the lower and upper lines represent ‘well-watered’ thresholds based on studies of modern wheat and two-row hulled barley, respectively (Wallace et al. Reference Wallace, Jones, Charles, Fraser, Halstead, Heaton and Bogaard2013; figure by the authors).

Stable nitrogen isotope values of the two cereal types were similar (hulled barley 5.64 ± 1.45‰; emmer 5.60 ± 1.41‰), but also more variable than expected within a single growing condition (cf. Nitsch et al. Reference Nitsch, Charles and Bogaard2015) and, once again, cluster by chamber (Figure 7). Chambers 12 and 32 have significantly higher δ15N values for emmer and barley compared with those from chambers 29 and 30 (see Table S9 for statistical tests). When comparing these results with the manuring bands calibrated against rainfall to account for aridity effects (Styring et al. Reference Styring, Ater, Hmimsa, Fraser, Miller, Neef, Pearson and Bogaard2016, Reference Styring2017), chambers 12 and 32 fall primarily within the high manuring bracket, and chambers 29 and 30 within the low to medium manuring brackets. The use of manure has been well documented for Neolithic agricultural communities in Western Eurasia (e.g. Bogaard et al. Reference Bogaard2013; Vaiglova et al. Reference Vaiglova, Bogaard, Collins, Cavanagh, Mee, Renard, Lamb, Gardeisen and Fraser2014), where its application improved soil fertility and tractability. Manure use, however, has two limiting factors: availability and difficulty of transport (Wilkinson et al. Reference Wilkinson1994). The use of manure is typically limited to the immediate environs of domestic settlements, even with animal traction (e.g. Halstead Reference Halstead2014). At Hattusha, the range of δ15N values suggests that crops from chambers 12 and 32 were grown in fields that had been preferentially manured, reflecting relatively intensive management. In contrast, crops from chambers 29 and 30 were probably grown in fields located farther away from settlements, with less manuring and intensive management.
δ15N values of the two major cereal species, coded by chamber number and with manuring bands adjusted for aridity (Styring et al. Reference Styring, Ater, Hmimsa, Fraser, Miller, Neef, Pearson and Bogaard2016, Reference Styring2017; figure by the authors).

The combined results of carbon and nitrogen stable isotope analyses suggest that cereals from each individual chamber were cultivated under distinct growing conditions and land management regimes, and hence also at different locations. The cereals from chambers 12 and 32 seem to have been grown under favourable moisture conditions and with relatively high levels of soil enrichment through manuring. In contrast, crops from chambers 29 and 30 were grown in drier conditions with lower inputs of manure.
Functional ecological analysis of weeds and intensity of cultivation
Functional ecological analysis of weed data from the Hattusha silo was used to assess the intensity of cultivation relative to known modern regimes. Archaeobotanical samples were classified as deriving from low- or high-intensity regimes using a discriminant function that distinguishes the weed flora of present-day systems in Southern Europe and Morocco (Figure 8a) (Bogaard et al. Reference Bogaard2018). Figure 8b clearly shows that the majority of samples from the silo are located towards the low-intensity end of the spectrum, with only two samples classified as high intensity. In comparison with modern regimes, Hattusha samples correlate closely with fields from Haute Provence in south-eastern France and rain-fed terrace fields in southern Morocco. These low-intensity agricultural regimes are characterised by relatively low rates of disturbance (i.e. tillage and weeding) and low to moderate manuring.
A) Relationship of modern surveyed fields to the discriminant function extracted to distinguish low-intensity (white) and high-intensity (black) regimes using five functional attributes (specific leaf area, leaf area per node, leaf thickness, canopy height, canopy diameter) as discriminating variables (Bogaard et al. Reference Bogaard2018: fig. 11); larger symbols represent group centroids; B) relationship of the Hattusha archaeobotanical samples, coded by chamber, to the discriminant function (figure by the authors).

Overall, the agricultural regimes represented by samples from the five chambers appear to be characterised by low-input management. Figure 8b also echoes some of the chamber-based patterning that was evident in correspondence analysis and in the results of the stable isotope analyses. Samples from chamber 30, for example, cluster towards the low-input (negative) end of the discriminant function. In contrast, samples from chamber 12 encompass a much greater range of values and include the only two samples classified as high intensity. Thus, the results from functional weed ecological analysis and crop stable isotope analysis concur in the information that they provide about the nature of farming practices at Hattusha.
Combining the results of crop stable isotope and functional weed ecological analysis
Modern agroecological studies have shown that functional weed traits and cereal stable isotope values correlate when comparing fields managed under multiple, contrasting regimes (Bogaard et al. Reference Bogaard2016, Reference Bogaard2018). Archaeologically, however, it is often difficult to guarantee that identified weed taxa originate from the same fields as the cereal grains measured for stable isotope analysis. In the case of the Hattusha silo, similar chamber-specific patterns are mirrored independently by the results of the functional weed ecological analysis and crop stable isotope analysis. Each chamber therefore reflects a distinct set of growing conditions. Figures 9–10 show direct comparisons of stable carbon and nitrogen isotope values with the discriminant function scores from the weed ecological analysis, on a sample-by-sample basis. With one exception (Figure 9a), all scatterplots show a significant positive correlation, indicating that samples with high stable isotope values also have high discriminant function scores. Sample data points also cluster, to a certain extent, by chamber number, particularly chamber 30. These results reinforce the inference that cereals stored in chamber 30 were grown under a less intensive husbandry regime compared with cereals stored in other chambers.
Scatter plots showing the relationship between hulled barley stable isotope values and weed discriminant function scores per sample, for: A) Δ13C (R2 = 0.1008, p = 0.07); B) δ15N (R2 = 0.1471, p = 0.03) values (figure by the authors).

Scatter plots showing the relationship between emmer wheat stable isotope values and weed discriminant function scores per sample, for: A) Δ13C (R2 = 0.0967, p = 0.02); B) δ15N (R2 = 0.2297, p = 0.001) values (figure by the authors).

The results of multiple linear regression models (see Table S10), however, demonstrate no correlation between discriminant function score and crop stable isotope values within each chamber. This finding is analogous with modern data from Morocco and Provence, where a correlation between weed ecological traits and stable isotope values has been found across, rather than within, contrasting regimes (Bogaard et al. Reference Bogaard2016, Reference Bogaard2018).
The combined variation in crop stable isotope and weed ecological data among the chambers at Hattusha suggests that each was used to store crops raised under distinct growing conditions and management regimes. While this does not preclude the use of a mixture of farming locations and inter-annual harvest variation, the ecological variation indicated by both stable isotope analysis and functional weed ecology suggests that the silo was not used solely for storing annual harvests from the same regime. The significant differences in results between chambers (particularly chambers 12 and 30) are too extreme to reflect the same regime over different years. Crop stable nitrogen isotope values exhibit slow or small diachronic changes under a given manuring regime (Bogaard et al. Reference Bogaard, Heaton, Poulton and Merbach2007; Fraser et al. Reference Fraser2011). Furthermore, the discriminant analysis used to distinguish low- and high-input regimes is based on multi-regional/multi-year modern weed surveys (Bogaard et al. Reference Bogaard2016, Reference Bogaard2018), and so already includes a ‘generous’ allocation for inter-annual variation. The emerging hypothesis, therefore, is that each chamber of the Hattusha silo represents the produce of a different agricultural community or communities within the Hattusha hinterland.
Discussion
The range of crop-husbandry regimes
The chamber-by-chamber patterning of archaeobotanical results is a striking feature of the Hattusha underground silo, and has been consistent across each type of analysis. This separation by chamber strongly indicates that stored crops were being cultivated under an appreciable range of ecological conditions and were grown in a variety of locations. Certainly, the potential grain storage capacity of the underground silo is very unlikely to have been filled by a single arable estate or rural settlement. The area of arable land required to fill the entire silo would be approximately 46–59km2, based on an estimated capacity of 7000–9000m3 and early twentieth-century barley yields (1200kg/ha) in the Çorum region of Central Anatolia (Stratil-Sauer Reference Stratil-Sauer1933; these calculations are based on the assessment that one tonne of cereal grain fills approximately 1.27m3 of storage space). Instead, the results of this multi-stranded archaeobotanical investigation suggest that the silo was used for the collection and amalgamation of taxed arable produce from a variety of relatively extensive agricultural regimes.
Results from the combined stable isotope analysis and functional ecology, however, have shown that ecological differences between chambers were not pronounced. This suggests that these regimes were not radically different from each other, but rather represent variations on the same basic crop-husbandry pattern characterised by the use of traction to expand potential cultivation areas and the restricted use of manuring and hand-weeding. Variation in crop-growing conditions probably reflects a combination of locations, spatial and social factors, and wealth distribution within the Hattusha hinterland. The availability of human and animal labour, for example, probably varied among communities. Similarly, the distribution and ownership of arable land would also have had an effect on local agroecologies. Ethnographic studies show that agricultural intensity decreases with distance from the settlement (e.g. Jones et al. Reference Jones, Bogaard, Halstead, Charles and Smith1999; Jones Reference Jones2005; Halstead Reference Halstead2014: 207–208). It is plausible that such decreases in management intensity with distance were exacerbated by the expanding amount of land under cultivation and the increasing need for larger harvests due to local urban growth and the wider regional demands of the state.
The politics of taxation
Taxation in the Hittite state was based around the assessment of the agricultural output and labour force of the individual household. The Hittite Law Code records that all inhabitants (excluding the elite) were subject to two forms of ‘taxation’. The luzzi service required each household to provide workers and livestock to cultivate crown lands twice a week (Yakar Reference Yakar2000: 267). Local governors controlled this service, and the crown owned any resulting produce. The second system was the sahhan, a tax that required a portion of all crops, livestock, secondary products and manufactured goods to be paid to the crown (Yakar Reference Yakar2000: 267). Bryce (Reference Bryce2002: 77) has suggested that the Hattusha facility was a storage depot for produce generated via the sahhan or luzzi taxation systems. The range of crop-growing conditions indicated by our agroecological data supports this interpretation, although it would be impossible to distinguish between these two means of taxation using archaeobotanical evidence. It is possible that particular chambers within the silo were used to store cereals from particular rural districts or crown land estates in the Hattusha hinterland. Different settlements would necessarily employ somewhat distinct crop-husbandry schemes, due to the quality, quantity and topography of their arable land, as well as their access to human and animal labour. Overall, however, the nature of agriculture practised by Hittite farmers to generate crops for tax appears to have been broadly similar in that they produced relatively stress-tolerant cereals using extensive, low-input methods.
The Hattusha silo also visibly represents both the power of the Hittite state to mobilise vast quantities of grain and its intervention in the agricultural economy. As recently synthesised in Scott's Against the grain (Reference Scott2017), early states made widespread use of cereals as the basis for taxation, due to the ease with which cereals could be monitored and stored by tax collectors (Scott Reference Scott2017: 21). Cereals are also easier to harvest and transport on a large scale compared to pulse crops (Halstead Reference Halstead2014: 103, 105, 114). While large-scale, hermetic underground storage was evidently used for hulled cereals at Hattusha, free-threshing cereals and pulses may have been kept above ground in large storage vessels (Neef Reference Neef2001).
The construction of the underground silo at Hattusha shortly after the establishment of the city itself, and its placement in direct view of the royal acropolis (Seeher Reference Seeher2006: 49), attest to the importance of taxed cereal grain as a tangible manifestation of the Hittite king's wealth and success. Ironically, however, the hubris of amalgamating and storing large quantities of surplus arable produce increased the state's vulnerability to catastrophic loss, as evidenced by the subsequent destruction of the silo. Whatever the eventual intended use of this produce—emergency famine supplies, seed corn or animal fodder, for example (see Diffey et al. Reference Diffey, Neef, Bogaard and Schachner2017; cf. Privitera Reference Privitera2014)—the fire would have been catastrophic, and it may have taken years to recover. Moreover, the fact that the ruined grain was not removed and the damaged chambers were never reused indicates that the Hittite state may have chosen not to centralise crop storage on such a large scale after this event. At around the time of the silo's (partial) destruction, individual pit silos (silos 8, 9 and 11) were established farther to the north within the Lower City, on Büyükkaya (Figure 1) (Seeher Reference Seeher and Seeher2017: 57–62). These new silos were less vulnerable to catastrophic loss, as they were smaller in scale and more widely dispersed. It is unclear whether these features were used contemporaneously with the Hattusha silo, or were constructed after the fire. Subsequently, in the late fourteenth/early thirteenth century BC, smaller pit silos were constructed on the lower and middle plateaux of Büyükkaya (Seeher Reference Seeher and Seeher2017: 66–73).
Conclusions
Through a multi-stranded archaeobotanical analysis of plant remains recovered from the underground silo at Hattusha, we have revealed a detailed snapshot of Hittite agriculture in the early sixteenth century BC. Hittite farmers fulfilled their tax obligations by engaging in low-input production of cereals that provided reasonable yields even under marginal growing conditions. The separation of results by silo chamber, however, has also highlighted the level of variation that existed within this relatively extensive system, and has revealed the existence of multiple, distinct farming regimes. This range of crop-husbandry regimes, as denoted by crop stable isotope analysis and functional ecological analysis of associated weed flora, indicates appreciable agroecological variability, suggesting that some farmers had access to better watered soils and supplies of manure, as well as animal and human labour. This study provides new insight into the mobilisation of arable produce by the Hittite state. The size and placement of the silo within the city walls attests to the political importance of crop storage, as well as the power derived from controlling large-scale surplus. Crops from the silo appear to have had distinct origins, demonstrating that the royal administration was able to tax the production of a varied agricultural economy across its rural hinterland. This detailed reconstruction of Hittite agroecology suggests that large-scale, extensive cereal production was a key state-sponsored economic strategy, with implications for the promotion of land-based wealth inequality (Bogaard et al. Reference Bogaard2019) and the territorial expansionism of many ancient states.
Acknowledgements
The archaeobotanical work reported here was funded by the European Research Council (AGRICURB project, grant 312785, PI A. Bogaard) and awards from the Wolfson-Marriot-Archaeology-Graduate Scholarship, the Royal Pinner School and the Leverhulme Trade Charities Trust to C. Diffey for graduate study at Oxford. Many thanks to Elizabeth Stroud for help with the stable isotope work and useful comments on this paper; two anonymous reviewers also provided constructive feedback.
Supplementary material
To view supplementary material for this article, please visit https://doi.org/10.15184/aqy.2020.172