





Introduction
Livestock animals such as cattle and sheep are significant contributors to methane (CH4) emissions. Methane is a highly potent global warming greenhouse gas (GHG) that is nearly 80 times more potent than CO2 over a 20-year period, and therefore great attention has been paid to reducing CH4 emissions (Sobanaa et al., Reference Sobanaa, Prathiviraj, Selvin and Prathaban2024). Within the livestock sector, ruminants and their associated activities are the main sources of GHG emissions, which account for nearly 80% of the total from that sector (Opio et al., Reference Opio, Gerber, Mottet, Falcucci, Tempio, MacLeod, Vellinga, Henderson and Steinfeld2013). Aside from this global environmental issue, CH4 emissions also account for a 2–12% loss of total ingested energy from the rumen (Moss et al., Reference Moss, Jouany and Newbold2000), which could otherwise be used for bodyweight gain and associated productivity (Tseten et al., Reference Tseten, Sanjorjo, Kwon and Kim2022). By enteric fermentation in their gut (rumen), several types of gases are produced, especially carbon dioxide (CO2) and hydrogen (H2). The specific microbial group known as methanogenic archaea utilizes those two gases and generates CH4 as their byproduct, which is expelled into the atmosphere through cattle burping (Kumar and Paswan, Reference Kumar and Paswan2022; Ahmed et al., Reference Ahmed, Elwakeel, El-Zarkouny and Al-Sagheer2024). This essentially reduces the detrimental effect of accumulated H2 on the normal fermentation process, while CH4 in burps is a significant environmental concern. To complete the whole cycle of methanogenesis, methanogens, mostly archaea, often depend on other microorganisms, such as bacteria, protozoa, fungi, and nematodes, for nutrient supply in what is commonly referred to as a ‘symbiotic relationship’ (Hook et al., Reference Hook, Wright and McBride2010; Toyber et al., Reference Toyber, Kumar and Jami2024). Intriguingly, apart from methanogens, the symbiotic relationship of these microorganisms may also contribute to ~37% of total enteric CH4 yield in the rumen (Hegarty et al., Reference Hegarty, Goopy, Herd and McCorkell2007). In addition, Fox et al. (Reference Fox, Smith, Houdijk, Athanasiadou and Hutchings2018) reported that ubiquitous parasites, including nematodes, can drive a 33% increase in ruminal CH4 yield and impact ruminant production.
Moreover, in addition to ruminal microbes, physicochemical parameters such as pH, oxidation-reduction potential (ORP), electrical conductivity (EC), and dissolved oxygen (DO) in the rumen fluid can also regulate enteric fermentation as well as CH4 yield (Hook et al., Reference Hook, Wright and McBride2010). Hence, any alterations or influences on microbial diversity and physicochemical parameters in the rumen may impact CH4 yield in the rumen (Morgavi et al., Reference Morgavi, Forano, Martin and Newbold2010; Savin et al., Reference Savin, Moate, Williams, Bath, Hemsworth, Wang, Ram, Zawadzki, Rochfort and Cocks2022). In this case, the use of feed additives or supplements offers a straightforward and cost-effective approach to influence both microbial diversity and physicochemical parameters, thereby mitigating CH4 emissions in the cattle industry (Kebreab et al., Reference Kebreab, Strathe, Fadel, Moraes and France2010; Haque, Reference Haque2018). However, the reduction of CH4 production in the rumen through natural (e.g. plant extracts, polyphenolic compounds, and oils) and chemical (e.g. 3-nitrooxypropanol, bromoform, ionophores, nitrate, halogenated compounds) supplements shows signs of progress (Honan et al., Reference Honan, Feng, Tricarico and Kebreab2021; Króliczewska et al., Reference Króliczewska, Pecka-Kiełb and Bujok2023; Lileikis et al., Reference Lileikis, Nainiene, Bliznikas and Uchockis2023; Ahmed and Nishida, Reference Ahmed and Nishida2024). In some cases, these chemicals are also stabilized on minerals, e.g. clay minerals and zeolites, while these minerals are also used directly as methane inhibitory supplements. Bentonite, zeolite, saponite, montmorillonite, and, in a few instances, kaolin have been used (Tate et al., Reference Tate, Yuan, Theng, Churchman, Singh and Berben2015; El-Nile et al., Reference El-Nile, Elazab, El-Zaiat, El-Azrak, Elkomy, Sallam and Soltan2021; Soltan et al., Reference Soltan, Morsy, Hashem, Elazab, Sultan, Marey, Lail, El-Desoky, Hosny, Mahdy, Hafez and Sallam2021; Ibrahimi Khoram Abadi et al., Reference Ibrahimi Khoram Abadi, Heydari and Kazemi2024; Islam et al., Reference Islam, Naidu and Biswas2025b; Pikhtirova et al., Reference Pikhtirova, Pecka-Kielb, Kroliczewska, Zachwieja, Kroliczewski and Kupczynski2024).
For clay minerals used as methane-inhibiting feed supplements, the preference is for those that have been used historically in geophagy, which have superior palatability, and which are abundant and accessible (Tate et al., Reference Tate, Yuan, Theng, Churchman, Singh and Berben2015; Liu et al., Reference Liu, Dong, Agrawal, Singh, Zhang and Wang2016; Li et al., Reference Li, Zhou, Fiore and Yu2019a). For example, mineral additives used in rumen studies include montmorillonite-rich clays such as bentonite, and fibrous clays such as sepiolite; these materials have been reported to influence rumen physicochemical conditions, particularly pH and nitrogen metabolism (Amanzougarene and Fondevila, Reference Amanzougarene and Fondevila2022; Pikhtirova et al., Reference Pikhtirova, Pecka-Kielb, Kroliczewska, Zachwieja, Kroliczewski and Kupczynski2024). However, their effects on methane production remain inconsistent and are often not the primary focus of such studies. Kaolinite has received attention as a methane-mitigating feed additive (Tate et al., Reference Tate, Yuan, Theng, Churchman, Singh and Berben2015). Since 2015, little in the way of relevant research on this mineral has been carried out, until Islam et al. (Reference Islam, Naidu and Biswas2025b) reported methane inhibition without major disruption of fermentation. In both of those studies, platy surfaces and exposed negative-charge features might have contributed to the outcomes (Tate et al., Reference Tate, Yuan, Theng, Churchman, Singh and Berben2015; Islam et al., Reference Islam, Naidu and Biswas2025b).
Kaolin consists of layered aluminosilicate minerals occurring naturally in soils, sediments, and the upper brittle crust of the Earth. Its dominant form is kaolinite, the layered crystal structure of which is usually platy, stacked together by hydrogen bonding (Biswas et al., Reference Biswas, Islam, Deb, Greenaway, Warr and Naidu2023). However, natural kaolin deposits vary widely in composition and often contain both platy kaolinite and tubular halloysite. Many previous studies treated ‘clay’ as a generic functional additive without detailed mineralogical constraints or assessment of mineral stability under rumen-like conditions (Damato et al., Reference Damato, Vianello, Novelli, Balzan, Gianesella, Giaretta and Gabai2022). This limits mechanistic interpretation, particularly where methane mitigation may arise from surface-driven attachment or immobilization processes rather than broad restructuring of the bacterial community (Hosen et al., Reference Hosen, Islam, Naidu and Biswas2025).
Moreover, it is also important to distinguish between processed and natural minerals. In this context, pure or pristine kaolinite refers to a refined and high-purity material free of accessory minerals. This form is expensive, making it unfavorable for livestock industries where input costs increase due to raw materials. In contrast, the raw kaolin matrix may contain a mixed assemblage of unprocessed kaolinite, halloysite, and other minor minerals. These clay minerals are more suitable for this industry provided that they are fit for purpose (Biswas et al., Reference Biswas, Islam, Deb, Greenaway, Warr and Naidu2023). Halloysite commonly occurs as nanotubes with a large surface area and both inner and outer reactive surfaces. These physical properties distinguish it from platy kaolinite, swelling smectites, and framework zeolites (Zhao et al., Reference Zhao, Abdullayev, Vasiliev and Lvov2013). Kaolinite is non-swelling and relatively chemically inert (Murray, Reference Murray2007; Churchman and Lowe, Reference Churchman and Lowe2012) and so is expected to influence the rumen ecosystem mainly through surface-mediated physical interactions such as attachment or immobilization, rather than through bulk chemical or ion-exchange effects. However, many natural kaolin deposits contain significant amounts of halloysite in addition to kaolinite (Biswas et al., Reference Biswas, Islam, Deb, Greenaway, Warr and Naidu2023), which increases the overall surface reactivity of the raw kaolin assemblage and enhances its potential for surface-mediated interactions. For these reasons, a natural halloysite-bearing raw kaolin assemblage was selected for the present study to evaluate the role of surface-mediated physical interactions under rumen-like conditions.
Despite increasing interest in mineral-based feed additives for methane mitigation, the behavior of kaolin containing a halloysite-kaolinite mixture under ruminal conditions remains poorly understood. In particular, its effects on methane production, mineral stability, and surface-mediated interactions with ruminal (micro)biota are limited. The present study tested the hypothesis that a raw halloysite-kaolinite mixed mineral can reduce ruminal methane production without disrupting normal fermentation conditions. This effect is expected to occur mainly through mineral–biota interactions, rather than through broad shifts only in bacterial community structure. This hypothesis was evaluated in an in vitro rumen fermentation system using an integrated mineralogical, physicochemical, and (micro)biological approach.
Materials and methods
Characterization of kaolin
The kaolin (Kn) clay used here (containing 39% halloysite and 43% kaolinite along with other ancillary minerals) was sourced from the Noombenberry region, on the west coast of Australia (deposit: Cloud Nine, Western Australia) (Biswas et al., Reference Biswas, Islam, Deb, Greenaway, Warr and Naidu2023). The raw matrix was air-core drilled crust. It was then hand-ground with a mortar and pestle to obtain a random powder form (Supplementary material, Fig. S1). The present study refers to this form of clay as ‘NKnC’. Random powders of NKnC were prepared by packing them into the sample holder of an X-ray diffractometer (XRD) (PANalytical Empyrean, The Netherlands) and scanned with a CuKα X-ray beam. The raw pattern was used to identify mineral content using X’pert HighScore software and the PDF-4/Minerals 2022 database from the International Center for Diffraction Data (Degen et al., Reference Degen, Sadki, Bron, König and Nénert2014). Platinum-coated samples, 4 nm thick, were imaged by scanning electron microscopy (SEM) at various magnifications (ZEISS VP Sigma, Germany). The elemental compositions of the samples were quantified using energy-dispersive X-ray spectroscopy (EDS) equipped with the same SEM. The spectra were recorded under an 10–20 kV accelerating voltage.
Collection of rumen fluid and preparation of the buffer solutions
Grass-fed ruminal fluid (RF) was collected from a nearby abattoir immediately after slaughtering the cattle, following the method described by Fortina et al. (Reference Fortina, Glorio Patrucco, Barbera and Tassone2022). Three cattle were selected randomly, and the RF was extracted by squeezing the contents through four layers of cheesecloth, with anaerobic conditions maintained by continuous CO2 purging. The collected samples were promptly transported to the laboratory, maintaining rumen environmental conditions (e.g. anaerobic conditions at 39°C) for in vitro fermentation study (Supplementary material, Fig. S2). Visiting the abattoir, collection of rumen fluid, handling of it and subsequent laboratory experiments were approved by the Animal Ethics Committee of the University of Newcastle (Approval No. 27/2022). A freshly prepared artificial saliva buffer and a reducing agent were mixed (in a 25:1 ratio) and used to prepare the rumen inoculum (McDougall, Reference McDougall1948; Tate et al., Reference Tate, Yuan, Theng, Churchman, Singh and Berben2015).
Rumen fermentation set-up and analytical parameters
Rumen fermentation and gas analysis
An in vitro rumen fermentation experiment was conducted using the ANKOM Gas Production System (ANKOM Technology, Macedon, NY, USA), designed specifically to simulate the rumen environment. Each 250 mL bottle (Supplementary material, Fig. S3) was loaded with 2 g of diet (dry matter basis), consisting of 1 g of grass and 1 g of grain feed. Then, 6% NKnC (on a total dry matter basis) was incorporated into the bottles and mixed thoroughly with the other constituents. The inclusion level was selected based on reports showing that clay minerals can be used safely in ruminant diets at levels up to ~5% of dietary dry matter in vivo (Nadziakiewicza et al., Reference Nadziakiewicza, Kehoe and Micek2019). A slightly larger proportion (6%) was applied in the present in vitro experiment to increase sensitivity for detecting treatment effects, without concerns related to animal tolerance. Each bottle was then inoculated with 120 mL of a mixture of ruminal fluid and freshly prepared buffer solution, ensuring a 1:3 ratio (v/v). The bottles were shaken continuously during incubation to ensure homogeneous dispersion of the clay in the fermentation medium. A similar sample prepared without the addition of NKnC served as a control (non-clay = NC) group. The headspace of each bottle was flushed with N2 gas for 1 min to maintain anaerobic conditions. The bottles were then sealed promptly and placed in a shaker water bath (JULABO SW22, Seelbach, Germany) under controlled temperature (~39°C) and agitation (80 rpm) (Supplementary material, Fig. S4).
The gas pressure monitor software was configured to record cumulative pressure every 20 min continuously over a 48 h period. After each pressure reading, manual flask-shaking was performed. The gas-pressure measurements were converted into moles of gas produced using the ideal gas law and further converted to milliliters of gas using Avogadro’s law (ANKOM, 2023). Details are provided in the Supplementary material (i.e. calculation of the gas volume and, hence, of methane production). The cumulative gas pressure, referred to as total gas production, at 48 h was expressed in milliliters according to the ANKOM protocol. The concentration of the CH4 gas was measured using a laser detector (Gazomat Inspectra Laser, Bischheim, France), which can measure the CH4 concentrations down to <1 ppm (Muir et al., Reference Muir, Behrendt, Moniruzzaman, Kearney, Knight and Thomas2021). Thus, CH4 production (mL) was calculated using the following equation (Pikhtirova et al., Reference Pikhtirova, Pecka-Kielb, Kroliczewska, Zachwieja, Kroliczewski and Kupczynski2024):

In addition to methane, rumen fermentation produces mainly CO2 and small amounts of H2; however, only CH4 was quantified in the present study, however, because it is the primary greenhouse gas of concern associated with enteric fermentation.
Measurement of physicochemical parameters and volatile fatty acids
To measure the physicochemical parameters such as DO, pH, EC, and ORP, the present study conducted an additional experiment parallel to the gas experiment, separate from the ANKOM bottle system (Supplementary material, Fig. S5). In this parallel set-up, the internal pressure and environmental conditions were maintained identically to those in the ANKOM system. After each opening and during the measurement process, the bottles were purged continuously with N2 gas until the caps were sealed securely. The physicochemical parameters were recorded periodically using the Orion Versa Star Pro pH/ISE/Conductivity/Dissolved Oxygen Multiparameter Benchtop Meter (Thermo Fisher Scientific, Waltham, MA, USA). The VFAs were quantified using gas chromatography (GC) coupled with flame ionization detection (FID) (GC-FID, Agilent 7697A, USA). After the end of the experiment, the rumen inoculum was mixed with 25% (w/v) metaphosphoric acid (HPO₃) in a 1:10 ratio, homogenized and incubated at 4°C for 5 min to precipitate proteins. Following centrifugation, the supernatant was diluted 10 times with a methanol:water (1:1 ratio) solution and analyzed using GC-FID, as detailed by Islam et al. (Reference Islam, Naidu and Biswas2025b). Detailed instrument configuration is reported in the Supplementary material (section on ‘GC-FID: Analytical conditions and instrumentation’).
For 48 h post-fermentation analysis, samples from the two parallel set-ups (ANKOM and non-ANKOM bottle systems) were pooled to increase sample quantity. In this case, triplicate samples from relevant groups were mixed thoroughly until homogeneous, and ~100 mL was collected for subsequent analyses. One part was stored at −20°C with 25% glycerol for short-term preservation to minimize cell damage and to maintain microbial viability for subsequent analyses, such as 16S rRNA sequencing, post-fermentation XRD, and dissolution studies. Another portion was prepared for microscopic examination, including light microscopy and scanning electron microscopy (SEM).
Microbial diversity and functional community
DNA extraction, amplification, sequencing, and diversity analysis
The experimental design consisted of three groups: fresh rumen fluid without added feed and buffer, and two fermented sample groups (as described in the ‘Rumen fermentation set-up and analytical parameters’ section above). For each experimental group, three independent fermentation replicates were prepared. To manage sequencing cost, two of the three biological replicates per group were randomly selected for DNA extraction and 16S rRNA gene sequencing. Because the 16S rRNA sequencing was intended as an exploratory screening, the resulting microbial data should be interpreted as indicative of major trends rather than as a definitive assessment of subtle community differences. The genomic DNA of the fermented rumen samples was extracted using the DNeasy PowerSoil Kit (QIAGEN GmbH, Hilden, Germany) as reported by Myer et al. (Reference Myer, Kim, Freetly and Smith2016). To amplify the target region, the V1–V9 hypervariable regions of the 16S rRNA gene were selected, which provide comprehensive phylogenetic insights across diverse bacterial taxa. Universal primers, 27F (5’-AGAGTTTGATCCTGGCTCAG-3’) and 1392R (5’-GACGGGCGGTGTGTAC-3’), were used for PCR amplification. These primers are widely employed in bacterial diversity studies for their broad coverage and specificity. The DNA library preparation was performed according to the standard Pacific Biosciences protocol. Amplicons generated by PCR were end-repaired, ligated to SMRTbell adapters, and size-selected to ensure optimal sequencing performance. Then, the long-read (V1–V9) 16S rRNA gene sequencing was conducted using third-generation sequencing technology from Pacific Biosciences, specifically the Single Molecule, Real-Time (SMRT) platform. This advanced sequencing technology enables high-resolution analysis of the bacterial community structure and diversity by capturing the entire 16S rRNA gene. Taxonomic assignment of amplicon sequence variants (ASVs) was performed using the Genome Taxonomy Database (GTDB), ensuring accurate and up-to-date classification of microbial taxa (Khoza et al., Reference Khoza, Byaruhanga, Makgabo, Nyangiwe, Mnisi, Nxumalo, Oosthuizen and Mnisi2024; Pascoal et al., Reference Pascoal, Duarte, Assmy, Costa and Magalhaes2024). To generate high-quality ASVs suitable for taxonomic classification, raw 16S rRNA sequencing reads were first demultiplexed and trimmed to remove primers and adapters. Quality filtering was performed to eliminate low-quality reads and those with ambiguous bases. High-quality reads were then denoised, and exact ASVs were inferred using the DADA2 pipeline, which also removed chimeric sequences. Singleton and low-abundance ASVs were filtered out to reduce artifacts. Raw sequencing data were processed using the Quantitative Insights into Microbial Ecology version 2 (QIIME2) software, a widely used online pipeline for microbiome analyses. It transforms raw sequences into taxonomic bar plots, relative abundance profiles, principal coordinates analyses, and other visualizations of microbial diversity (Hall and Beiko, Reference Hall and Beiko2018). The 16S rRNA gene sequences of rumen microbes have been submitted to the NCBI GenBank under accession numbers PRJNA1263699 for RF, PRJNA1263691 for NC, and PRJNA1263688 for NKnC.
Functional prediction and pathway analysis
The predicted metabolic pathways were inferred from the 16S rRNA (V1–V9) long-read sequencing data using PICRUSt2, which generated KEGG Orthology and MetaCyc pathway abundances from the unstratified metagenome output (Douglas et al., Reference Douglas, Maffei, Zaneveld, Yurgel, Brown, Taylor, Huttenhower and Langille2019; Fregulia et al., Reference Fregulia, Campos, Dias, Liu, Guo, Pereira, Machado, Faza, Guan, Garnsworthy and Neves2022). This approach enabled a comprehensive assessment of bacterial-functional capabilities related to metabolism, fermentation pathways, and other key rumen-related functions. To evaluate the functional potential of key microbial communities, predicted enzyme profiles and pathway contributions were examined for major rumen guilds, including cellulolytic, proteolytic, and fermentative bacteria. This approach follows established practices for linking microbial community structure to functional capacity in rumen microbiome research (Langille et al., Reference Langille, Zaneveld, Caporaso, McDonald, Knights, Reyes, Clemente, Burkepile, Vega Thurber, Knight, Beiko and Huttenhower2013). All visualizations related to functional prediction and pathway analysis were performed using R version 4.5.2.
Microscopic imaging
Optical microscopy
In this experiment, 10 μL of freshly collected fermented sample (as noted in the ‘Rumen fermentation set-up and analytical parameters’ section above) were placed onto a glass slide and dried using a vacuum dryer to fix the samples. This drying process was necessary to ensure compatibility with SEM analysis (as detailed in the section ‘Electron microscopy with EDS of nematodes’ below), as the same sample slides were used for this purpose. Image acquisition was facilitated using ZEISS ZEN lite software (Carl Zeiss AG, Oberkochen, Germany) equipped with a Zeiss Axiocam 712 color camera. A 0.1 M phosphate-buffered saline (PBS) solution and 2.5% glutaraldehyde were used to chill and fix the microbial cells, ensuring optimal preservation of cellular structure while maintaining a physiological pH of ~7.2–7.4. However, it is always challenging to obtain clear images of microbes or nematodes from turbid samples in the rumen environment (Hosen et al., Reference Hosen, Islam, Naidu and Biswas2025), which were optimized using a sample-dilution method. The same samples with the same slides were also used for SEM analysis.
Electron microscopy with EDS of nematodes
After light microscopic analysis, the slide (with specimen) was cut, using a diamond tip (Sigma-Aldrich, Australia), to a suitable size (approximately 10 × 10 mm) for mounting on SEM stubs. Platinum-coated (4 nm thick) samples were imaged by SEM at various magnifications (Zeiss VP Sigma, Germany). The identification of clay-nematode attachment was performed using a focused beam of high-energy electrons to generate a variety of signals at the surface of solid specimens. The elemental composition of the selected particles was determined using EDS spectra (as reported in the characterization of kaolin).
Post-fermentation XRD and elemental dissolution analyses of kaolin
At the end of 48 h of incubation (described in the ‘Rumen fermentation set-up and analytical parameters’ section above), the three replicates of each group of well-mixed rumen fluids were pooled into a single vial. This was necessary to obtain an adequate quantity of dry matter for reliable XRD analysis of the clay particles nested in the fluid. The sample was subsequently centrifuged at 5000 rpm (~2795 g-force) for 5 min. The supernatant was collected for elemental dissolution analysis, while the pellet was freeze-dried using an Alpha 1–4 LSCplus freeze dryer (Christ, Osterode am Harz, Germany).The dried residues were then powdered using a mortar and pestle prior to XRD analysis. The resultant diffraction patterns were analyzed using X’Pert HighScore software in conjunction with the PDF-4/Minerals ICDD 2022 database to determine the mineralogical composition (Degen et al., Reference Degen, Sadki, Bron, König and Nénert2014) . The quartz-to-kaolinite peak intensity ratio was used as an indicator of mineralogical changes and kaolin stability following microbial interaction, a method commonly employed in kaolinite transformation studies (Makó et al., Reference Makó, Frost, Kristóf and Horváth2001; Li et al., Reference Li, Xia, Wen and Xie2019b). The d 001 peak at 12.4°2θ and the 101 peak at 26.63°2θ were used for kaolinite and quartz, respectively. Dissolution of kaolin after fermentation was assessed using inductively coupled plasma optical emission spectroscopy (ICP-OES, Avio 200, PerkinElmer Inc., Waltham, MA, USA).
Quality control and statistical analysis
Triplicate samples were taken for each experimental group in every batch of the analysis, with a control group subsequently included for comparison. Freshly prepared inoculum was used consistently to ensure appropriate rumen environmental conditions for microbial growth and reliable results (Lagier et al., Reference Lagier, Edouard, Pagnier, Mediannikov, Drancourt and Raoult2015). Standard capsule validation tests were performed to verify the in vitro rumen system functionality, and the functionality of gas pressure monitoring (GPM) software (Islam et al., Reference Islam, Naidu and Biswas2025b). However, without live animal experiments, analyses of the fate of clay minerals may be biased due to the absence of natural physiological processes, such as material excretion. To address this limitation, a comparative analysis of NKnC was conducted before and after 48 h of in vitro ruminal fermentation. This set-up included rumen fluid, clays, feed, and buffer, without the excretion processes seen in vivo. All imaging and statistical analyses were performed using MS-Excel, PowerPoint, and IBM SPSS Statistics (v29.0) with a 95% confidence level. The mean, standard deviation (SD), and statistical significance (p < 0.05) difference between the variables were calculated using an independent sample t-test. The acetic to propionic acid ratios were determined by descriptive statistical analysis.
Results and Discussion
Mineral assemblages and composition of kaolin
The platy kaolinite and tubular halloysite within the kaolin assemblage were identified using SEM, while EDS analysis revealed the elemental compositions of the clays (Fig. 1A). These indicate an approximate 1:1 ratio of Al to Si, which is characteristic of the structural composition of kaolin minerals. Iron was detected as an impurity, as previously reported (Biswas et al., Reference Biswas, Islam, Deb, Greenaway, Warr and Naidu2023). The kaolin, containing its polymorphs kaolinite and the 7 Å variant of halloysite, is also characterized by an XRD d 001 reflection at 7.1 Å (= 12.4°2θ). Feldspar and quartz were also detected as impurities (Fig. 1B). A small amount of mica or illite (d 001 = 10.0 Å at 8.8°2θ) was identified in the kaolin assemblage.
(A) SEM image for surface morphology and EDS spectrum for elemental composition analysis of NKnC (Pt = platinum, originated from the coating material); and (B) XRD peak analysis for mineralogical assemblage (* = kaolin; ∆ = mica/illite; Φ = K-feldspar; θ = quartz). Further details on the elemental composition and magnified SEM images of NKnC are provided in the Supplementary material (Fig. S6 and Fig. S7, respectively).

Figure 1. Long description
Panel A shows a grayscale SEM micrograph of a large, irregular mineral particle with a rough, flaky surface. A yellow box in the center highlights a region containing Kaolinite and Halloysite, indicated by yellow arrows. Overlaid at the bottom is an EDS spectrum with Energy in keV on the x-axis ranging from 0.2 to 4.2. Labeled peaks include C, O, Fe, Al, Si, P t, and K. The Al and Si peaks are the most prominent.
Panel B is an XRD diffractogram. The y-axis is Relative Intensity in arbitrary units ranging from 0 to 40,000. The x-axis is 2 theta degrees ranging from 5 to 60. The data shows several sharp vertical peaks.
* A small peak at approximately 9 degrees is labeled with delta for mica or illite.
* The highest peak at approximately 12 degrees is labeled with an asterisk for kaolin.
* A cluster near 20 degrees includes peaks labeled with an asterisk and Phi for K-feldspar.
* A second very high peak at approximately 25 degrees is labeled with an asterisk.
* Adjacent peaks at 27 and 28 degrees are labeled theta for quartz and Phi for K-feldspar.
* Smaller peaks labeled with asterisks continue at approximately 38, 46, and 55 degrees.
Effects of kaolin on CH4 production and rumen fermentation
Effects on CH4 production and energy metabolism
The NKnC-treated group showed significantly lower total gas and CH4 production in the rumen environment compared with the NC group (p < 0.05), with reductions of 6.5% in total gas and 22.5% in total CH4, respectively. An in vitro study conducted by Pikhtirova et al. (Reference Pikhtirova, Pecka-Kielb, Kroliczewska, Zachwieja, Kroliczewski and Kupczynski2024) demonstrated that 1:1-layered silicate minerals can reduce ruminal CH4 production, while total VFA production did not change significantly, indicating a normal fermentation process in the rumen environment. In this study, a similar trend was observed in the VFA profile (Table 1). Moreover, among the VFAs, the acetic-to-propionic acid ratio in the NKnC group was 2.99±0.03, which is slightly lower than that for NC (3.18±0.01).
Effects of kaolin on methane production and volatile fatty acids in the rumen

Table 1. Long description
The table consists of six columns: Category, Parameters, n, NC (non-clay group), NKnC (natural kaolin group), and p-values. Data are presented as means plus or minus S D.
1. Gas (m L per g of DM):
- Total gas: n = 3. NC is 159.54 plus or minus 5.04. NKnC is 149.10 plus or minus 0.97. p-value is 0.001.
- Methane: n = 3. NC is 36.81 plus or minus 3.66. NKnC is 28.47 plus or minus 1.31. p-value is 0.001.
2. VFAs (m mol per L):
- Acetic acid: n = 3. NC is 64.36 plus or minus 1.95. NKnC is 62.67 plus or minus 3.97. p-value is 0.542.
- Propionic acid: n = 3. NC is 20.26 plus or minus 0.59. NKnC is 20.96 plus or minus 1.15. p-value is 0.399.
- Butyric acid: n = 3. NC is 13.60 plus or minus 0.35. NKnC is 14.12 plus or minus 0.67. p-value is 0.299.
- Valeric acid: n = 3. NC is 1.64 plus or minus 0.06. NKnC is 1.48 plus or minus 0.09. p-value is 0.062.
- A to P ratio: n = 3. NC is 3.18 plus or minus 0.01. NKnC is 2.99 plus or minus 0.03. p-value is not provided.
Footnote indicates that N K n C values for Total gas and Methane are statistically significantly different from N C (p < 0.05).
Data are presented as means ± SD. n = number of samples; NC = non-clay group; NKnC = natural kaolin group; DM = dry matter; VFAs = volatile fatty acids; A = acetic acid; and P = Propionic acid. aStatistically significant difference of the values between the NC and NKnC groups (p < 0.05). p-values were obtained using independent-samples t-tests (two-tailed).
This depletion may contribute substantially to the reduction of CH4 emissions due to the utilization of H2 in the VFA (or propionate) production pathway, as has been reported for saponite clays and other similar materials (Tseten et al., Reference Tseten, Sanjorjo, Kwon and Kim2022; Króliczewska et al., Reference Króliczewska, Pecka-Kiełb and Bujok2023; Pikhtirova et al., Reference Pikhtirova, Pecka-Kielb, Kroliczewska, Zachwieja, Kroliczewski and Kupczynski2024). These findings suggest that kaolin might reduce enteric CH4 emissions by enhancing hydrogen utilization through the propionate production pathway.
Effects on the physicochemical parameters
The physicochemical parameters in the rumen fluid, such as DO, ORP, EC, and pH are the critical factors required to explore the actual condition of ruminal fermentation (Fang, Reference Fang2023; Kolganova, Reference Kolganova2023). In the present study, the key parameters of the rumen fermentation fell within the normal range (Table 2), which is consistent with earlier studies reported for different clay minerals and other additives (Monteils et al., Reference Monteils, Rey, Cauquil, Troegeler-Meynadier, Silberberg and Combes2011; Pikhtirova et al., Reference Pikhtirova, Pecka-Kielb, Kroliczewska, Zachwieja, Kroliczewski and Kupczynski2024; Graham et al., Reference Graham, Thorn, McDonagh, O’Donnell, Nolan, Kirwan, O’Connor, Nzeteu, Montoya, Bartle, Hall, Abberton, Friel, Waters and O’Flaherty2025). Notably, pH remained stable throughout the incubation period (6.76–6.79) and did not differ between the control and NKnC-supplemented groups (Table 2).
Effects of kaolin on the physicochemical parameters in the rumen

Table 2. Long description
The table compares four parameters across two groups, N C and N K n C (n = 3 each), at 12, 24, 36, and 48 hours. Data is mean plus or minus S D.* D O (%):- 12 h: N C 0.67 plus or minus 0.06, N K n C 0.63 plus or minus 0.06, p = 0.519.- 24 h: N C 0.60 plus or minus 0.10, N K n C 0.67 plus or minus 0.06, p = 0.374.- 36 h: N C 0.70 plus or minus 0.10, N K n C 0.67 plus or minus 0.05, p = 0.643.- 48 h: N C 0.60 plus or minus 0.09, N K n C 0.63 plus or minus 0.06, p = 0.643.* O R P (m V):- 12 h: N C minus 139.07 plus or minus 6.15, N K n C minus 140.12 plus or minus 14.26, p = 0.912.- 24 h: N C minus 143.75 plus or minus 27.07, N K n C minus 136.21 plus or minus 9.06, p = 0.671.- 36 h: N C minus 145.33 plus or minus 6.64, N K n C minus 146.92 plus or minus 12.74, p = 0.857.- 48 h: N C minus 143.25 plus or minus 13.36, N K n C minus 145.41 plus or minus 6.92, p = 0.816.* E C (m S/cm):- 12 h: N C 16.36 plus or minus 0.03, N K n C 16.19 plus or minus 0.28, p = 0.347.- 24 h: N C 16.54 plus or minus 0.37, N K n C 16.03 plus or minus 0.08, p = 0.083.- 36 h: N C 16.53 plus or minus 0.43, N K n C 16.59 plus or minus 0.41, p = 0.876.- 48 h: N C 16.31 plus or minus 0.09, N K n C 16.52 plus or minus 0.43, p = 0.503.* p H:- 12 h: N C 6.78 plus or minus 0.02, N K n C 6.78 plus or minus 0.01, p = 0.859.- 24 h: N C 6.77 plus or minus 0.02, N K n C 6.76 plus or minus 0.02, p = 0.678.- 36 h: N C 6.79 plus or minus 0.01, N K n C 6.78 plus or minus 0.02, p = 0.834.- 48 h: N C 6.79 plus or minus 0.02, N K n C 6.79 plus or minus 0.01, p = 0.768.
* DO (percentage): At 12, 24, 36, and 48 hours, values for NC range from 0.60 to 0.70 and for NKnC from 0.63 to 0.67. All p-values are greater than 0.37.
* ORP (m V): Values are negative, ranging from -139.07 to -145.33 for NC and -136.21 to -146.92 for NKnC. All p-values are greater than 0.67.
* E C (mS/cm): Values for NC range from 16.31 to 16.54 and for NKnC from 16.03 to 16.59. All p-values are greater than 0.08.
* pH: Values are stable across all time points, ranging from 6.77 to 6.79 for NC and 6.76 to 6.79 for NKnC. All p-values are greater than 0.67.
Footnote: DO is dissolved oxygen; ORP is oxidation reduction potential; EC is electrical conductivity. p-values were obtained using two-tailed independent-samples t-tests.
Data are presented as means ± SD. n = number of samples; DO = dissolved oxygen; ORP = oxidation- reduction potential; EC = electrical conductivity. p-values were obtained using independent-samples t-tests (two-tailed).
In addition, no significant differences (p > 0.05) were observed in most parameters between the NC and NKnC-supplemented groups. A negligible amount (<1.0% of total volume) of DO indicates that anaerobic conditions were maintained in this in vitro study (Table 2). Over the course of 24 h, the ORP value of the NKnC group (–136.21±9.06) showed a slight increase compared with the NC group (–140.12±14.26). An increasing trend in ORP in the rumen serves as a strong indicator of a shift toward more oxidative conditions. This shift can suppress the activity of methanogenic archaea, ultimately leading to a reduction in methane production by altering microbial fermentation pathways (Zhao et al., Reference Zhao, Caro, Holman, Gzyl, Moate and Chaves2020). However, no consistent trend was observed over time. The results suggest that adding NKnC to the ruminal diet did not substantially alter the measured fermentation parameters or disrupt the overall rumen environment.
Effects of kaolin on the rumen microbes
Bacterial profiling across experimental groups
Following a taxonomy-based analysis of six samples (two from each group), the relative abundances of eight predominant bacterial phyla from a total of 20 phyla are presented (Fig. 2). The rumen of cattle is a complex environment that harbors a diverse array of organisms, including archaea, bacteria, protozoa, fungi, and nematodes (Ahmed et al., Reference Ahmed, Elwakeel, El-Zarkouny and Al-Sagheer2024). However, a broad spectrum of bacterial diversity is presented here based on 16S rRNA sequencing analysis. The bacterial populations in the fresh RF samples were dominated by the phyla Firmicutes (Bacillota as the modern standard name; 47% of total reads), Bacteroidetes (18%), and Proteobacteria (10%) (Fig. 2). After the addition of diet into the rumen inoculum for the NC group, the abundance of these phyla increased to 50%, 23%, and 19%, respectively. Hernandez-Sanabria et al. (Reference Hernandez-Sanabria, Goonewardene, Wang, Durunna, Moore and Guan2012) reported that feed supply in the rumen inoculum can significantly influence the bacterial community profile, leading to shifts in microbial composition and diversity. Compared with the NC group, the relative abundances of the corresponding NKnC groups were 51%, 23%, and 15%, respectively. The most dominant phylum, Firmicutes, in the rumen across the groups represents efficient digestion of plant fibers and production of volatile fatty acids (VFAs), which are a major energy source for the cattle (Du et al., Reference Du, Wang, Gao, Feng, Zhang and Hu2024). Other less abundant phyla (<10% of total reads) included Bacteroidota, Fibrobacter, Desulfobacterota, Spirochaeta, and Kiritimatiellaeota. Approximately 10% of the bacterial population remained unclassified in this analysis. Nevertheless, no statistically significant differences were observed in the relative abundances of bacterial phyla between the NC and NKnC groups, although minor reductions in Proteobacteria (4%) and Bacteroidota (1%) were noted in the NKnC group compared with the NC group. Recent studies indicate that supplementing clay to cattle diets can help stabilize the rumen environment by influencing bacterial activity, particularly of proteolytic bacteria such as Butyrivibrio fibrisolvens (Amanzougarene and Fondevila, Reference Amanzougarene and Fondevila2022).
Microbial community structures of the samples of the cattle rumen. The relative abundance of bacterial 16S rRNA genes was estimated through classification at the phylum level. Each bar represents the mean ± SD of two biological replicates. The transparent area through the bars shows the trend of the major taxa with the various conditions of rumen fluid and their loading rates.

Figure 2. Long description
A stacked bar graph with the Y-axis labeled Relative abundance percent (Taxa : Phylum) ranging from 0 to 100 percent in increments of 10 percent. The X-axis is labeled Experimental groups with three categories: R F, N C, and NKn C.
Each category is represented by a vertical bar with error bars indicating SD. Transparent shaded areas connect the segments between bars to show trends.
From bottom to top, the phyla segments are:
* Firmicutes (dark blue): The largest segment, starting at approximately 47 percent in R F, dipping slightly in N C, and rising to 51 percent in NKn C.
* Bacteroidates (orange): Occupies roughly 18 to 23 percent of the total abundance across all groups.
* Proteobacteria (grey): Shows a slight increase from RF to NC and NKn C.
* Bacteroidota (yellow): Decreases significantly from RF to NC and NKn C.
* Fibrobacterota (light blue): A thin sliver appearing above Bacteroidota.
* Desulfobacterota (light green): A very thin, barely visible segment.
* Spirochaetes (darker blue): A thin segment near the top.
* Kiritimatiellaeota (brown): Present in RF but nearly absent in the other groups.
* Unclassified (dark grey): Occupies the top 10 percent of the RF bar and varies in the others.
The transparent trend lines show a notable expansion of the Firmicutes and Proteobacteria layers while the Bacteroidota and Unclassified layers contract when moving from RF to NKn C.
Kaolin has a large interactive surface area with positively charged aluminum sites that can interact with various microbial communities carrying negative charges (Fomina and Skorochod, Reference Fomina and Skorochod2020; Mitzscherling et al., Reference Mitzscherling, Genderjahn, Schleicher, Bartholomäus, Kallmeyer and Wagner2023). In addition, the adsorption capacity of halloysite may further modulate bacterial diversity and activity, contributing to the observed minor shifts in the rumen microbial community. Therefore, maintaining normal bacterial counts while modulating their activity through clay–microbe interactions offers an effective approach to directly or indirectly suppress their activities to reduce CH4 emissions (Pikhtirova et al., Reference Pikhtirova, Pecka-Kielb, Kroliczewska, Zachwieja, Kroliczewski and Kupczynski2024). The results from this study suggest that kaolin may influence microbial activity through attachment or immobilization rather than altering the bacterial population (Liu et al., Reference Liu, Dong, Agrawal, Singh, Zhang and Wang2016; Svensson et al., Reference Svensson, Behroozian, Xu, Surette, Li and Davies2017).
Distribution of amplicon sequence variants among experimental groups
After data processing, filtering, and removal of chimeras and low-coverage samples from 300,000 reads, a total of 299,872 reads remained, with an average of 99.96% of total reads surviving. However, the percentage of non-chimeric sequences in the three experimental groups (RF, NC, and NKnC) was 22.67%, 45.06%, and 39.03% of all sequences, respectively (Fig. 3A). The average number of reads before quality filtering was 103,729. After quality filtering, the remaining reads (299,872) mapped to 2299 ASVs. Across the groups, the average number of ASVs per sample was 607. A Venn diagram was constructed to visualize the distribution of unique and shared ASVs among the groups (Fig. 3B). The NC group exhibited the largest number of unique ASVs (591), followed by NKnC (515) and RF (483), indicating distinct microbial signatures across the groups.
Quality of sequences and distribution of ASVs among experimental groups. The bar chart (A) and Venn diagram (B) represent the percentages of sequences obtained after filtering and the distribution of shared and unique ASVs among the experimental groups, respectively. Each bar represents the mean ± SD of duplicate analyses.

Figure 3. Long description
Panel A is a bar chart. The y-axis is labeled percent of sequences non-chimeric with a scale from 0 to 50. The x-axis is labeled Experimental groups. Three bars with error bars represent the mean plus or minus SD. From left to right, the green bar for RF is approximately 23 percent. The orange bar for NC is approximately 45 percent. The blue bar for NKnC is approximately 39 percent.
Panel B is a three-set Venn diagram. At the center intersection of all three groups is the value 329.
- The intersection of RF green and NC orange contains 163.
- The intersection of NC orange and NKnC blue contains 142.
- The intersection of RF green and NKnC blue contains 76.
- The unique region for RF contains 483.
- The unique region for NC contains 591.
- The unique region for NKn C contains 515.
The smaller number of unique ASVs in the RF group indicated a low diversity of viable bacteria present before the provision of feed and the rumen environment (Fig. 3B). When the feed was added to the rumen fluid (NC group) in the ANKOM bottle, bacterial diversity increased significantly after fermentation due to the introduction of feed and the favorable rumen environment. The clay-amended group showed lower bacterial diversity (Fig. 3B). Nevertheless, a total of 329 ASVs were shared among all three groups, representing the core microbiome, including genera such as Prevotella, Rikenellaceae, Cladosporium, and Pecoramyces, which play fundamental roles in rumen fermentation and function (Omondi et al., Reference Omondi, Bosire, Onyari, Kibet, Mwasya, Onyonyi and Getahun2024). Moreover, pairwise comparisons revealed that RF and NC exclusively shared 163 ASVs, NC, and NKnC shared 142 ASVs, and RF and NKnC shared 76 ASVs (Fig. 3B). The smaller number of shared ASVs between RF and NKnC (76), compared with the other pairwise overlaps, suggests that clay-treated groups may harbor more divergent bacterial profiles, possibly driven by the feed and the specific effects of halloysite-containing kaolin supplementation. While this study did not directly assess harmful or pathogenic bacteria, the microbial shifts observed may indicate that halloysite-kaolinite mixed mineral has the potential to interact with and attach to bacterial cells, given the known adsorption capacity of this clay. Studies suggest that clay minerals with significant adsorption capacity can bind to harmful microorganisms and metabolites, potentially limiting their activity (Neubauer et al., Reference Neubauer, Humer, Mann, Kroger, Reisinger, Wagner, Zebeli and Petri2019; Amanzougarene and Fondevila, Reference Amanzougarene and Fondevila2022). However, further targeted investigations are needed to substantiate this possibility.
Predicted functional pathway analysis
The top 15 predicted pathways, representing major microbial metabolic processes involved in fiber degradation, central carbon metabolism, amino acid biosynthesis, and fatty acid metabolism, are illustrated in Fig. 4 (Cheng et al., Reference Cheng, Du, Liang, Degen, Wu, Ji, Gao, Xin, Cong and Yang2023; Peng et al., Reference Peng, Chen, Guo, Zhou, Chen, Xu, Su, Xiao and Jiang2024; Du et al., Reference Du, Xu, Zhang, Li, Wang, Li, Han, Gala and Wang2025). Reductions in pathways associated with central carbon processing in the NKnC group, such as NONOXIPENT-PWY (~7%) and CALVIN-PWY (~14%) and amino acid biosynthesis, including ILEUSYN-PWY (~6%), VALSYN-PWY (~6%), and BRANCHED-CHAIN-AA-SYN-PWY (~4%) suggest a decreased microbial energy turnover and biosynthetic potential (Cheng et al., Reference Cheng, Du, Liang, Degen, Wu, Ji, Gao, Xin, Cong and Yang2023; Peng et al., Reference Peng, Chen, Guo, Zhou, Chen, Xu, Su, Xiao and Jiang2024). Notably, Schlattl et al. (Reference Schlattl, Buffler and Windisch2021) reported that these changes may result from reduced nutrient flux or competition for essential trace minerals, such as magnesium, iron, and zinc that serve as enzymatic cofactors. Similarly, downregulation of fatty acid biosynthetic pathways, particularly PWY-5104 (~5%), PWY-5667 (~7%), PWY-5973 (~10%), PWY-7663 (~10%), PWY0-1319 (~7%), PWY-7208 (~7%), PWY-7220 (~4%), and PWY-7229 (~7%), suggests limited precursor and coenzyme availability, potentially affecting microbial-membrane synthesis and population dynamics (Sun et al., Reference Sun, Wang, Ma, Li and Wang2022; Cheng et al., Reference Cheng, Du, Liang, Degen, Wu, Ji, Gao, Xin, Cong and Yang2023; Jiang et al., Reference Jiang, Qin, Xu, Song, Fu, Li, Liu and Shi2024; Peng et al., Reference Peng, Chen, Guo, Zhou, Chen, Xu, Su, Xiao and Jiang2024; Du et al., Reference Du, Xu, Zhang, Li, Wang, Li, Han, Gala and Wang2025).
Predicted abundance of the top 15 MetaCyc microbial metabolic pathways in rumen communities of NC and NKnC groups. The means of the duplicate samples from the groups were used in this graph. Data are presented as means ± SD. The differences between groups were not statistically significant (p > 0.05). Visualization generated using R version 4.5.2.

Figure 4. Long description
The Y-axis is labeled Predicted Abundance with a scale from 0 to 30000 in increments of 10000. The X-axis is labeled Pathways and lists 15 specific MetaCyc codes. A legend on the right identifies blue bars as NC and orange bars as NKnC. Each pathway is represented by a pair of adjacent bars with vertical error bars representing S D.
From left to right, the pathways are:
* NONOXIPENT dash PWY: NC is approximately 29500, NKnC is approximately 27500.
* PWY dash 5101: NC is approximately 26000, NKnC is approximately 24500.
* PWY dash 7111: NC is approximately 27500, NKnC is approximately 24500.
* CALVIN dash PWY: NC is approximately 27000, NKnC is approximately 23500.
* PWY dash 7663: NC is approximately 25000, NKnC is approximately 23000.
* PWY dash 5667: NC is approximately 25500, NKnC is approximately 23500.
* PWY0 dash 1319: NC is approximately 25500, NKnC is approximately 23500.
* ILEUSYN dash PWY: NC is approximately 24000, NKnC is approximately 23000.
* VALSYN dash PWY: NC is approximately 24000, NKnC is approximately 23000.
* PWY dash 7208: NC is approximately 24500, NKnC is approximately 23000.
* PWY dash 5973: NC is approximately 24500, NKnC is approximately 22000.
* PWY dash 5104: NC is approximately 23500, NKnC is approximately 22500.
* BRANCHED dash CHAIN dash AA dash SYN dash PWY: NC is approximately 23500, NKnC is approximately 22500.
* PWY dash 7229: NC is approximately 24500, NKnC is approximately 22500.
* PWY dash 7220: NC is approximately 24500, NKnC is approximately 23500.
Across all pathways, the NC group consistently shows slightly higher predicted abundance than the NKnC group, though the differences are not statistically significant.
It may also restrict microbial adhesion to plant-fiber surfaces, thereby limiting the activity of key fibrolytic taxa (Neubauer et al., Reference Neubauer, Humer, Mann, Kroger, Reisinger, Wagner, Zebeli and Petri2019). Consequently, cellulose (PWY-5101) and hemicellulose (PWY-7111) degradation decreased by ~6% and ~10%, respectively, probably due to enhanced microbial immobilization or altered biofilm formation within the rumen (Hosen et al., Reference Hosen, Islam, Naidu and Biswas2025). Moreover, the mild pH buffering effect of kaolin may further stabilize fermentation, but may also reduce microniche variability, limiting the adaptability of peripheral microbial taxa (Pikhtirova et al., Reference Pikhtirova, Pecka-Kielb, Kroliczewska, Zachwieja, Kroliczewski and Kupczynski2024; Islam et al., Reference Islam, Naidu and Biswas2025b). Collectively, these findings suggest that kaolin modulated the rumen physicochemical environment through its mineral composition and adsorption properties (Damato et al., Reference Damato, Vianello, Novelli, Balzan, Gianesella, Giaretta and Gabai2022). This modulation results in a modest yet system-wide reduction in microbial metabolic potential while maintaining the stability of the core fermentative microbiome (Petri et al., Reference Petri, Schwaiger, Penner, Beauchemin, Forster, McKinnon and McAllister2013; Islam et al., Reference Islam, Naidu and Biswas2025a). However, these shifts in microbial functional pathways were not significant (p > 0.05) (Fig. 4), implying that kaolin supplementation would not substantially affect cattle growth or productive performance substantially.
Functional potential of key metabolic communities
Kaolin supplementation selectively influenced rumen microbial functions, enhancing lipolytic activity by ~36%, while slightly reducing cellulolytic (−3%) and proteolytic (−1%) activities (Fig. 5). The reduced cellulolytic potential, despite the greater relative abundance of fibrolytic taxa, may be due to the physical coating of feed particles by kaolin, which can limit microbial attachment and accessibility to fibrous substrates (Fig. 5A) (Neubauer et al., Reference Neubauer, Humer, Mann, Kroger, Reisinger, Wagner, Zebeli and Petri2019). Efficient cellulose-degrading bacteria such as Ruminococcus and Fibrobacter require firm adherence to fiber surfaces for effective enzyme localization and biofilm formation (Yeoman et al., Reference Yeoman, Fields, Lepercq, Ruiz, Forano, White and Mosoni2021); therefore, clay interference may partly explain the observed decline in cellulolytic enzyme activity.
Effect of dietary kaolin supplementation on ruminal enzyme activities in cattle rumen: (A) cellulolytic enzyme activity; (B) proteolytic enzyme activity; and (C) lipolytic enzyme activity between NC and NKnC. Data are presented as means ± SD.

Figure 5. Long description
A three-panel bar chart labeled A, B, and C. The shared Y-axis is labeled Predicted functional community KO abundance. The shared X-axis is labeled Experimental groups with two categories: NC represented by a blue bar and NKnC represented by an orange bar. All bars include vertical error bars representing S D.
* Panel A: Cellulolytic enzyme activity. The Y-axis scale is in thousands from 0 to 10. The NC bar is at approximately 9 and the NKnC bar is slightly lower at approximately 8.8.
* Panel B: Proteolytic enzyme activity. The Y-axis scale is in thousands from 0 to 35. Both the NC and NKnC bars are nearly equal at approximately 27.
* Panel C: Lipolytic enzyme activity. The Y-axis scale is in thousands from 0 to 15. The NC bar is at approximately 9. The NKnC bar is significantly higher at approximately 12. A bracket connects the two bars with a label p < 0.05, indicating statistical significance.
Proteolytic activity remained stable in the kaolin-supplemented group (Fig. 5B), consistent with previous in vivo observations showing that kaolin inclusion (0–2%) does not alter microbial protein synthesis (Ortiz et al., Reference Ortiz, Montano, Plascencia, Salinas, Torrentera and Zinn2016). Furthermore, Brock et al. (Reference Brock, Forsberg and Buchanan-Smith1982) reported that this stability probably arises because proteolytic bacteria primarily target soluble proteins (~25%) and are less dependent on particle attachment. Consequently, kaolin is unlikely to impede proteolytic processes or nitrogen turnover, aligning with maintained ruminal pH and protein degradation reported in similar studies (Fusi et al., Reference Fusi, Ristori, Calamai and Stotzky1989; Islam et al., Reference Islam, Naidu and Biswas2025b).
Compared with cellulolytic and proteolytic activities, lipolytic potential increased significantly (Fig. 5C), possibly due to the halloysite-kaolinite mixed mineral structure stabilizing lipolytic enzymes and mitigating the inhibitory effects of free fatty acids (Tully et al., Reference Tully, Yendluri and Lvov2016; Massaro et al., Reference Massaro, Noto and Riela2020). These interactions may enhance lipid hydrolysis efficiency and energy release within the rumen. Collectively, kaolin supplementation modestly influenced ruminal enzyme activities, slightly lowering fiber-degrading potential while enhancing lipid metabolism, without adversely affecting protein degradation.
Interactions between kaolin and ruminal nematodes
Microscopic analysis of viable rumen fluid revealed a variety of nematodes and their eggs (Fig. 6). The normal hatching time for ruminal nematode eggs is generally 1–2 days under ideal conditions (VanHoy, Reference VanHoy2023). Various genera, including Haemonchus, Ostertagia, Teladorsagia, Trichostrongylus, Oesophagostomum, and Dictyocaulus, can infect ruminants like cattle, sheep, and goats (Hutchinson, Reference Hutchinson2009). Their abundance in the rumen may further cause gastrointestinal infections that reduce productivity, impair health, and may even lead to death (Hendawy, Reference Hendawy2018). These nematodes can disrupt feed intake, nutrient utilization, and rumen fermentation, altering the rumen microbiome. Such disruptions affect volatile fatty acid (VFA) composition and contribute to increased methane emissions (Fox et al., Reference Fox, Smith, Houdijk, Athanasiadou and Hutchings2018; Fernandes et al., Reference Fernandes, de Mello Tavares Lima, do Amarante, Abdalla and Louvandini2022).
Transmitted light microscope imaging of ruminal nematodes: (A) nematode egg; (B, C, D) various shapes and sizes of the nematodes.

Figure 6. Long description
A four-panel micrograph series labeled A through D. Each panel includes a yellow scale bar in the bottom-right corner representing 100 micrometers.
* Panel A: Top-left. A yellow arrow points leftward toward a circular, translucent nematode egg nestled against a large, dark brown organic mass. The background is filled with granular debris and smaller organic particles.
* Panel B: Top-right. A yellow arrow points toward a thin, elongated nematode body curving through a field of scattered brown organic matter and clear fluid.
* Panel C: Bottom-left. A yellow arrow points to a dark, curved section of a long, slender nematode. The specimen is positioned horizontally across a textured, greyish background.
* Panel D: Bottom-right. A yellow arrow points to a highly detailed section of a nematode showing distinct transverse striations or ring-like segments along its tubular body. The background is lighter with sparse dark particulate matter.
Although nematodes themselves do not produce CH4 directly, their symbiotic associations with methanogenic microorganisms are responsible for >30% of enteric methane production per kilogram of feed intake (Fox et al., Reference Fox, Smith, Houdijk, Athanasiadou and Hutchings2018). In the present study, the SEM analysis revealed a close association between kaolin particles and nematodes, particularly in the head and body regions, as confirmed by EDS spectra (Fig. 7). These interactions were observed consistently even after applying a filtration technique to the same samples (Fig. S8), aligning with these findings. The attachment of kaolin particles to nematodes is most plausibly governed by a combination of surface adsorption and physical trapping mechanisms. The halloysite-kaolinite mixed mineral possesses a large specific surface area, abundant surface hydroxyl groups, and a nanotubular morphology, all of which promote strong interfacial interactions with biological surfaces (Pasbakhsh et al., Reference Pasbakhsh, De Silva, Vahedi and Jock Churchman2018; Dong et al., Reference Dong, Huang, Zhao, Zeng, Liu, Sheng, Shi, Wu, Jiang and Li2022). The elongated and rough external surfaces of nematodes probably facilitate mechanical interlocking of clay particles, while electrostatic and van der Waals forces further stabilize the attachment (Damato et al., Reference Damato, Vianello, Novelli, Balzan, Gianesella, Giaretta and Gabai2022). Although pH can regulate mineral–microbe interactions by altering surface charge (of both the clay minerals and microbial cell walls), the pH remained within a narrow and stable range in this study (6.76–6.79; Table 2). This indicates that pH was not a controlling factor for clay–microbe or clay–nematode attachment under the present experimental conditions (Damato et al., Reference Damato, Vianello, Novelli, Balzan, Gianesella, Giaretta and Gabai2022; Dong et al., Reference Dong, Huang, Zhao, Zeng, Liu, Sheng, Shi, Wu, Jiang and Li2022). Such attachment suggests that kaolin supplementation, particularly with the halloysite-kaolinite mixed mineral with greater adsorption capacity, may influence nematode activity through attachment, immobilization, and possible extermination. It may potentially mitigate their adverse effects on ruminal metabolism and methane yield (McSorley and Frederick, Reference McSorley and Frederick2002; Hosen et al., Reference Hosen, Islam, Naidu and Biswas2025). Therefore, supplementing NKnC in cattle diet may help reduce rumen methanogenesis by modulating nematode-related microbial interactions.
Image A, captured using transmitted light microscopy, shows the full body of the nematode, while images 1, 2, and 3 are sectional views captured by SEM from the same slide, highlighting the tail, head, and body of the nematode. Additionally, images 2′ and 3′ represent the specific point section of EDS spectra of the nematode head and body. The yellow arrows show the areas where the clay attachment with the nematode was confirmed by quantifying its elemental composition analysis using EDS spectra (Pt-coated sample).

Figure 7. Long description
Panel A is a transmitted light micrograph showing a full nematode body with a 100 micrometer scale bar. Yellow brackets and arrows labeled 1, 2, and 3 indicate the tail, head, and body regions respectively.
Panel 1 is an SEM micrograph showing a high-magnification view of the nematode tail resting on a cracked clay substrate.
Panel 2 shows the nematode head with a yellow arrow pointing to Spectrum 1 within a circled region of clay attachment. An overlaid EDS spectrum graph shows intensity peaks for C, O, Na, Al, Si, Pt, S, Cl, and K.
Panel 3 shows the nematode body with a yellow arrow pointing to Spectrum 3. The overlaid EDS spectrum shows similar elemental peaks to panel 2, with a prominent Pt peak from the sample coating.
Panel 2 prime shows a different point on the head labeled Spectrum 2. The EDS spectrum includes peaks for C, O, Na, Mg, Al, Si, Pt, S, Cl, K, and Ca.
Panel 3 prime shows a point on the body labeled Spectrum 4. The EDS spectrum displays peaks for C, O, Na, Al, Si, Pt, S, Cl, and K.
All SEM panels include technical data: WD 8.9 to 10.0 mm and HV 10.00 to 20.00 kV. The x-axis of all spectra represents energy in keV from 0.1 to 5.
Mineralogical change of kaolin in the rumen
While the inclusion of kaolin in the diet clearly contributed to reduced methanogenesis, it is also essential to evaluate the fate of this supplemented mineral under rumen conditions. Such evaluation involves assessing its residual presence, mineralogical changes due to microbial interactions, and potential passage through the gastrointestinal tract. Given the in vitro nature of this study, the fate analysis was limited to the mineralogical aspect of major clay species and elemental dissolution assessments. Although the overall peak intensities declined in both the pre-fermentation clay feed mix and the post-fermentation samples, probably due to sample heterogeneity and interference from organic matter, no new mineral phases were detected. The XRD analysis of solid residues after 48 h of in vitro fermentation revealed no significant mineralogical transformation compared with the clay-feed mash before fermentation (Fig. 8). However, a notable observation was the weakening of the mica/illite reflection (at ~10 Å) following its incorporation into the feed and buffer solution, which was otherwise evident in the raw kaolin (Fig. 1B; Fig. 8).
XRD patterns of the randomized powder samples of clay-feed and clay-feed-biomass composite after 48 h of ruminal fermentation (* = kaolinite/halloysite; Φ = K-feldspar; θ = quartz).

Figure 8. Long description
The X-axis represents 2 theta in degrees from 5 to 60. The Y-axis represents Intensity with an axis offset. Two stacked line plots are shown.
1. The upper plot in orange is labeled Clay-feed and buffer. It shows a prominent sharp peak at approximately 12.5 degrees marked with an asterisk. A broad hump exists between 18 and 24 degrees with a peak marked with asterisk and Phi. Sharp, high-intensity peaks occur at 25 degrees asterisk, 27 degrees theta, and 29.5 degrees Phi. Smaller peaks marked with asterisks continue at 38, 45, and 55 degrees.
2. The lower plot in green is labeled Microbial fermentation. It follows a nearly identical pattern to the top plot, maintaining the same peak positions for kaolinite or halloysite asterisk, K-feldspar Phi, and quartz theta, though the relative intensities of the peaks at 27 and 29.5 degrees appear slightly more pronounced relative to the baseline compared to the top plot.
Legend symbols indicate asterisk equals kaolinite or halloysite, Phi equals K-feldspar, and theta equals quartz.
Grinding of this material could cause crystal damage to mica/illite (Ilić et al., Reference Ilić, Radonjanin, Malešev, Zdujić and Mitrović2016; Biswas et al., Reference Biswas, Islam, Deb, Greenaway, Warr and Naidu2023). However, in the present study, only hand grinding was applied to mix the clay with feed materials before its addition to the buffer. In this context, the weakening of mica/illite reflections in the XRD patterns may be attributed to the dissolution of elements associated with this mineral phase. Notably, the overall intensity of XRD patterns decreased after contact with buffer/rumen fluids compared with the raw clay (Fig. 1B; Fig. 8). This could potentially affect the relative peak intensity of mica/illite (Sánchez-Soto et al., Reference Sánchez-Soto, Eliche-Quesada, Martínez-Martínez, Pérez-Villarejo and Garzón2022). Despite this, the key focus regarding mineral stability during active microbial fermentation remains the kaolinite species. In this regard, the area ratio of the quartz peak (26.63°2θ) to the kaolinite d 001 reflection of (12.4°2θ) increased from 1.10 in the clay–feed mix with buffer to 1.37 in the fermented residue. This shift suggests partial kaolinite dissolution or compositional changes influenced by microbial activity (Supplementary material, Table S1). These findings align with previous studies reporting that, during short-term incubations, microbial activity tends to localize on biofilm formation on quartz surfaces. While this does not alter clay minerals structurally, it may enhance mineral dissolution (Rades-Rohkohl et al., Reference Rades-Rohkohl, Franzle and Hirsch1977; Li et al., Reference Li, Zhou, Fiore and Yu2019a; Fomina and Skorochod, Reference Fomina and Skorochod2020). Therefore, the observed changes in XRD patterns, as well as in SEM and EDS observations, are probably due to a combination of natural sample heterogeneity, limited kaolin dissolution, dilution effects from residual feed particles, and microbial biomass accumulation, rather than significant mineralogical transformation. Furthermore, the elevated silicon (Si) content detected in the post-fermentation solution supports the occurrence of kaolin dissolution. In contrast, aluminum (Al) concentrations remained relatively stable in the leachate, indicating limited net Al release under the same conditions (Table 3). The much greater Si concentration relative to Al in solution does not necessarily indicate selective dissolution of the tetrahedral sheet of kaolin-group minerals. More plausibly, it reflects dissolution of a minor amorphous or poorly crystalline silica component in the raw material (Huertas et al., Reference Huertas, Chou and Wollast1999; Dove et al., Reference Dove, Han, Wallace and De Yoreo2008) and/or preferential removal of Al from solution by re-precipitation as amorphous aluminum hydroxide or incorporation into secondary phases, while Si remains in solution (Xie and Walther, Reference Xie and Walther1992; N’Guessan et al., Reference N’Guessan, Joussein, Courtin-Nomade, Paineau, Soubrand, Grauby, Robin, Cristina, Vantelon, Launois, Fondanèche, Rossignol, Texier-Mandoki and Bourbon2021). Similar decoupling of Si and Al behavior under near-neutral (e.g. pH and charge) conditions has been reported in previous studies (Lützenkirchen et al., Reference Lützenkirchen, Abdelmonem, Weerasooriya, Heberling, Metz and Marsac2014; Gong et al., Reference Gong, Rimstidt, Zhang, Chen and Zhu2019).
Impact of microbial activity on the dissolution of ions from kaolin in the rumen simulation system

Table 3. Long description
The table consists of six columns and two data rows.
Columns from left to right are:
1. Sample groups.
2. Ca (m gL super minus 1).
3. Fe (m gL super minus 1).
4. K (m gL super minus 1).
5. Si (m gL super minus 1).
6. Al (m gL super minus 1).
Data rows:
* NKnC with buffer: Ca 43.13, Fe 0.6, K 666.53, Si 33.28, Al 1.9.
* NKnC with buffer and microbes: Ca 52.18, Fe 1.41, K 676.49, Si 81.11, Al 1.73.
Footnote: Ca equals calcium, Fe equals iron, K equals potassium, Si equals silicon, and Al equals aluminum.
Ca = calcium; Fe = iron; K = potassium; Si = silicon; and Al = aluminum.
Both halloysite and kaolinite share the same 1:1 aluminosilicate structure and can contribute dissolved Si. Therefore, the possibility of a minor contribution from poorly crystalline or amorphous silica cannot be excluded, and the precise mineral source of the released Si cannot be assigned uniquely from the ICP-OES data alone (Zhang et al., Reference Zhang, Wang, Yao and Zhu2012; Klumpp et al., Reference Klumpp, Marcolli, Alonso-Hellweg and Peter2022). However, the dominance of kaolin-group phases in the XRD patterns suggests that partial dissolution of halloysite and/or kaolinite is the most likely origin of the dissolved Si, with halloysite expected to be more reactive due to its greater surface area and nanotubular morphology (Gomes et al., Reference Gomes, Davies, Smith and Jones2021; Klumpp et al., Reference Klumpp, Marcolli, Alonso-Hellweg and Peter2022).
In terms of dissolution of other exchangeable or associated elements, ICP-OES analysis also confirmed the leaching of potassium (K), calcium (Ca), and iron (Fe) into solution after fermentation, suggesting a contribution of dissolved elements potentially from mica/illite, as these are primarily associated with the mineral samples used in the present study (Biswas et al., Reference Biswas, Islam, Deb, Greenaway, Warr and Naidu2023) (Table 3). Although minor amounts of these elements were released from the mineral powder used, their low concentrations and the absence of detectable changes in fermentation chemistry or bacterial-community structure suggest that dissolved species and trace metals were not the primary drivers of methane mitigation in this study (Unal et al., Reference Unal, Perry, Sheth, Gomez-Alvarez, Chin and Nüsslein2012). Specifically, the detection of dissolved Fe in the fermentation leachate suggests partial dissolution or mobilization of Fe-bearing mineral phases such as mica/illite within the kaolin matrix. In these minerals, Fe is typically hosted in the octahedral layer, and its release indicates that microbial activity, likely through the production of organic acids, complexing agents, or redox transformations, has facilitated the mobilization of structurally bound Fe. This biogenic dissolution highlights the susceptibility of Fe-rich phases to microbial alteration under rumen-like anaerobic conditions, even over short-term incubation periods (Liu et al., Reference Liu, Dong, Agrawal, Singh, Zhang and Wang2016; Hosen et al., Reference Hosen, Islam, Naidu and Biswas2025). This structural resilience is consistent with the findings of Liu et al. (Reference Liu, Dong, Agrawal, Singh, Zhang and Wang2016), who reported that microbial interactions with iron-coated kaolinite in the rumen caused only minor alterations in the associated organic coatings (e.g. iron), rather than in the mineral lattice itself.
Usually, microbially-induced processes such as chemical weathering, redox reactions, and acidification can alter clay mineral structures (Alimova et al., Reference Alimova, Katz, Steiner, Rudolph, Wei, Steiner and Gottlieb2009; Mueller, Reference Mueller2015; Li et al., Reference Li, Zhou, Fiore and Yu2019a; Fomina and Skorochod, Reference Fomina and Skorochod2020; Yong et al., Reference Yong, Lim, Ho, Chieng and Kuan2022). However, overall, such transformations were not evident within the 48 h time frame of this study. These findings underscore the mineralogical stability of NKnC under rumen conditions. In addition, the results suggest that the supplemented kaolin in the ruminants’ diet is likely to pass through the gastrointestinal tract largely intact. It may exert beneficial effects on methane mitigation, although its effects on animal performance require validation in vivo. This conclusion aligns with in vivo studies involving various clays, including kaolin, which also report beneficial effects in ruminant systems (Ortiz et al., Reference Ortiz, Montano, Plascencia, Salinas, Torrentera and Zinn2016; Liu et al., Reference Liu, Cai, Khatoon, Yu and Zhou2021).
Implications of clay-microbe interaction for methane reduction and productivity of cattle
Natural kaolin is distributed widely in nature and is generally considered environmentally friendly due to its natural occurrence and its ability to interact with pollutants (Worasith and Goodman, Reference Worasith and Goodman2023). Due to its non-toxic nature and significant palatability, which are influenced by geophagy (Tate et al., Reference Tate, Yuan, Theng, Churchman, Singh and Berben2015), kaolin has attracted increasing interest among animal nutritionists and clay scientists (Ortiz et al., Reference Ortiz, Montano, Plascencia, Salinas, Torrentera and Zinn2016). This clay mineral offers significant benefits to livestock by reducing diarrhea, improving feed conversion efficiency, and enhancing growth performance in livestock animals (Nadziakiewicza et al., Reference Nadziakiewicza, Kehoe and Micek2019; Liu et al., Reference Liu, Cai, Khatoon, Yu and Zhou2021). In addition, clay supplementation has been associated with better milk and meat quality (Liu et al., Reference Liu, Cai, Khatoon, Yu and Zhou2021). Recent studies have shown that different types of clay minerals can reduce gut acidity, parasites, harmful microbes, and methane emissions from animal sources without compromising animal health or performance, ultimately reducing the environmental footprint of livestock production (Neubauer et al., Reference Neubauer, Humer, Mann, Kroger, Reisinger, Wagner, Zebeli and Petri2019; Soltan et al., Reference Soltan, Morsy, Hashem, Elazab, Sultan, Marey, Lail, El-Desoky, Hosny, Mahdy, Hafez and Sallam2021; Amanzougarene and Fondevila, Reference Amanzougarene and Fondevila2022; Pikhtirova et al., Reference Pikhtirova, Pecka-Kielb, Kroliczewska, Zachwieja, Kroliczewski and Kupczynski2024). Commercially, clay-based supplements such as lick blocks and loose licks are used widely for these purposes.
Considering these findings, this study investigates the interaction between ruminal microbes and natural kaolin during methane reduction in the rumen environment (Fig. 9), providing preliminary insights into the underlying mechanisms of kaolin-induced methane mitigation. Although kaolin supplementation reduced methane production significantly, it did not substantially alter rumen physicochemical parameters, volatile fatty acid profiles, or the overall bacterial community structure. This suggests that methane mitigation is not driven by bulk chemical effects or broad microbial restructuring but is more likely related to surface-mediated physical interactions, particularly the attachment and immobilization of ruminal macrofauna such as nematodes. Given the potential association of ruminal nematodes with methanogens, such physical interference may contribute to the observed methane reduction.
Key findings with questions in understanding clay–microbe interactions for reducing CH4 emission from the rumen system. The continuous and dotted purple arrows are the process path, and the green downward arrows represent the decrease in methane production.

Figure 9. Long description
The flowchart is organized into three main horizontal stages.1. Source and Processing (Left to Center):* A photo of a Halloysite-rich kaolin clay Deposit leads to a photo of Kaolin powder.* The powder is combined with Grass to create Pellets.* Arrows indicate these pellets are fed to a cow.2. Biological Impact (Right):* An illustration of a cow shows the pellets entering the mouth and reaching the Rumen.* Above the cow, four C H sub 4 (methane) clouds represent standard emissions.* A dotted line connects the Rumen to a large blue-outlined cross-section of the digestive tract below.3. Microscopic Interactions (Bottom Right):* Inside the rumen cross-section, two C H sub 4 clouds with green downward arrows indicate reduced methane.* A legend identifies three components: Kaolin Clay (brown hexagonal plates), Nematode (blue wave), and Bacterial cell (green oval with tail).* Text labels describe ‘Clay-microbe interactions’, ‘Dissolution of S i, F e, K, and C a’, ‘Stable p H and V F A s’, and ‘Good Fermentation’.4. Structural and Research Context (Bottom Left):* A diagram shows the ‘Basic structure of halloysite-rich kaolin clay’ as stacked hexagonal plates with tubular inclusions.* Key findings listed: 1. Bacterial profile preserved. 2. Clay-nematode attachment. 3. Stable kaolin post-fermentation.* Key questions listed: 1. Fate of methanogens and protozoa? 2. Kaolin-based methane reduction mechanism?
Top Section (Feed Production):
* A photo of a Halloysite-rich kaolin clay Deposit on the far left leads via a purple arrow to a pile of Kaolin powder.
* The powder is combined with Grass (indicated by a plus sign) to create feed Pellets.
* Purple arrows show both grass and pellets being consumed by a cow.
* Above the cow’s head, four cloud bubbles containing CH sub 4 represent methane emissions.
Bottom Right Section (Rumen Detail):
* A dotted black arrow points from the cow’s Rumen to a large blue outline of the rumen environment.
* Inside the rumen, purple dotted arrows indicate Clay-microbe interactions.
* Specific interactions include the Dissolution of Si, Fe, K, and Ca, and the maintenance of Stable pH and VFAs, leading to Good Fermentation.
* Cloud bubbles with CH sub 4 and a green downward arrow indicate reduced methane.
* A legend on the far right identifies symbols for Kaolin Clay (hexagonal plates), Nematode (blue wavy line), and Bacterial cell (green oval with tail).
Bottom Left Section (Summary):
* An illustration shows the Basic structure of halloysite-rich kaolin clay as stacked hexagonal plates with tubular structures.
* Key findings listed: 1. Bacterial profile preserved. 2. Clay-nematode attachment. 3. Stable kaolin post-fermentation.
* Key questions listed: 1. Fate of methanogens and protozoa? 2. Kaolin-based methane reduction mechanism?
While partial dissolution of kaolin occurred, the mineral remained largely stable post-fermentation. This suggests that undigested clay would be excreted, indicating its potential environmental safety. However, the fate of key microbial groups, particularly methanogens and protozoa, following clay–biota interactions remains unclear (Fig. 9). Future microscopic observations combined with targeted molecular analyses of these microbial groups will be essential to fully elucidate the mechanism by which kaolin contributes to methane reduction in the rumen.
Conclusions and future research
The in vitro rumen fermentation experiment demonstrated that halloysite nanotubes-kaolinite mixed natural kaolin clay (here abbreviated as NKnC) supplementation significantly reduces CH4 production without adversely affecting the measured ruminal physicochemical parameters and microbiota. Notably, the bacterial population and its diversity in the rumen fluid showed no significant alterations in the core microbes. This suggests that the presence of NKnC does not disrupt the key microbial communities responsible for efficient ruminal digestion. This may be advantageous from a gut health point of view for maintaining healthy digestion in the rumen. Functional potential analysis further indicated that fiber- and protein-degrading activities remained largely stable, while lipolytic potential increased (~36%), suggesting selective metabolic modulation without disrupting overall microbial function. However, an apparent increase in nematode morbidity/mortality was observed in the clay-amended fluid, raising the question of whether this helped in methane reduction. This extends the scope of future research, in which status-specific methanogenic archaea and protozoa should be identified at the molecular level when this clay is amended into the rumen ecosystem. Even though limited mineral dissolution occurs, clay particles tend to pass through the digestive system of cattle. This is probably due to geophagic adaptation, resulting in the excretion of clay particles in the feces. In addition, the strong main kaolinite/halloysite diffraction peak observed in the post-fermentation sample confirms the continued presence of kaolinite/halloysite as a crystalline structure. This suggests that its fate probably follows the geophagic behavior observed in live cattle, passing through the digestive system largely unchanged. Although halloysite–kaolinite mixed species in a single raw mineral sample are representative of natural deposits, a manual mixture using pure halloysite and kaolinite at different ratios may be necessary. This would allow controlled feeding into rumen fluid and enable systematic studies to better understand mineral-specific functions within rumen microenvironments. While a trial with live animals is a future endeavor with kaolin-supplemented feed, these in vitro findings suggest that NKnC is a promising additive for reducing livestock methane emissions while interacting with ruminal parasites to promote cattle health and productivity. These results highlight the potential of mixed-mineral halloysite nanotubes-kaolinite as a sustainable strategy to enhance livestock management and mitigate environmental impacts.
Supplementary material
The supplementary material for this article can be found at http://doi.org/10.1017/cmn.2026.10040.
Author contribution
Z.H.: Conceptualization, Methodology, Data curation, Writing – original draft, review and editing, Visualization; M.R.I.: Methodology, Writing – review and editing, Supervision; R.N.: Writing – review and editing, Supervision, Funding acquisition; B.B.: Conceptualization, Writing -review and editing, Supervision, Funding acquisition, Project administration.
Acknowledgements
The first author thanks crcCARE (the CRC for Contamination Assessment and Remediation of the Environment) for providing a PhD student scholarship.
Financial support
Z.H. acknowledges The Clay Minerals Society (CMS), Virginia, USA, for awarding him a CMS Student Research Grant, which supported the molecular analysis aspect of this study.
Competing interests
The authors declare none.
Declaration of generative AI and AI-assisted technology usage
The authors did not use any artificial intelligence-assisted technologies in the writing process. However, to amend language errors in their first drafts, the authors used online grammar-checking tools, that might have embedded AI power. After using this tool/service, the authors reviewed and edited the content as needed and take full responsibility for the content of the publication.
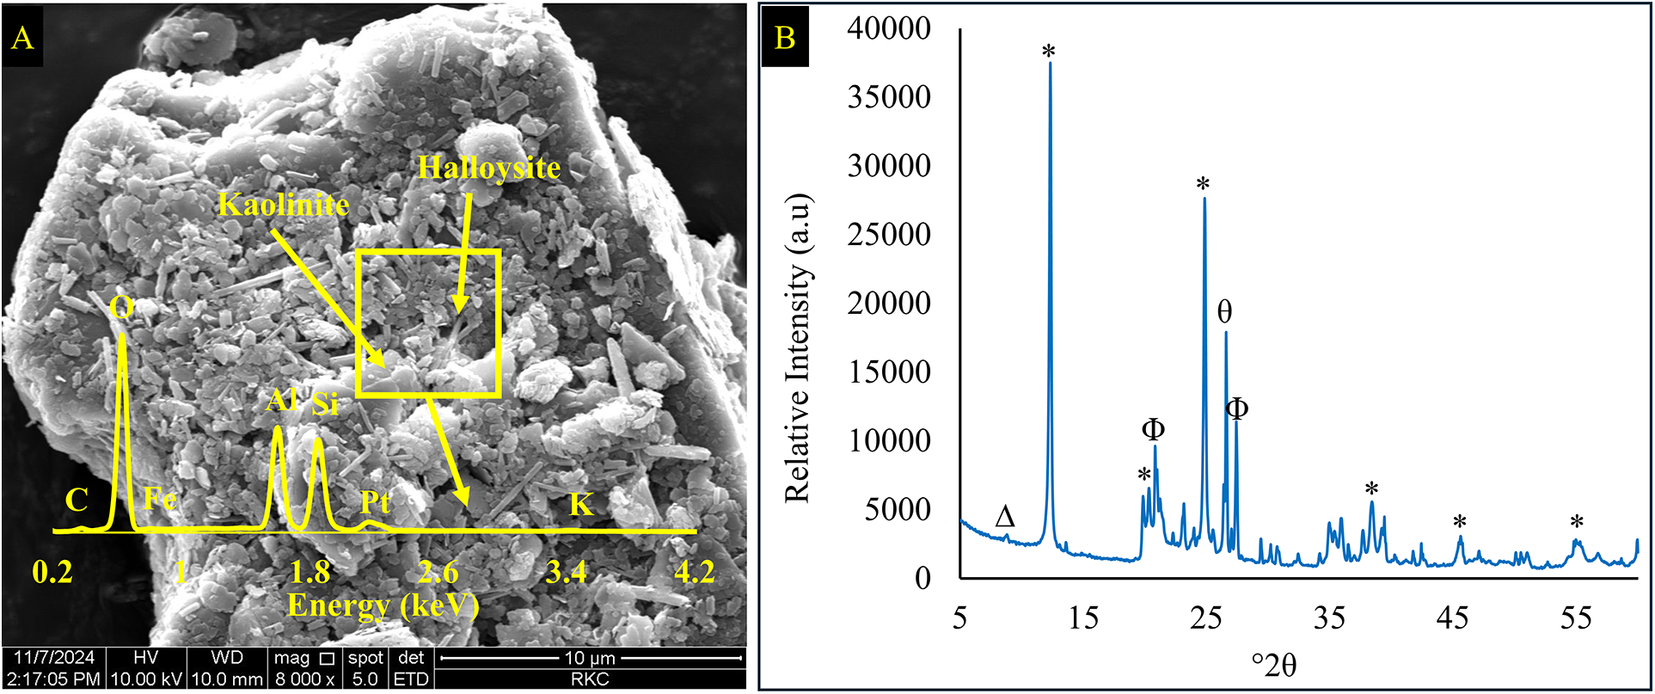
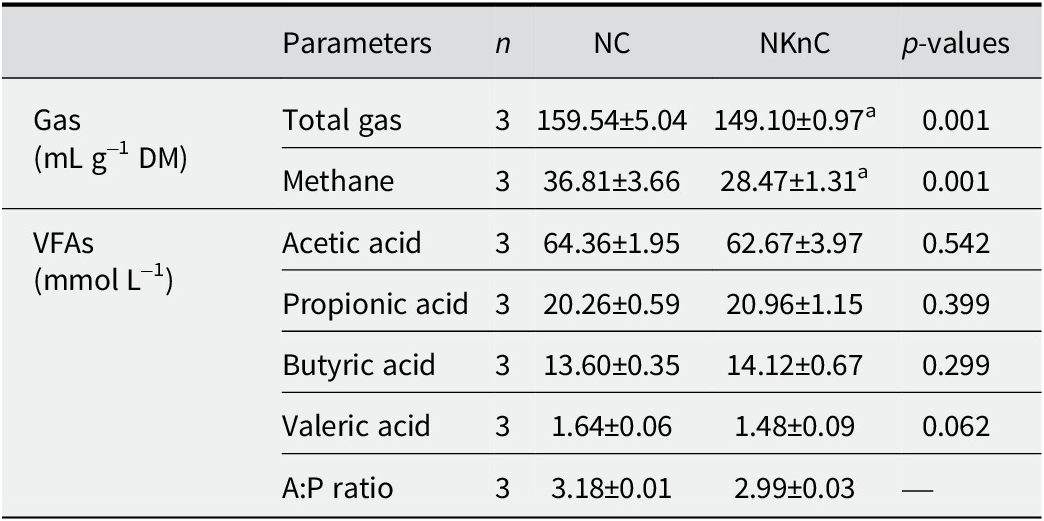
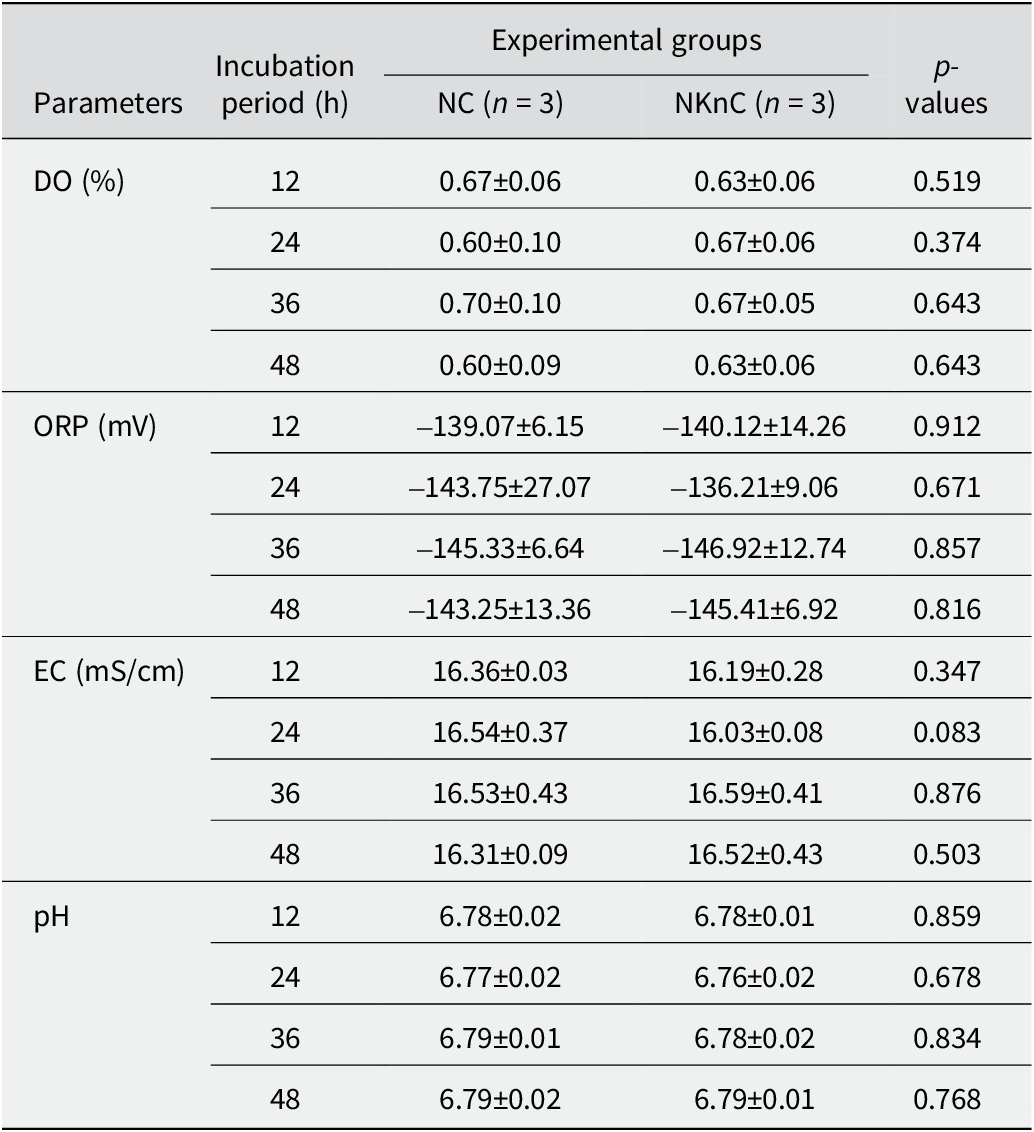
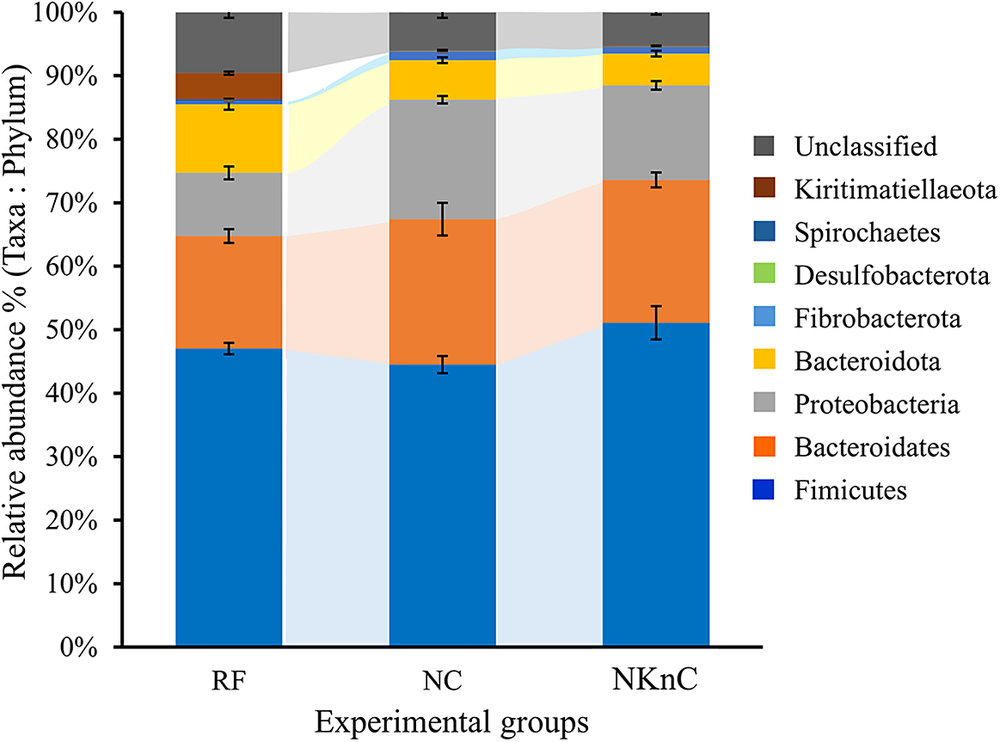
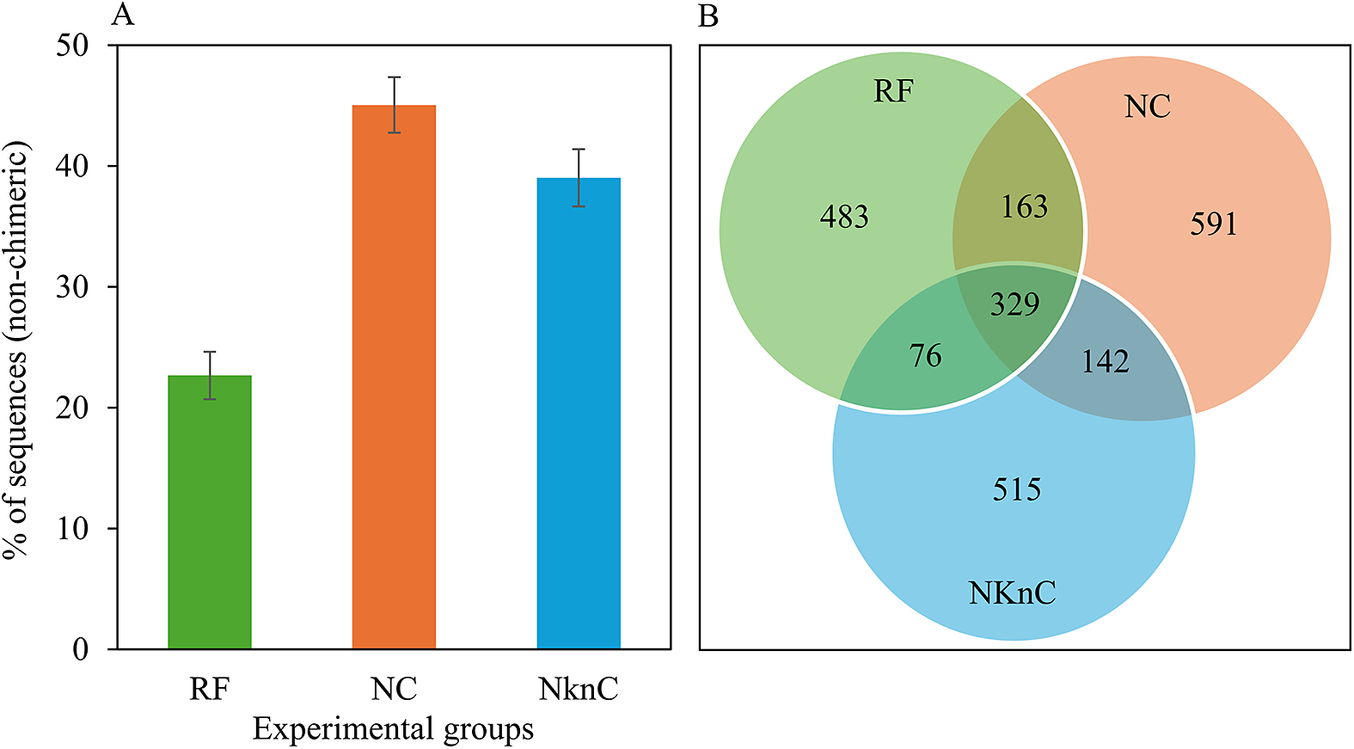
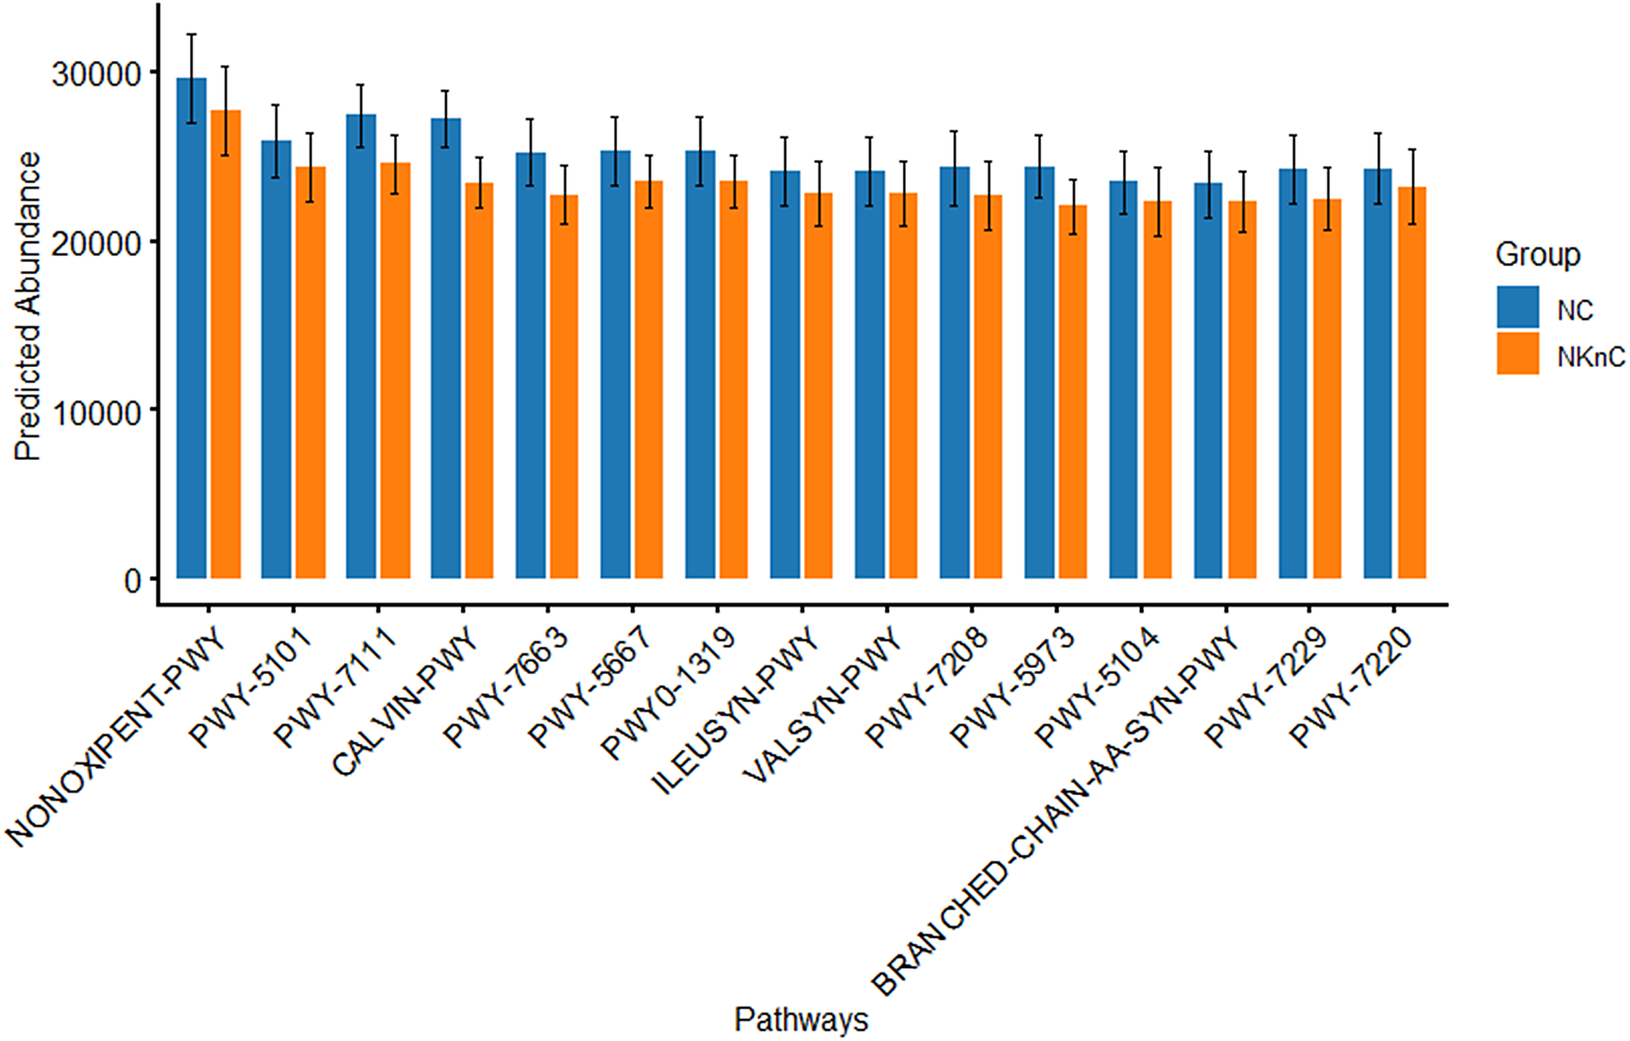
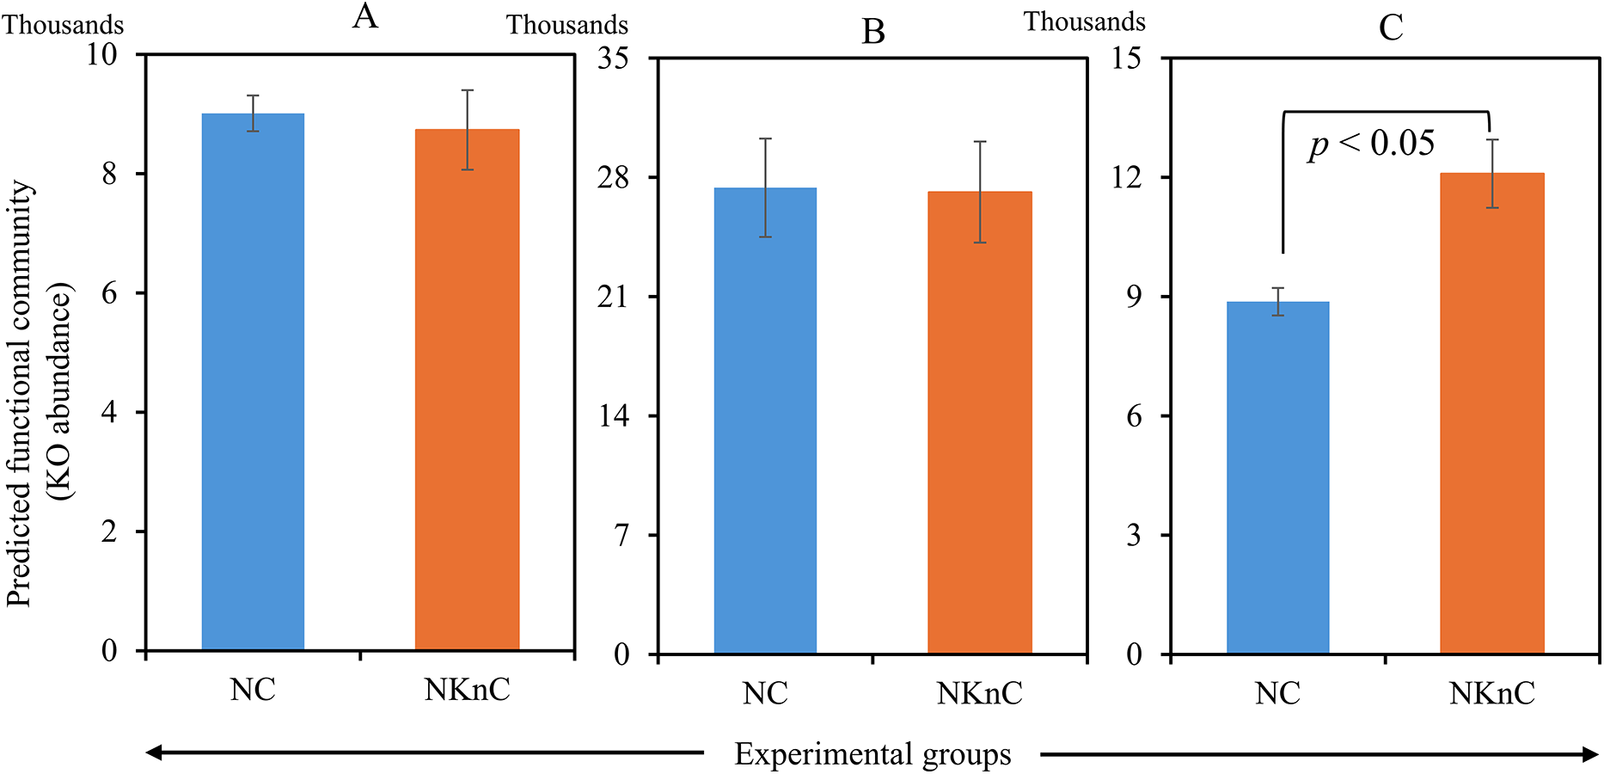
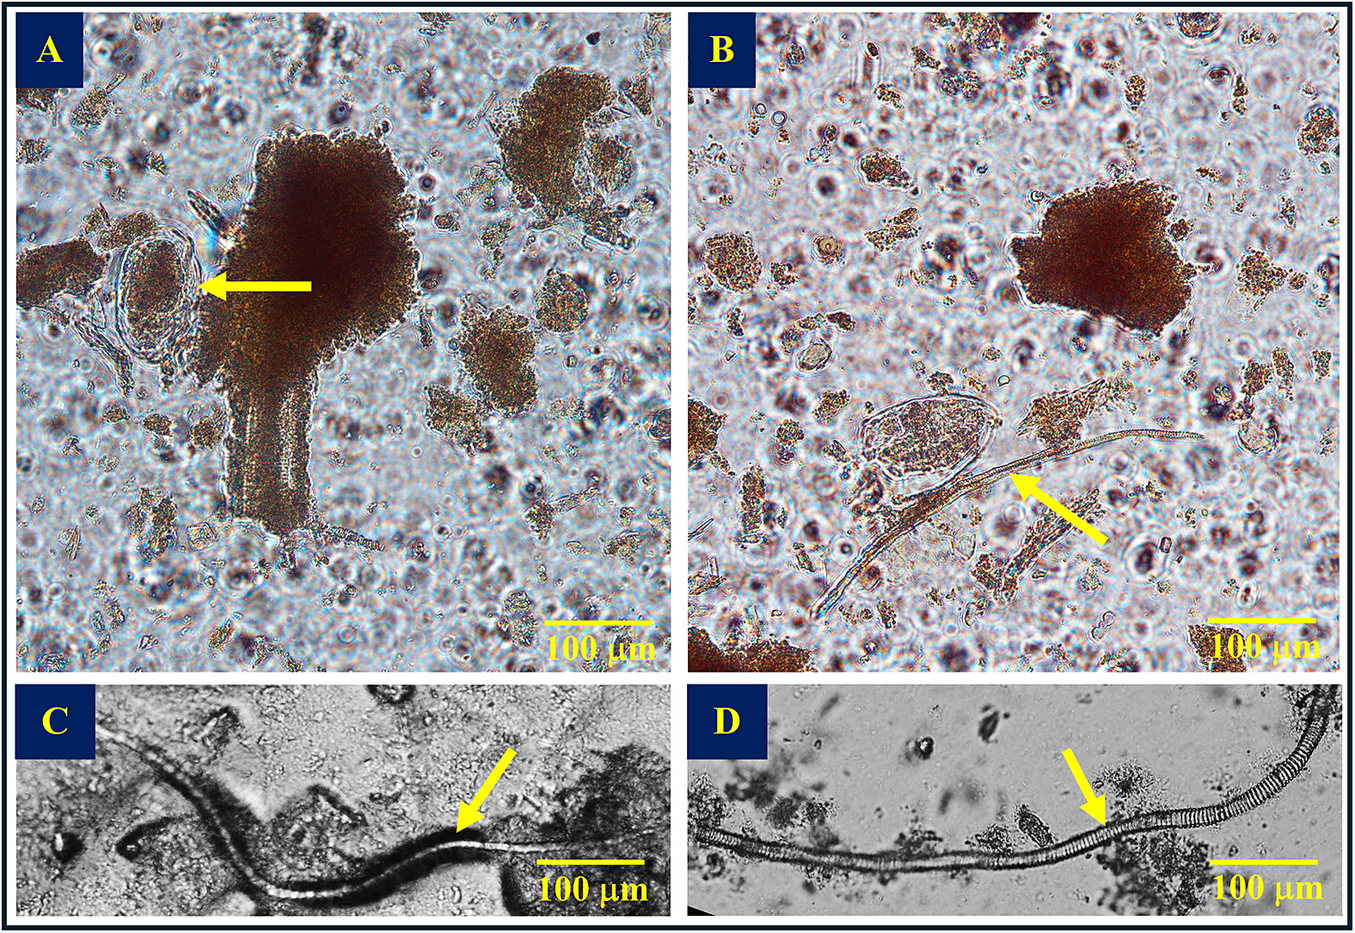
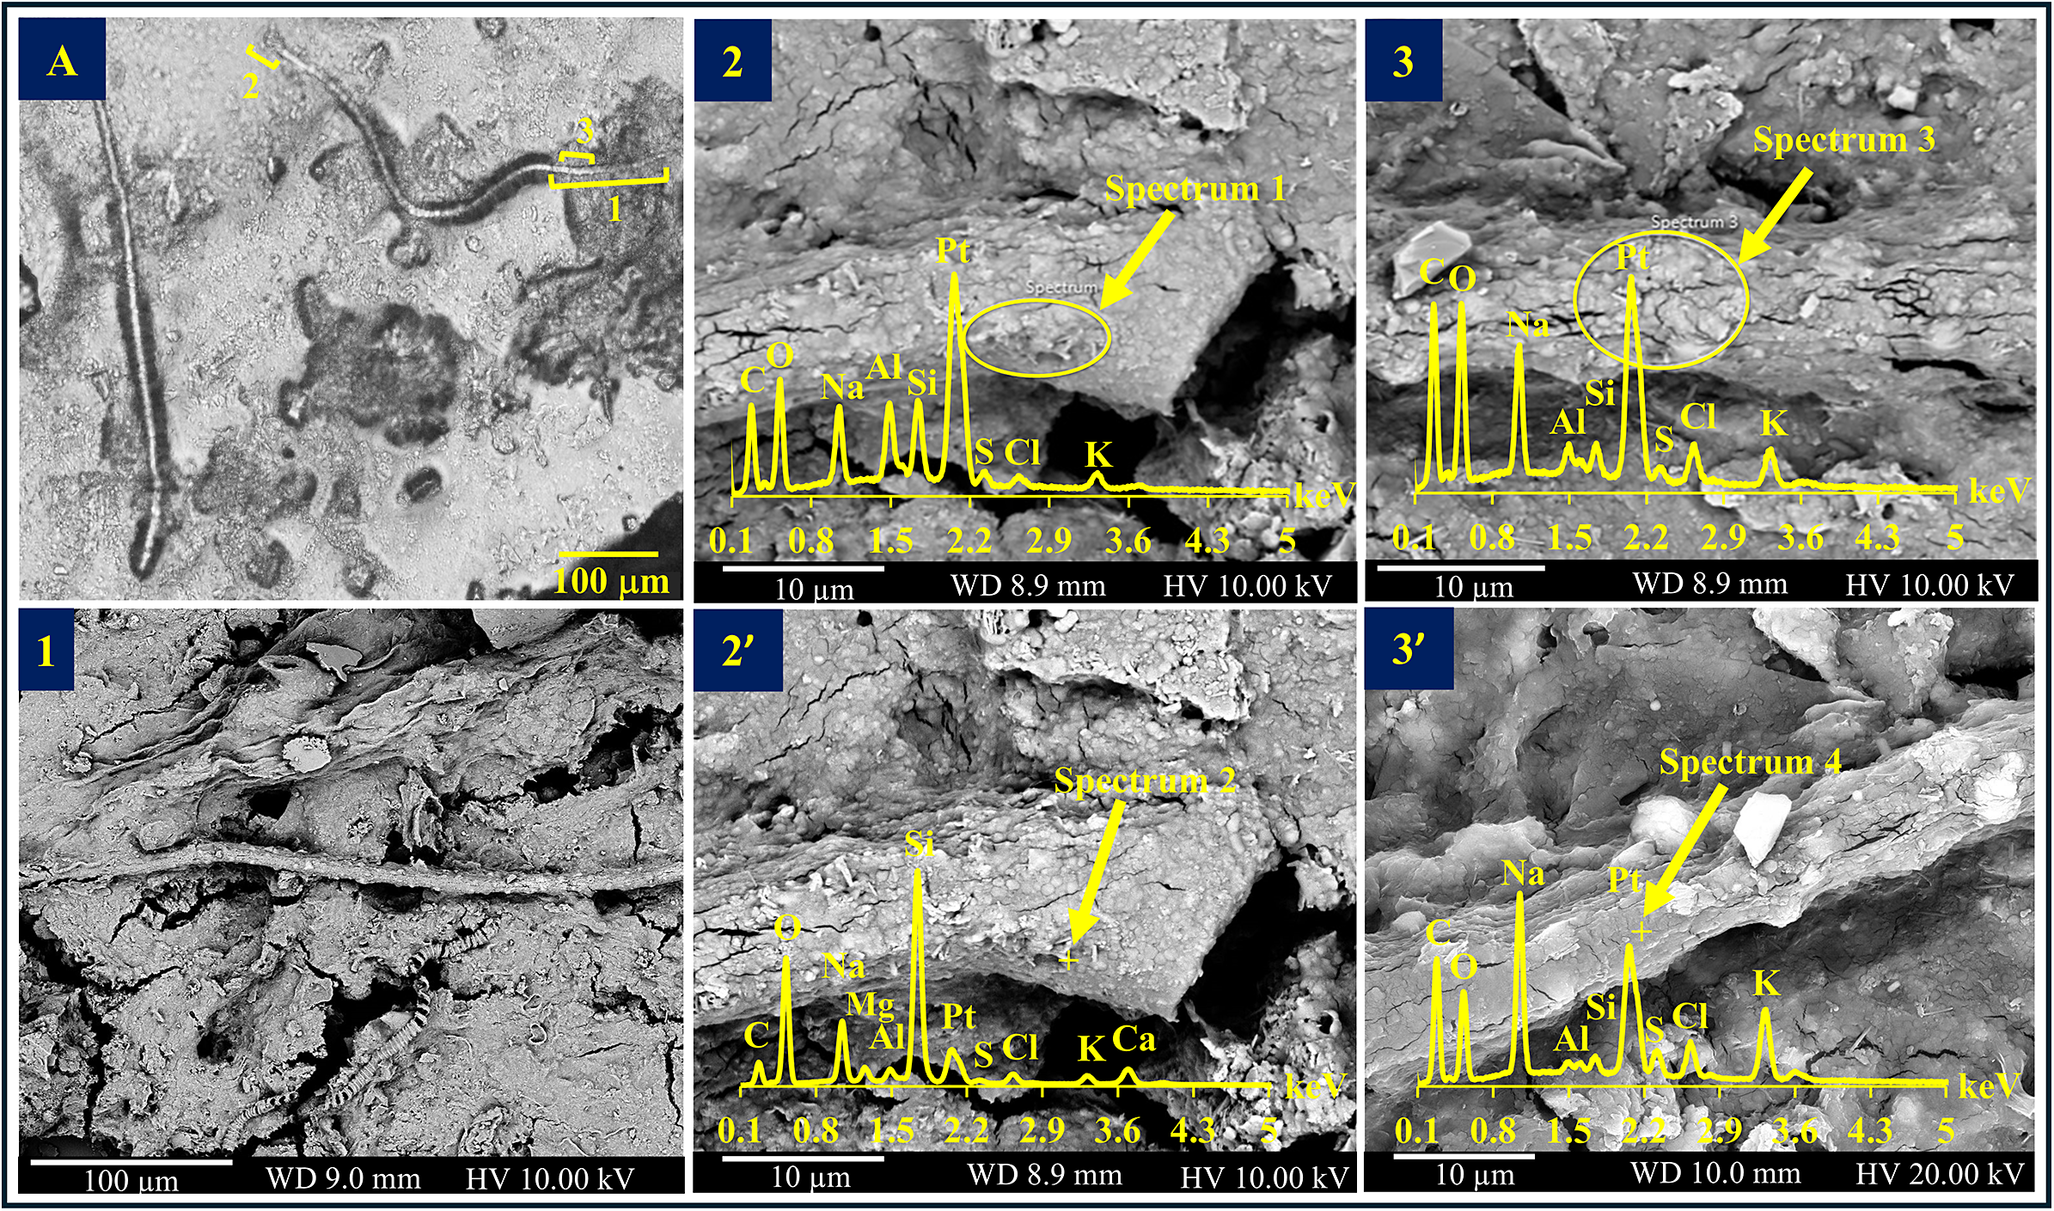
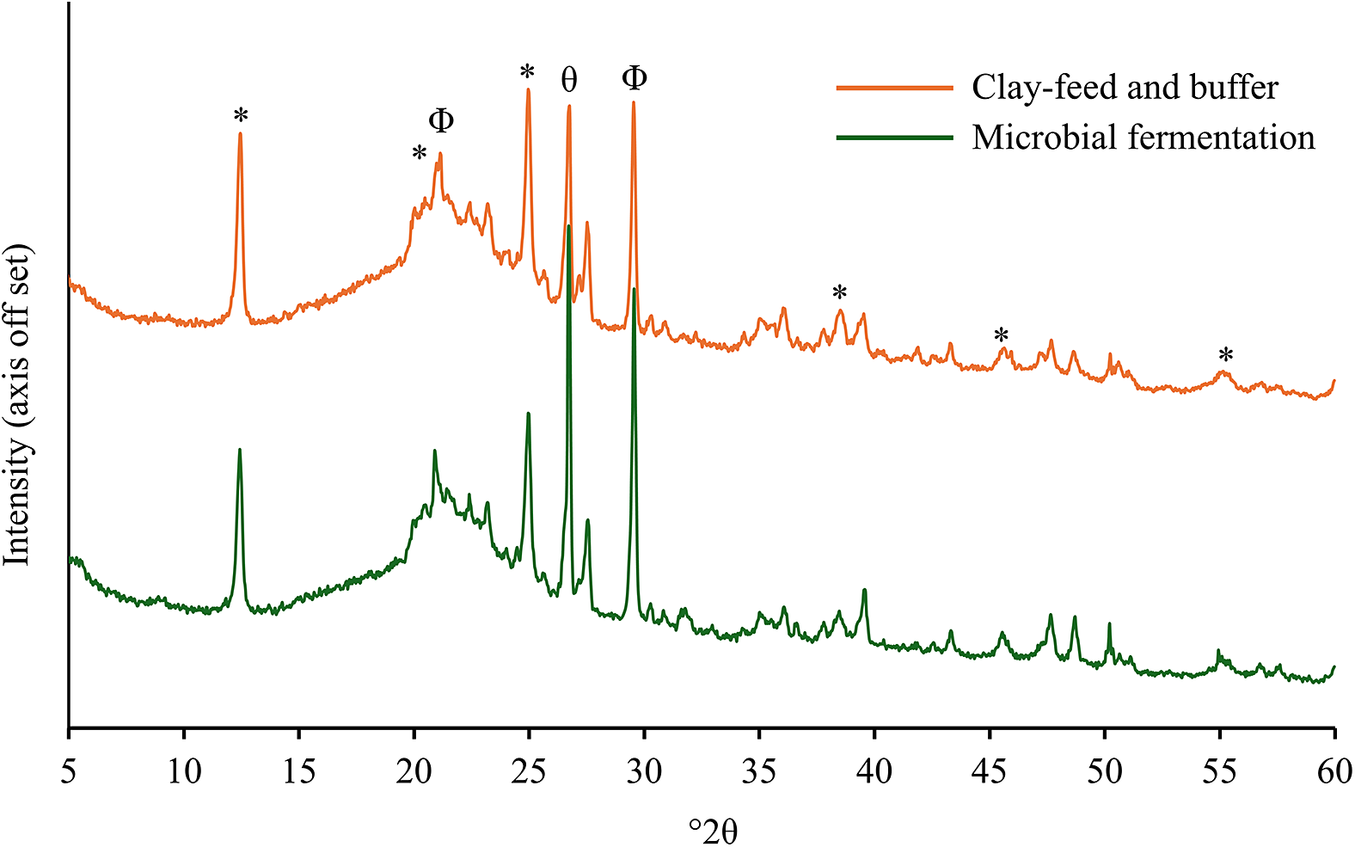

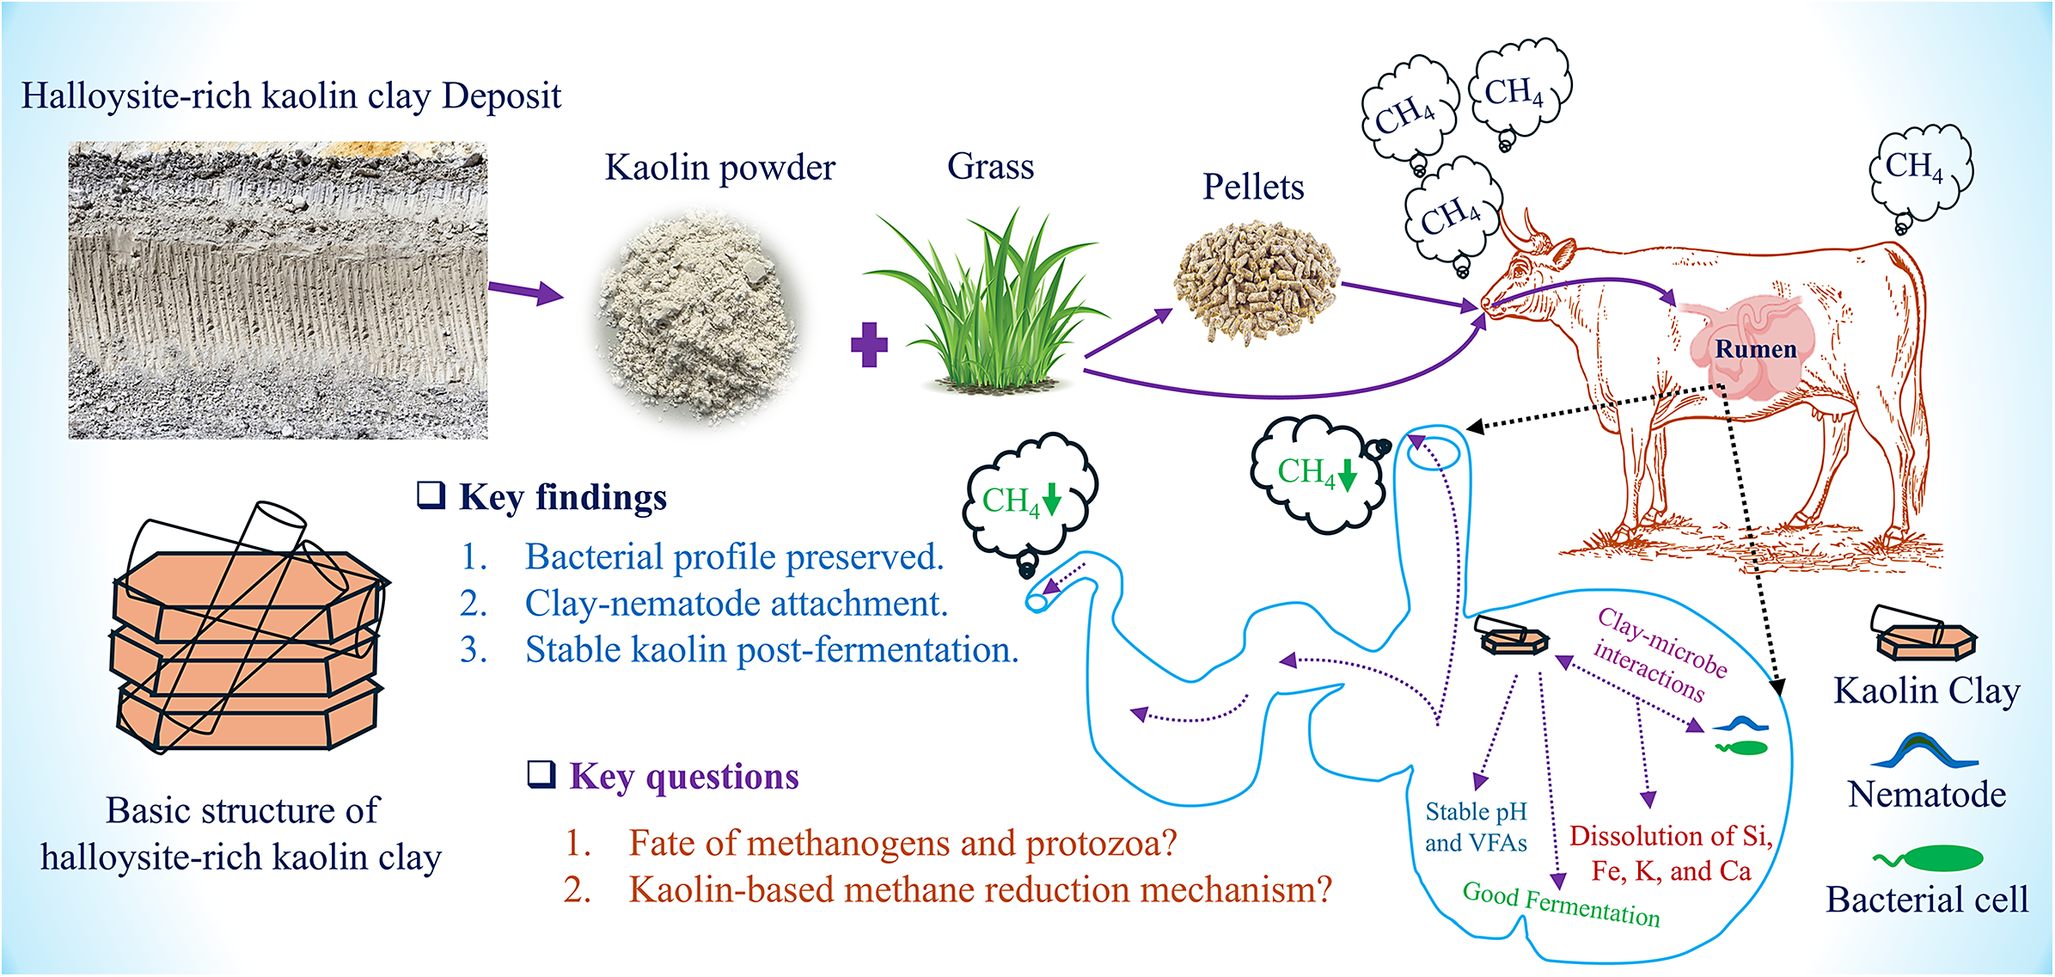


 Open access

