I. INTRODUCTION
Solid polymer electrolytes (SPEs) are promising candidate to replace the hazardous liquid electrolytes. SPEs manifest wide range of applications, such as batteries, fuel cells, solar cells, sensors, actuators, and supercapacitors. There are many methods to improve the ionic conductivity of the polymer electrolytes, e.g., polymer blending, addition of plasticizer and filler, doping of ionic liquid and mixed salt systems. The polymer blending and incorporation of ionic liquid are focused in this present work. Some previous studies showed that the poly(ethylene oxide) (PEO)-based polymer electrolytes exhibited lower ionic conductivity. The low conductivity is mostly attributed to the crystalline portion. So, amorphous polymer, poly(methyl methacrylate) (PMMA), was used as host polymer. However, this polymer exhibits low mechanical properties. Therefore, poly(vinyl chloride) (PVC) is blended with PMMA in this work. This polymer blend not only increases the ionic conductivity of polymer electrolytes but also improves the mechanical strength of polymer electrolytes.Reference Ramesh and Liew1 To increase the ionic conductivity further, room temperature ionic liquids (RTILs) were introduced.
Typically, RTIL consists of bulky, and asymmetric organic cations and highly delocalized–charge inorganic anions along with a low melting point (<100 °C). It is also known as room temperature molten salt and remains in liquid form at ambient temperature.Reference Sirisopanaporn, Fernicola and Scrosati2 Indeed, RTILs possess many inherent and attractive properties such as nonvolatility, nontoxicity, nonflammability, excellent chemical, thermal, mechanical, and electrochemical stabilities. Other intrinsic advantages are wide electrochemical window (up to 6 V), high ionic conductivity due to high ion content, and inter alia, as well as excellent safety performance.Reference Vioux, Viau, Volland and Bideau3–Reference Marcilla, Alcaide, Sardon, Pomposo, Gonzalo and Mecerreyes7 In addition, it has potential to replace those volatile organic solvents, as vapor pressure is negligible.Reference Jain, Kumar, Chauhan and Chauhan8 RTIL is readily dissolved in a wide range of organic, inorganic, and organometallic compounds. Furthermore, it does not coordinate with metal complexes, enzymes, and different organic substrates.Reference Jain, Kumar, Chauhan and Chauhan8
Cations and counteranions are the major aspects to concern in the development of ionic liquid, as the solubility of ionic liquids strongly depends on the nature of cations and counteranions.Reference Jain, Kumar, Chauhan and Chauhan8 Among all the cations, 1,3-dialkylimidazolium (Im) is an appealing cation due to its favorable properties in applications.Reference Kim, Park, Choi and Lee9 On the contrary, some common anions are used to form a neutral and stoichiometric ionic liquid.Reference Jain, Kumar, Chauhan and Chauhan8 However, TFSI anion is chosen because of its bulky structure, which enhances the electrochemical stability.Reference Reiter, Vondrak, Michalek and Micka10 Apart from that, high charge delocalization across the SO2–N–SO2 segment is another reason to select it as the promising counteranion.Reference Shin, Henderson and Passerini11 The high flexibility of this anion also shows two low energy conformations and, eventually, accelerates the ionic dissociation. As a result, more mobile charge carriers are available for transportation, which is in accordance with higher ionic conductivity.
1-butyl-3-methylimidazolium bis(trifluoromethylsulfonyl)imide (BmImTFSI)-based gel polymer electrolytes were explored in this present work. The ionic conductivity of polymer electrolytes is determined by AC impedance spectroscopy. Dielectric studies are further carried out to characterize the electrical properties of polymer electrolytes. HATR–FTIR is investigated to prove the complexation between PMMA (Aldrich, St. Louis, MO), PVC (Fluka, Germany), lithium bis(trifluoromethanesulfonyl)imide (LiTFSI, Fluka, Germany), and BmImTFSI (Sigma-Aldrich, St. Louis, MO).
II. EXPERIMENTAL
A. Materials
PMMA with an average molecular weight of 350,000 g/mol (Aldrich), high molecular weight of PVC (Fluka), inorganic dopant salt LiTFSI (Fluka), ionic liquid BmImTFSI (Sigma-Aldrich), and solvent tetrahydrofuran (THF, J.T. Baker, UK) were used without further purification. Solution casting technique was used to prepare the gel polymer electrolytes.
B. Preparation of polymer electrolytes
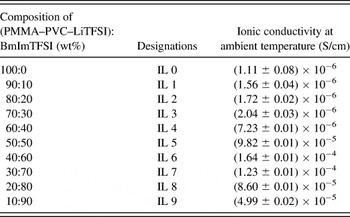
Before the preparation of the polymer electrolytes, LiTFSI was dried at 100 °C for 1 h to eliminate any trace amounts of water in the material. The ratio of PMMA to PVC is fixed as 70 to 30 wt%, whereas the ratio of PMMA–PVC polymer blends and LiTFSI is 70 to 30 wt%. Appropriate amounts of PMMA, PVC, LiTFSI, and BmImTFSI were dissolved in THF. The solutions were continuously stirred for 24 h to obtain homogenous mixtures at room temperature. The solutions were then cast on a glass Petri dish and allowed to evaporate slowly inside a fume hood. BmImTFSI-based gel polymer electrolytes were formed, and the designations of the polymer electrolytes are as tabulated in Table I.
Designations and ionic conductivities of BmImTFSI-based gel polymer electrolytes.

C. Characterizations
1. AC impedance spectroscopy
The prepared samples were subjected to AC impedance spectroscopy. The thickness of the polymer electrolyte films was measured by using micrometer screw gauge. The ionic conductivity of the samples was determined using HIOKI 3532-50 LCR HiTESTER (Japan), over a frequency range between 50 Hz and 1 MHz at ambient temperature. Samples were mounted on the conductivity holder with stainless steel blocking electrodes under spring pressure. The bulk ionic conductivity of polymer electrolytes is determined by using the equation as shown below:
 $${\rm{\sigma }} = {\ell \over {R_{\rm{b}} A}}\quad,$$
where  $\ell $ is the thickness (cm), R b is bulk resistance (Ω), and A is the known surface area (cm2) of polymer electrolyte films. The complex impedance (Z) plot consists of two parts; they are real part (Z′) and imaginary part (Z″). Z′ and Z″ are determined by using Eqs. (2) and (3) as exemplified as below:
 $$Z\prime = \left| Z \right|\cos {\rm{\theta \quad,}}$$
 $$Z\Prime = \left| Z \right|\sin {\rm{\theta \quad,}}$$
where θ is the phase of impedance
R b of these polymer blend electrolytes was calculated from the interception of extrapolation of the semicircular region on Z real axis (Z′) with the spike.
2. Frequency dependence–ionic conductivity studies
In this study, the ionic conductivity is expressed as illustrated as below:
 $${\rm{\sigma }} = {{G\ell } \over A}\quad,$$
where G is the conductance (Siemens, S),  $\ell $ is the thickness (cm), and A is the known surface contact area of electrolyte–electrode (cm2).
3. Dielectric behavior studies
The complex dielectric behavior of a polymer matrix is illustrated as:
 $${\rm{\varepsilon }}^ * = {\rm{\varepsilon \prime}} - i{\rm{\varepsilon \Prime}}\quad,$$
where ε′ and ε″ are real and imaginary parts of dielectric constant of the polymer electrolyte systems, respectively. On the contrary, these real and imaginary parts of the dielectric constants are given by:
 $${\rm{Dielectric \,permittivity, \,\varepsilon \prime}} = {{C_{\rm{p}} \ell } \over {{\rm{\varepsilon }}_{\rm{0}} A}}\quad,$$
 $${\rm{Dielectric\, loss, \,\varepsilon \Prime}} = {{\rm{\sigma }} \over {{\rm{\omega \varepsilon }}_{\rm{0}} }}\quad,$$
where C p is parallel capacitance,  $\ell $ is the thickness of the polymer electrolyte, ε0 is permittivity of free space (also known as electric constant), σ is the ionic conductivity of the polymer electrolyte, ω is angular frequency and ω = 2πf, f being the frequency in Hertz (Hz). The data acquisitions were done in the frequency range of 50 Hz to 1 MHz, over the temperature regime from 303 to 353 K.
4. Dielectric moduli formalism
The real (M′) and imaginary (M″) parts of dielectric moduli are expressed as below:
 $${\rm{Real \,modulus,\, }}\,M\prime = {{{\rm{\varepsilon \prime}}} \over {[({\rm{\varepsilon \prime}})^2 + ({\rm{\varepsilon \Prime}})^2 ]}}\quad,$$
 $${\rm{Imaginary \,modulus,\, \,}}M\Prime = {{{\rm{\varepsilon \Prime}}} \over {[({\rm{\varepsilon \prime}})^2 + ({\rm{\varepsilon \Prime}})^2 ]}}\quad.$$
5. Attenuated total reflectance–Fourier transform infrared studies
Attenuated total reflectance–Fourier transform infrared (ATR–FTIR) analysis was carried out by the means of FTIR Spectrometer Spectrum RX1 (PerkinElmer, Norwalk, CT) with ATR internal reflection accessory in the wave region between 4000 and 650 cm−1. The resolution of the spectra obtained at room temperature was 4 cm−1and recorded in the transmittance mode.
III. RESULTS AND DISCUSSION
A. AC impedance studies
The nomenclatures used for each sample and their respective ionic conductivities are shown in Table I. As illustrated in Table I, the ionic conductivity increases with BmImTFSI mass fraction, up to 60 wt%. The ionic conductivity is enhanced by forming more mobile ions, as BmImTFSI provides BmIm+ and TFSI−.Reference Singh, Kim, Park and Rhee12 High self-dissociating and ionic hopping properties of ionic liquid also contribute to higher ionic conductivity.Reference Ramesh, Liew and Ramesh4 High self-dissociation of ionic liquid could promote the ionic decoupling and thus provides more free charge carriers, improving the ionic conductivity. In addition, the increase in ionic conductivity is owing to the strong plasticizing effect of ionic liquid.Reference Sekhon, Krishnan, Singh, Yamada and Kim6 Plasticizing effect could soften the polymer backbone and increase the flexibility of polymer segments. As a result, it enhances the segmental mobility and thereby initiates the ionic hopping mechanism.
Upon addition of 60 wt% of BmImTFSI (denoted as IL 6), the ionic conductivity is increased by two orders of magnitude and achieved the highest ionic conductivity of (1.64 ± 0.01) × 10−4 S/cm at ambient temperature. However, the ionic conductivity is decreased thereafter. This is primarily attributed to the agglomeration of mobile ions or formation of neutral ion pairs.Reference Singh, Kim, Park and Rhee12 The ion pairing would block the ionic conducting pathway, restrain the ionic migration, and reduce the mobility of charge carriers, inducing a decrease in ionic conductivity.
B. Frequency dependence–ionic conductivity studies
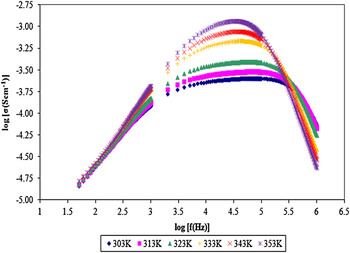
Figure 1 depicts room temperature frequency dependence–ionic conductivity of IL 6 in the temperature range of 303–353 K. It can clearly be observed that the spectrum is fitted to Jonscher’s universal power law, which is illustrated as follows:
 $${\rm{\sigma }}({\rm{\omega }}) = {\rm{\sigma }}(0) + A{\rm{\omega \Prime}}\quad,$$
Frequency-dependent conductivity for IL 6 in the temperature range of 303–353 K.

where σ(ω) is AC conductivity, σ(0) is the frequency-independent DC limit of conductivity, A is a temperature-dependent parameter, ω is angular frequency, and n is the power law exponent in the range of 0 < n < 1. Based on Eq. (10), it discloses that the AC conductivity is found to vary with angular frequency in all dielectric materials.Reference Ramesh, Liew and Arof13, Reference Almond, West and Grant14 Three obvious dispersion regions are observed in Fig. 1. At low frequency, the conductivity increases sharply with frequency due to the slow periodic reversal of the applied electric field onto the sample. Hence, it leads to the formation of the polarization at the electrode–electrolyte interface and promotes the accumulation of charge carriers at this interface. This electrode polarization further decreases the concentration of mobile ions and reveals the non-Debye behavior of the polymer system.Reference Ramesh, Liew and Arof13, Reference Khiar, Puteh and Arof15 On the other hand, the conductivity is higher at high frequency. The mobility of ions increases with frequency and asserts the favorable ionic hopping mechanism. As the frequency increases, the conductivity is increased, up to a maximum level. At this stage, a frequency-independent plateau region is observed. This implies that the conductivity is equal to the bulk ionic conductivity. The conductivity is abruptly decreased thereafter. Apart from that, the ionic conductivity increases with temperature within the frequency regime. This is due to higher drift of ions upon heating up. This higher mobility of ions favors the ion transportation in the polymer matrix and enhances the ionic conductivity at higher temperature. However, above 0.1 MHz of frequency, the opposite observation is obtained.
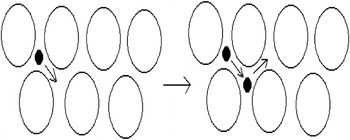
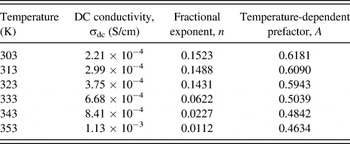
The DC conductivity (σdc) is determined and fitted. The fractional exponent (n) and temperature-dependent prefactor (A) have been further determined by plotting the graph log σ(ω) − σdc versus log ω in the temperature range of 303–353 K (not shown in this manuscript) using Eq. (10). The parameters, DC conductivity, fractional exponent (n), and temperature-dependent prefactor (A), are listed in Table II. The fractional exponent (n) is vital to identify the model of ionic hopping mechanism in the polymer electrolytes. As shown in Table II, the n and A values decrease with temperature, thus it can be concluded that ionic hopping mechanism obeys the correlated barrier hopping (CBH) model.Reference Ramesh and Liew16 This model proposes the bipolaron hopping process within the polymer matrix. A polaron is basically known as a quasiparticle, which composed of a charge carrier and its self-induced surrounding polarization field. The surrounding ions can interact with the charge carrier and thus lead to the adjustment of their position to balance the interactions with the charge carrier, producing a polarization on the charge carrier. As a result, the polaron is occurred. In this CBH theory, two mobile polarons would overcome the potential barrier between two defect interstitial sites (D+ and D−) of the polymer backbone and hence jump or hop to an adjacent equivalent sites, simultaneously for ionic transportation, as illustrated in Fig. 2.Reference Mehta, Kumar, Kumar and Kumar17 On the other hand, the DC conductivity increases with temperature as visualized in Table II. It is due to the increase in degree of vibrational mode of macromolecules with increasing the temperature, which enhances the segmental mobility of polymer backbone. As a result, the ionic hopping process is more favorable at higher temperature.
The pictorial diagram of interstitial polaron hopping mechanism in the polymer matrix.

The DC conductivity (σdc), fractional exponent (n), and temperature-dependent prefactor (A) of IL 6 in the temperature regime of 303–353 K.

C. Dielectric behavior studies
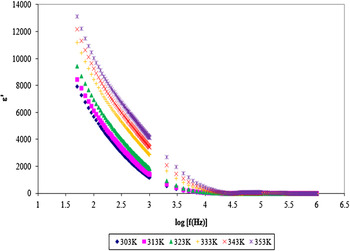
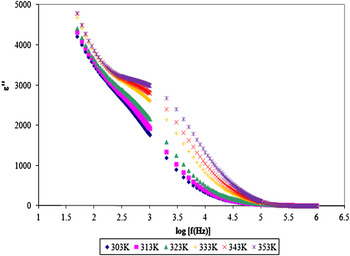
Frequency response of dielectric permittivity and dielectric loss of IL 6 in the temperature regime are shown in Figs. 3 and 4, respectively. No relaxation peaks are attained in these figures. As shown in these figures, dielectric constant and dielectric loss increase tremendously at low frequency due to electrode polarization and space charge effect at the electrode–electrolyte interface. It asserts the non-Debye response as the electrical fields change the direction. For this behavior, the space charge region with respect to the frequency is explained in terms of ion diffusion.Reference Ramesh, Liew and Arof13 At low frequency, free charge carriers build up at the electrode–electrolyte interface and then associate with electrode polarization when the electrical field is applied across the sample. On the contrary, both dielectric constant and dielectric loss are decreased at high frequency due to the fast periodic reversal of electric field. This rapid periodic reversal might slow down the orientation of dipoles and then decrease the charge density, which accumulates at the interface. Consequently, the excessive ion diffusion is absent in the electric field direction and ultimately leads to the bare polarization effect at high frequency.Reference Ramesh, Liew and Arof13, Reference Rajendran, Sivakumar and Subadevi18
Typical plot of the variation of real part of dielectric constant (ε′) with frequency for IL 6 in the temperature range of 303–353 K.

Typical plot of the variation of imaginary part of dielectric constant (ε″) with frequency for IL 6 in the temperature range of 303–353 K.

As can be observed, both dielectric permittivity and dielectric loss also increase with temperature due to the increase in concentration of free ions. The increase in temperature shields the cation–anion interactions within ionic liquid, which in turn causes the ion dissociation from ionic liquid compounds. Moreover, increase in temperature increases the degree of redissociation process of ion pairs and asserts the increase in concentration of free charge carriers at the interface. High temperature may prevent the ion aggregates and ion clusters in the polymer matrix and thus increases the equivalent capacitance by forming space charge region, exhibiting high dielectric constant.Reference Baskaran, Selvasekarapandian, Kuwata, Kawamura and Hattori19, Reference Eliasson, Albinsson and Mellander20
D. Dielectric moduli formalism
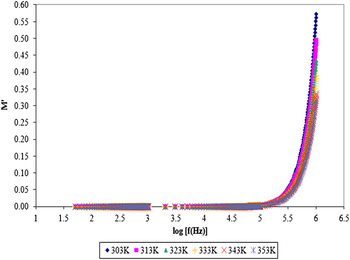
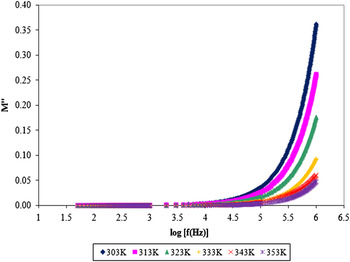
Dielectric modulus study is another alternative approach to investigate the bulk dielectric response by suppressing the electrode polarization effect.Reference Ramesh and Chai21Figures 5 and 6 depict the variation of real (M′) and imaginary (M″) parts of dielectric moduli as a function of frequency. Although the relaxation peaks are absent in these figures, however, an abrupt increment is observed at higher frequency end. At low frequency regime, both M′ and M″ tend toward zero. This long tail indicates the suppression of electrical double layer effect at the electrode–electrolyte interface.Reference Ramesh, Liew and Arof13, Reference Shastry and Rao22 The suppression of electrical double layer is mainly attributed to high capacitance values with the electrode in the polymer electrolyte system.Reference Ramesh and Chai21, Reference Suthanthiraraj, Sheeba and Paul23 In other words, dielectric moduli formalism facilitates the processes of identification and separation of polarization effect from the bulk relaxation phenomenon in the polymer electrolyte. An apparent observation is observed in Fig. 5. For real part of dielectric modulus, all the curves demonstrate superposition features in the temperature regime at high frequency and thus disclose that the modulus spectral formalisms exhibit temperature-independent properties, revealing the excellent electrochemical stability of IL 6.Reference Rajendran, Mahendran and Kannan24 However, the spectral formalisms are not superimposable in the high frequency region for imaginary part of dielectric modulus.
Variation of real modulus (M′) as a function of frequency for IL 6 in the temperature range of 303–353 K.

Variation of imaginary modulus (M″) as a function of frequency for IL 6 in the temperature range of 303–353 K.

E. ATR–FTIR studies
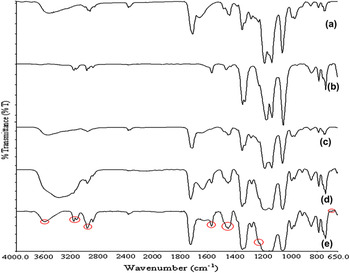
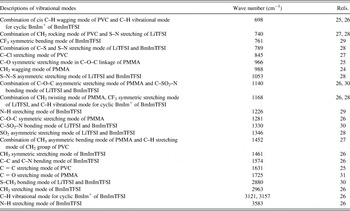
ATR–FTIR is another useful investigation to obtain the structural information of the polymer complex. Typical plot of ATR–FTIR spectra of IL 0, pure BmImTFSI of IL 2, IL 5, and IL 6 is shown in Fig. 7. Three categories are discussed to prove the formation of polymer complex upon incorporation with ionic liquid; they are changes in intensity, changes in shape, and changes in shift. Table III shows the assignments of the vibrational modes of polymer, doping salt, and ionic liquid for IL 6. The descriptions of vibrational modes of the most conducting polymer electrolyte (IL 6) would be discussed in detail.
ATR–FTIR spectra for (a) IL 0 and (b) pure BmImTFSI, (c) IL 2, (d) IL 5, and (e) IL 6.

Assignments of vibrational modes of PMMA, PVC, LiTFSI, and BmImTFSI for IL 6.

Inclusion of 60 wt% of BmImTFSI yields eight new peaks by comparing IL 0 with IL 6, as highlighted in Fig. 7(e). It further indicates the interaction between BmImTFSI and polymer matrix. These peaks are assigned as CF3 symmetric bending mode at 761 cm−1, N–H stretching mode at 1226 and 3583 cm−1, CH3 symmetric stretching mode at 1461 cm−1, C–C and C–N bending mode at 1574, CH2 stretching mode at 2963 cm−1, and C–H vibrational mode for cyclic BmIm+ at 3121 and 3157 cm−1. These C–H vibrational modes for cyclic BmIm+ imply the interactive bonds between O− from PMMA and BmIm+ from BmImTFSI, which accelerate the ion dissociation. A weak peak, which is assigned as C–Cl stretching mode of PVC, is shifted from 847 to 845 cm−1 and its intensity is increased from 0.5% to 27.14% in transmittance mode. This indicates the interaction of PVC and BmImTFSI. The downward shift in C = C stretching mode of PVC (from 1653 to 1631 cm−1) also implies the complexation between PVC and BmImTFSI.
Similar observation is observed at 789 cm−1, which is assigned as combination of C–S and S–N stretching mode of LiTFSI and BmImTFSI. It shifts from 791 cm−1. The intensity of this peak has been enhanced by 30.93% in transmittance mode, which is from 0.5% to 31.43%. Upon addition of 60 wt% of BmImTFSI, the characteristic peak at 1053 cm−1 exhibits upward shift. In term of peak intensity, it increases by 41.89% in transmittance mode, from 5.25% to 47.14%. The characteristic peaks at 1330 and 1346 cm−1 are assigned as C–SO2–N bonding mode of LiTFSI and BmImTFSI and SO2 asymmetric stretching mode of LiTFSI and BmImTFSI, respectively. The first characteristic peak shifts upward, from 1327 to 1330 cm−1. In contrast, the downward shift is shown for latter peak, from 1349 to 1346 cm−1. Apart from that, a noticeable change in shape is observed, from a medium sharp peak with a shoulder to two new weak peaks. These changes in shift, changes in shape, and changes in intensity have divulged the interaction between polymer blends, LiTFSI, and BmImTFSI due to the addition of BmImTFSI into the polymer matrix. Another evidence to prove the interaction between PVC, LiTFSI, and BmImTFSI is observed at 740 cm−1. This characteristic peak is shifted from 746 cm−1, as shown in Fig. 7(a).
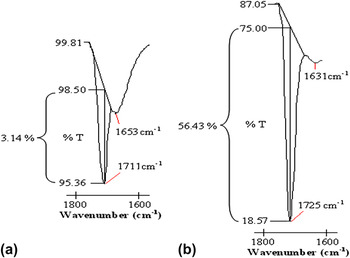
Moreover, the interaction of PMMA and BmImTFSI is proven in Fig. 7. Both characteristic peaks at 966 and 988 cm−1 exhibit upward shifts from 963 and 981 cm−1, respectively. The intensity of C–O–C symmetric stretching peak at 1284 cm−1 increases by 7.97% in transmittance mode, from 0.6% to 8.57%, and shifts to 1281 cm−1 upon addition of 60 wt% of BmImTFSI. This reveals the interaction between O− and BmIm+, which leads to the ion transportation by breaking the coordination bond and reforming the bonds. Another proof to verify the ion transportation is observed at 1725 cm−1. As shown in Fig. 8, the peak intensity is greatly increased, from 3.14% to 56.43%, in transmittance mode. It is assigned as C = O stretching mode of PMMA and is shifted from 1711 to 1725 cm−1 with inclusion of 60 wt% of BmImTFSI. The increase in intensity discloses that the interaction between O− and BmIm+ accelerates the dissociation of BmImTFSI. Comparing Figs. 7(c)–7(e), the intensity of this peak increases with BmImTFSI mass loadings indicating that more interactions of O− with BmIm+would be formed with higher amount of BmImTFSI. Thus, the ion hopping mechanism is more favorable, which gives rise to high ionic conductivity of IL 6. This result is in agreement with AC impedance studies.
The comparison of change in intensity of C = O stretching bonding mode of PMMA in (a) IL 0 and (b) IL 6.

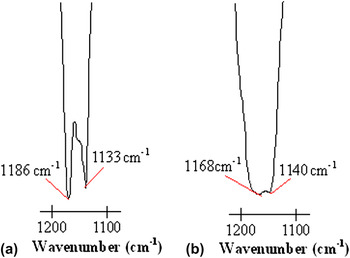
Upon 60 wt% of BmImTFSI, the weak peak at 708 cm−1 is designated as cis C-H wagging mode of PVC and is shifted to 698 cm−1. The intensity of this peak also increases obviously due to the overlapping of C–H vibrational mode for cyclic BmIm+ of BmImTFSI. An apparent change in shape is observed in the wave number range of 1200–1100 cm−1, as shown in Fig. 9. The first peak represents the combination of C–O–C asymmetric stretching mode of PMMA and C–SO2–N bonding mode of LiTFSI and BmImTFSI, whereas the second peak is assigned as the combination of CH2 twisting mode of PMMA and CF3 symmetric stretching mode of LiTFSI and BmImTFSI. The first peak shifts from 1133 to 1140 cm−1, whereas the second peak manifests downward shift, from 1185 to 1168 cm−1. With regards to the change in shape, two sharp peaks have been changed to two weak peaks. This is mainly due to the overlapping of C–H vibrational mode for cyclic BmIm+with polymer matrix, which induces the interaction of BmImTFSI with PMMA and LiTFSI. This indicates the complexation between PMMA, LiTFSI, and BmImTFSI and, consequently, produces the ionic migration within the polymer matrix.
The comparison of change in shape of vibrational modes in (a) IL 0 and (b) IL 6 in the wave number range of 1200–1000 cm−1.

To further investigate the ion aggregation, the bands in the wave length region of 1400–1100 cm−1 are explored. The remarkable downward shift is obtained with increasing the BmImTFSI loading. The peak shifts from 1185 cm−1 (IL 0) to 1182 cm−1 (IL 2), 1180 cm−1 (IL 5), and 1168 cm−1 (IL 6). This reveals the high CF3− aggregations and induces lesser agglomeration of cations, which is in accordance with higher ionic conductivity. The broadest band of IL 6 at 1168 cm−1 infers that more CF3− aggregations in IL 6 compared to IL 2 and IL 5. So, it leads to lesser interaction between CF3− and polymer matrix and induces to lower peak intensity. In order words, more Li cations are detached from the coordinative bonds. The downward shift is also observed for SO2 asymmetric stretching mode of LiTFSI and BmImTFSI. It shifts from 1349 cm−1 for IL 2 to 1348 cm−1 (IL 5) and 1346 cm−1 (IL 6). This infers the high SO2−aggregation. Again, it contributes to higher ionic conductivity with lower frequency.
IV. CONCLUSION
BmImTFSI-based gel polymer electrolytes were prepared by solution casting technique. The highest ionic conductivity of (1.64 ± 0.01) × 10−4S/cm is achieved upon addition of 60 wt% of BmImTFSI due to its maximum mobility and concentration of charge carriers. Frequency response of ionic conductivity study reveals the non-Debye characteristic of polymer electrolytes. It also divulges the CBH mechanism. In dielectric study, the dielectric constant rises enormously with decreasing the frequency, which is related to the accumulation of charge carriers at the electrode–electrolyte interface. Dielectric moduli studies are further investigated by suppressing the electrode polarization effect. ATR–FTIR divulges the changes in intensity, changes in shift, and changes in shape of the spectrum and thus implies the complexation between PMMA, PVC, LiTFSI, and BmImTFSI.
ACKNOWLEDGMENTS
This work was supported by the Exploratory Research Grant Scheme (ERGS: ER017-2011A) and Universiti Malaya Research Grant (UMRG: RG140-11AFR). One of the co-author gratefully acknowledges the “Skim Bright Sparks University Malaya (SBSUM)” for the financial support.