I. INTRODUCTION
In silicon (Si) complementary metal-oxide-semiconductor (CMOS) chip technology, silicon-oxycarbide (SiC x O y ) materials have been extensively used in a polymorphic form, for example as low-k dielectrics, passivation layers, and etch-stop layers to name a few. Reference Grill, Gates, Ryan, Nguyen and Priyadarshini1,Reference King2 SiC x O y materials have also been the focus of studies due to their potential application in a plethora of other technological applications (e.g., light emission, energy, and bioapplications); particularly as white light emitting materials, Reference Gallis, Nikas, Suhag, Huang and Kaloyeros3,Reference Vasin, Nazarov, Balestra, Valeriya and Flandre4 filters, porous adsorbents, and catalytic supports, Reference Tamayo, Rubio, Rubio, Oteo and Riedel5,Reference Kim, Kim and Park6 as hydrogen storage materials, Reference Nghiem, Cho and Kim7 gas sensors, Reference Karakuscu, Ponzoni, Aravind, Sberveglieri and Soraru8 negative electrode materials for lithium batteries, Reference Liu, Xie, Zheng, Wang and Jing9,Reference Bhandavat and Singh10 and in biomedical devices. Reference Zhuo, Colombo, Pantano and Vogler11
Furthermore, it is highly attractive to fabricate nanostructured materials for light emission applications (e.g., photonics and solid state lighting) based on environmentally benign Si-based materials, similar to the rapid advances seen in Si nanophotonics. Reference Liang and Bowers12,Reference Fang, Chen and Zhao13 Such fabrication methods could potentially reduce manufacturing costs and process complexity owing to the seamless integration of Si-based materials with processes developed in semiconductor CMOS technology areas and by using the existing silicon microelectronics infrastructure. The premise behind the high interest in scale down is the possible confinement in one (1D) or two (2D) dimensions, leading to new compelling properties [e.g., the increase of extraction efficiency of spontaneous emission and suppression of Auger recombination (AR)]. Reference Fan, Villeneuve, Joannopoulos and Schubert14,Reference Guichard, Kekatpure, Brongersma and Kamins15 Therefore, the functionality of such nanostructured materials and their devices can be used in a ubiquitous way on light emission applications. Reference He, Fan and Lee16
At the same time, emphasis needs to be placed on identifying and eliminating potential obstacles that may limit the luminescence efficiency of such nanostructured materials, and in particular, their dependence on temperature and power density. The light emission efficiency of luminescent materials can be influenced by fluctuations in temperature/power-density. Reference Zhao, Riemersma, Pietra, Koole, Donegá and Meijerink17,Reference Tayagaki, Fukatsu and Kanemitsu18 This can become critical, as for example, in warm white light emitting diode (LED) applications with devices operating at high temperature (∼150 °C) and power density (∼200 W/cm2). In these instances, the dependence of the luminescent material emission on temperature and power-density has a great influence on the light output and color chromaticity.
Prior work by the present investigators has been dedicated to the development of a thermal chemical vapor deposition (CVD) strategy for the growth of SiC x O y thin films for light emission applications. Reference Gallis, Nikas, Eisenbraun, Huang and Kaloyeros19 These studies led to the identification of a deposition process window for the growth of silicon oxycarbide (SiC x O y ) thin films with strong room-temperature light emission. In particular, it was demonstrated that SiC x O y thin films can exhibit intense luminescence in a broad emission spectral range that covers the whole visible range and exhibits strong similarities to that of the scattered sun radiation. Reference Gallis, Nikas, Suhag, Huang and Kaloyeros3 The work also included the demonstration of near-infrared emission at the commercially useful telecommunication wave length of 1540 nm from erbium-doped SiC x O y (SiC x O y :Er) films under visible broadband excitation. Reference Gallis, Nikas, Huang, Eisenbraun and Kaloyeros20
Herein, we report results pertaining to room-temperature visible photoluminescence (PL) from thermal CVD-grown SiC x O y sub-100 nm nanowire (NW) materials fabricated by electron beam lithography (EBL) and reactive ion etching (RIE). Additionally, the studies focused on the thermal-oxidation and power density behavior of SiC x O y NWs yielded promising results as they exhibit very good PL thermal-oxidation/power stability. These novel Si-based nanostructured materials may offer an alternative pathway to achieving efficient visible light emission with potentially reduced process complexity and cost, which may serve as the incubator of nontoxic light emitting materials thus further limiting environmental impacts associated with the usage of heavy metal/toxic materials.
II. EXPERIMENTAL DETAILS
A. Materials
The SiC x O y thin films are synthesized in a hot-wall quartz tube reactor by thermal CVD at 800 °C. A single source oligomer [2,4,6-trimethyl-2,4,6-trisila-heptane (C7H22Si3)] is utilized as the source precursor for Si and carbon (C). Ultra-high purity (99.999%) oxygen (O2) and argon (Ar)/nitrogen (N2) are also used as, respectively, co-reactant and dilution gases. Typical deposition parameters are: reactor pressure of 1–5 Torr; precursor and Ar/N2 flow rates of, respectively, 5–15 sccm and 450 sccm. The films are deposited onto three types of substrates: single-crystal silicon (c-Si) (100), for composition, structural, and optical analysis; double-polished intrinsic Si, and high-quality ultraviolet (UV) transparent fused silica, for infrared and optical studies. The composition of the resulting 120 nm-thick amorphous SiC x O y≤1.73 (0.11 < x < 0.65) thin films is regulated by modifying the oxygen flow rate and, therefore, the oxygen partial pressure in the reaction zone.
B. Nanofabrication
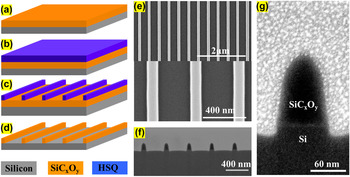
SiC x O y nanostructured systems were fabricated by EBL and RIE, namely, periodically-ordered sub-100 nm NW arrays. A representation of the baseline nanofabrication scheme of the SiC x O y NW arrays is schematically depicted in Fig. 1. Following the synthesis of SiC x O y thin films, negative hydrogen silsesquioxane (HSQ) (6% HSQ in methyl-isobutyl-ketone solvent) resist is spun onto 4 × 4 cm2 SiC x O y wafer pieces—deposited on double-polished or p-type doped Si (100)—at 1000 rpm, following a bake procedure for 4 min at 80 °C, yielding ∼170 nm-thick HSQ. Line patterns are exposed using EBL, in particular a Vistec VB300 e-beam lithography system (Vistec, Jena, Germany), and then the resulting wafer piece is developed in a chemical solution bath [low-concentration (2.38%) of tetramethylammonium hydroxide (TMAH) developer], yielding 2D-NW HSQ patterns. By designing a test-site for exposure dose experiments, the optimum exposure (dose: Cb/cm2) and development conditions (time: s) were identified for the nanostructure architecture.
(a–d) Schematic representation of the fabrication steps of SiC x O y NWs: (a) deposition of 120 nm-thick SiC x O y thin film on substrate, (b) spin-coating of HSQ resist, (c) pattern fabrication on the resist, and development in 2.38% TMAH solution and (d) RIE-etch of HSQ mask resulting in 120 nm-thick SiC x O y NW arrays; (e) top-down and (f) low magnification cross-section scanning electron microscope (SEM) images of the RIE-etched SiC x O y NWs with ∼70 nm width (FWHM) and 400 nm pitch and (g) high magnification cross-section SEM image of single 70 nm-width NW (the cross sections were made with a focused ion beam—the structures were covered with Pt prior to cutting).

The HSQ patterns then underwent a hardening annealing process in Ar/N2 ambient at 500 °C. Then a fluorine-based (e.g., combination of CHF3 and CF4 gases) anisotropic RIE transfers the pattern into the SiC x O y thin films. The HSQ residue is then removed by wet etching in buffered hydrofluoric acid, resulting in periodically well-defined 120 nm-thick NWs. The dimensions (width: W and pitch/periodicity: P) of the nanofabricated NWs are also shown in Fig. 1. The SiC x O y NWs underwent different postfabrication thermal treatments for 2 h at annealing temperatures in the range of 50–250 °C in the following atmospheres: Ar or O2. The effects of Ar and O2 thermal passivation treatments on the structural (e.g., electronic configuration/bonding properties) and optical (e.g., index of refraction, optical gap) properties of the resulting samples were investigated using Fourier transform infrared spectroscopy (FTIR), ultraviolet-visible spectroscopic ellipsometry (UV-VIS-SE), x-ray photoelectron spectroscopy (XPS), and Rutherford backscattering (RBS) analysis.
The optical measurements for determining the index of refraction (n) and the optical gaps of the nanostructured materials were performed on a SOPRA UV-VIS-SE (Semilab, Budapest, Hungary). The PL measurements were performed in a FLSP920 spectrometer with two double monochromators from Edinburgh Instruments (Edinburgh, United Kingdom). The micro-PL measurements were carried out using a custom made micro-PL setup consisting of a TRIAX 550 monochromator, a Beamlok-7S Ar-ion laser, an optical setup with a 50× objective lens, and a visible photomultiplier tube (PMT) water-cooled detector from Hamamatsu. Calibration of the detection system and determination of the response function were performed with a NIST traceable quartz tungsten halogen lamp (63355 from Newport Corporation, Irvine, California) with a known spectral irradiance at 50 cm given in W/cm2 nm.
III. RESULTS AND DISCUSSION
A. Structural and optical properties
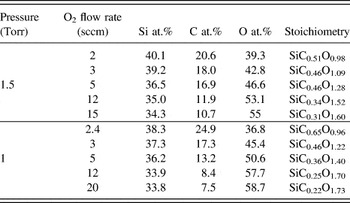
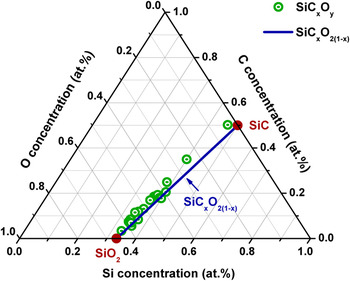
Table I summarizes the compositions of representative SiC x O y thin films deposited at various O2 flow rates and pressures, as determined by XPS and RBS measurements. The compositional evolution of the SiC x O y thin films was plotted in a Si–C–O ternary diagram (Fig. 2) along with the SiC x O2(1−x) (0 < x < 1) line, with the latter representing stoichiometric silicon oxycarbide without any excess carbon. The upper and lower limits in SiC x O2(1−x) correspond to SiC and SiO2, for respectively, x = 1 and x = 0. Reference Kroll21,Reference Bréquel, Parmentier, Walter, Badheka, Trimmel, Masse, Latournerie, Dempsey, Turquat, Chomel, Le Neindre-Prum, Jayasooriya, Hourlier, Kleebe, Soraru, Enzo and Babonneau22
Elemental composition and stoichiometry of representative thermal CVD-grown SiC x O y samples at different deposition process parameters (precursor flow rate: 10 sccm; Ar flow rate: 450 sccm; and deposition temperature: 800 °C).

Si–C–O ternary diagram with the compositions of AD silicon oxycarbide (SiC x O y ) materials as they were determined by XPS and RBS measurements. The solid line shows the composition of the stoichiometric silicon oxycarbide, SiC x O2(1−x) (0 < x < 1), along with the positions of the SiO2 and SiC, for respectively, x = 0 and x = 1.

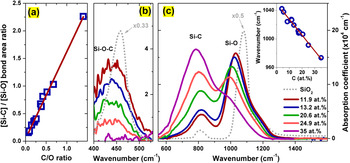
As is shown in Fig. 2, the composition of the thermal CVD grown SiC x O y was properly tailored to closely follow the pure stoichiometric oxycarbide formula over the whole range of the synthesis process parameters. This is in contrast to nonstoichiometric compositions reported for SiC x O y samples with SiC/SiO2 phases and free carbon, as it is shown in Fig. 1 of Ref. Reference Bréquel, Parmentier, Walter, Badheka, Trimmel, Masse, Latournerie, Dempsey, Turquat, Chomel, Le Neindre-Prum, Jayasooriya, Hourlier, Kleebe, Soraru, Enzo and Babonneau22. The SiC x O2(1−x) behavior observed in the samples produced herein suggests the substitution of two divalent oxygen atoms by one tetravalent carbon atom, as the C concentration in the SiC x O y materials increases. The latter is also proposed owing to the linear increase of the [Si–C]/[Si–O] bond–area ratio, calculated by FTIR analysis, with increasing C/O content ratio [Fig. 3(a)].
(a) The [Si–C]/[Si–O] bond–area ratio plotted as a function of the C/O content ratio showing a linear increase with increasing C/O; (b) The FTIR absorptions of the Si–O–C bonding configuration around ∼437 cm−1 of AD SiC x O y for different C contents. For comparison purposes the FTIR absorption of a thermally-grown SiO2 control sample is also displayed (dotted gray line). The peak positions of the AD SiC x O y appear red-shifted compared to the SiO2 control, due to the incorporation of less electronegative C. The increase of the C content in SiC x O y results in the decrease in the Si–O–C intensity; (c) The FTIR absorption spectra of the AD SiC x O y and SiO2 control in the 550–1600 cm−1 range. The inset displays the TO Si–O vibration frequency versus C content.

Figure 3(b) shows the FTIR data of SiC x O y thin films at ∼440 cm−1, attributed to Si–O–C bonding groups as it has been reported elsewhere, Reference Gallis, Nikas, Suhag, Huang and Kaloyeros3,Reference Wolfe, Hinds, Wang, Lucovsky, Ward, Xu, Nemanich and Maher23–Reference Kim, Hwang, Kim, Kim and Lee25 which is caused by the ≡Si–O–Si≡ rocking mode due to out of plane motion of O in O(3−x)C x ≡Si–O–Si≡C y O(3−y) and is virtually unaffected by the bond angle variation. Reference Tolstoy, Chernyshova and Skryshevsky24,Reference Lehmann, Schumann and Hubner26 Additionally, the important role of Si–O–C bonding in the observed visible luminescence from SiC x O y was demonstrated, as its emitted luminescence intensity increases in direct correlation with the increased density of Si–O–C. Reference Nikas, Gallis, Huang, Kaloyeros, Nguyen, Stesmans and Afanas'ev27 The replacement of two bridging oxygen atoms by one carbon atom, as dictated by the SiC x O2(1−x) stoichiometry, results in the observed decrease in the Si–O–C intensity. In samples with C content higher than 25 at.%, the density of Si–O–C bonding groups is significantly suppressed, suggesting that the backbone network associated to the ≡Si–O–Si≡ bonding in SiC x O y transitioned toward more SiC-like structures.
Figure 3(c) shows the FTIR spectra of SiC x O y in the 550–1600 cm−1 range. The spectra are characterized by two major absorption bands and a shoulder assigned to the Si–C stretching and Si–O transverse and longitudinal stretching vibration modes, centered at, respectively, ∼800, ∼1000, and ∼1150 cm−1. Reference Gallis, Nikas, Eisenbraun, Huang and Kaloyeros19,Reference Gallis, Nikas, Huang, Eisenbraun and Kaloyeros20 FTIR studies also showed the absence of C=C bonds at ∼1644 cm−1, which would result from the sp 2-carbon molecular orbitals. Reference Gallis, Nikas, Eisenbraun, Huang and Kaloyeros19 The substitution of O with C atoms is reflected to the increase of the Si–C and subsequent decrease in the Si–O absorption band intensities. Furthermore, it was found that the Si–O vibration frequency red-shifts in a linear fashion with increasing C content [inset of Fig. 3(c)], as the less electronegative C atoms replaces O atoms, suggesting that the Si–O–Si bond angle between tetrahedra decreases. Reference Tolstoy, Chernyshova and Skryshevsky24,Reference Kim, Hwang, Kim, Kim and Lee25 Consequently, the mass density of the as-deposited (AD) SiC x O y is expected to increase with increasing C content, which is in agreement with our previous findings. Reference Gallis, Nikas, Eisenbraun, Huang and Kaloyeros19
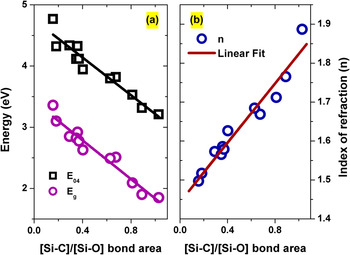
The structural evolution of the AD silicon oxycarbide materials along the SiC x O2(1−x) stoichiometry was also reflected in their optical properties. For example, the E 04 gap corresponds to the energy where the absorption coefficient (α) is equal to 104 cm−1 (α(E 04) = 104 cm−1), and the index of refraction (n). Figure 4(a) shows the E 04 and the Tauc E g gaps that were determined from optical absorption measurements using the Tauc's plots, as a function of the [Si–C]/[Si–O] bond–area ratio. Both E 04 and E g were found to decrease with the increasing [Si–C]/[Si–O] ratio. This behavior can be explained by considering the smaller splitting energy difference between the bonding and anti-bonding electronic states in Si–C bonds in comparison to Si–O bonds. Reference Sun28 Thus, the incorporation of additional carbon enhances the bond density difference between Si–C and Si–O, as represented by the [Si–C]/[Si–O] ratio, thereby further decreasing the splitting of their corresponding bonding and antibonding states.
(a) E 04 and Tauc E g energy values for different SiC x O y materials versus the [Si–C]/[Si–O] bond ratio. The E g was determined based on the Tauc's equation, (αhν)1/2 = B 1/2(hν − E g), where α is the absorption coefficient, hν is the photon energy and B is the slope, which is inverse proportional to the width of the tail band. The solid lines depict the linear [Si–C]/[Si–O] dependence; (b) the index of refraction at 800 nm of different SiC x O y given as a function of the [Si–C]/[Si–O] bond ratio. The solid line is the linear fit of the displayed data.

Furthermore, an examination of the index of refraction (n) of SiC x O y showed a linear increase of n with increasing [Si–C]/[Si–O]. The linear behavior of n versus [Si–C]/[Si–O] over the range analyzed can be partly associated with an increase of mass density in SiC x O y with increasing [Si–C]/[Si–O]. Reference Gallis, Nikas, Eisenbraun, Huang and Kaloyeros19 Additionally, the increase of the C content results in an increased molecular polarizability and decreased molecular weight of SiC x O y , both contributing to the increase of the index of refraction, as dictated by the Lorenz–Lorenz equation. Reference Gallis, Nikas, Huang, Eisenbraun and Kaloyeros20
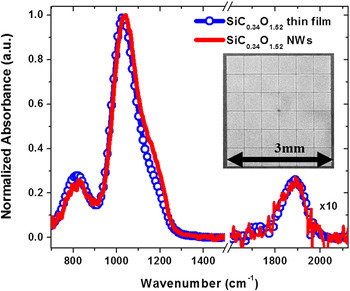
By virtue of the relationship of the carbon-over-oxygen-dependent index of refraction and the tunable optical gap of SiC x O y materials, properly tailored SiC x O y NW arrays were fabricated. Specifically, 400 nm-periodically-ordered SiC0.34O1.52 and SiC0.25O1.70 NW arrays were used due to their high density of Si–O–C bonding. Moreover, large SiC x O y NW structures (3 × 3 mm arrays of 70 nm-width NWs) were also fabricated on intrinsic Si substrates to perform bonding configuration analysis. The normalized absorbance FTIR spectra of both the AD SiC0.34O1.52 thin film and the as-fabricated NWs are shown in Fig. 5. It was observed that the bonding configuration of the SiC0.34O1.52 NW system was maintained, along with its structural characteristics, as inferred by the relative intensities between Si–C and Si–O bond densities, which remain the same as in the case of the AD thin film counterpart. The latter can be also observed in the unchanged bonding configuration of C=O related vibration mode at ∼1900 cm−1. A slight relative increase of the Si–O vibration mode at ∼1200 cm−1 may be attributed to a very small oxidation induced on the surface of the as-fabricated NWs.
Normalized FTIR absorbance spectra of 70 nm-width SiC0.34O1.52 NW array and its thin film counterpart. In the inset an SEM image of the 3 × 3 mm2 array used for the measurement is shown, which consists of 36 blocks of 490 × 490 μm2 NW arrays with 10 μm spacing between the blocks.

B. PL properties
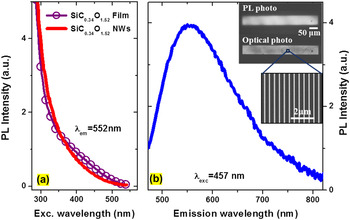
Figure 6(a) shows the normalized room-temperature PL excitation (PLE) and emission spectra of SiC0.34O1.52 NW arrays. The PLE spectrum monitored at the peak luminescence emission (∼550 nm) spans the range of 300–550 nm, from near-UV to blue/green region of the spectrum. The PL emission spectrum of SiC0.34O1.52 NWs exhibits broadband characteristics ranging from blue to deep red, that is, from 470 to ∼740 nm, with a full width at half maximum (FWHM) of ∼0.5 eV.
(a) Room-temperature PLE spectra of 120 nm-thick SiC0.34O1.52 thin film and its corresponding 70 nm-width SiC0.34O1.52 NWs (400 nm pitch) measured at its emission peak; (b) room-temperature PL spectrum of the as-fabricated SiC0.34O1.52 NWs excited at λexc = 457 nm. The inset shows the camera photo of the observed strong visible PL under blue light excitation and its corresponding optical photo. The dimension of the studied NW array structure is 50 μm × 500 μm and the PL photo was taken with a common camera with the use of an optical setup equipped with a 50× lens and a 475 nm long-wave pass filter.

To better understand the visible light emission in SiC x O y NWs, their PL and PLE properties were explored in conjunction with data from their thin films counterparts, which were also used as baseline for comparison purposes. The analysis revealed almost identical PLE emission spectra between NWs and thin films [Fig. 6(a)], indicating that there is no change in the excitation path and emission origin of the observed luminescence in SiC0.34O1.52 NWs. This is also in agreement with the infrared (IR) absorption data comparing that for NWs with their thin films counterparts. There was no significant change in the bonding configuration (e.g., [Si–C]/[Si–O] bond–area ratio) in the NW IR spectrum upon nanofabrication. The observed visible light emission from SiC x O y NWs is therefore likewise assigned to radiative recombination of photo-excited carriers in electronic states and/or band tail states associated with C–Si/Si–O–C bonding groups. Reference Nikas, Gallis, Huang, Kaloyeros, Nguyen, Stesmans and Afanas'ev27 This finding is in contrast to PL emission from structural defects (e.g., Si-related oxygen deficiency centers and/or neutral oxygen vacancies) typical seen in oxides. Reference Nikas, Gallis, Huang, Kaloyeros, Nguyen, Stesmans and Afanas'ev27,Reference Skuja29
Due to the amorphous nature of the SiC x O y NWs, their broadband PL characteristics may be thereby attributed to the inhomogeneous constitution of the electronic states and the band tails related to C–Si/Si–O–C bonding, i.e., each contributes with a slightly different energy resembling small differences in the local environment of the C–Si/Si–O–C bonding. The broadband emission spectrum, which is determined by static disorder, has been observed in amorphous SiC x luminescent materials. Reference Tessler and Solomon30
C. Thermal-oxidation and photoexcitation power-density stability
To further understand the properties of luminescent nanostructured materials, a study of their photo and thermal properties is required. Thus, in addition to PL emission and photo-excitation measurements, the PL performance of the SiC0.34O1.52 NW system was studied as a function of temperature, varying from room temperature to 250 °C, in either oxygen or argon ambient. To study saturation processes, the NWs were exposed to high intensity blue laser radiation (up to ∼800 W/cm2).
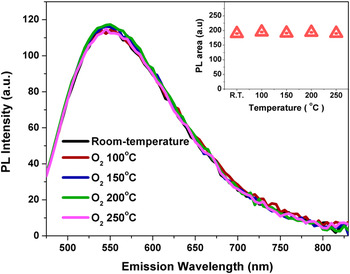
First, thermal treatments did not cause any change in the chemical structure of the SiC0.34O1.52 nanostructured material, as observed in IR absorption measurements. With respect to subsequent PL measurements of the NWs, their emission intensity dependence on the annealing temperature did not reveal any change (as seen in Fig. 7) indicating that there is no thermal-oxidation degradation in our nanostructures. The oxidation rates and the activation energies of SiC x O y materials are similar to those for SiC, whereas the diffusion of oxygen into the matrix, with simultaneous CO diffusion outwards, typically governs the oxidation rate. Reference Chollon31
PL spectra of the AD and 2 h-oxygen-annealed SiC0.34O1.52 NW at various temperatures (excitation wave length λexc = 457 nm). The inset shows the integrated PL intensity versus annealing temperature.

The reaction of the oxidation for SiC
x
O
y
can be described by the following equation:
 ${\rm{Si}}{{\rm{C}}_x}{{\rm{O}}_{2{{\left( {1 - x} \right)}_{{\rm{(s)}}}}}} + {{3x} \over 2}{{\rm{O}}_{{2_{{\rm{(g)}}}}}} \to {\rm{Si}}{{\rm{O}}_{{2_{{\rm{(s)}}}}}} + x{\rm{C}}{{\rm{O}}_{{\rm{(g)}}}}$
. Hence, the SiC
x
O
y
material (with higher carbon content) appears to be significantly more resistant to oxidation annealing, for example, compared to its SiO2-like counterpart (with very low carbon content).
Reference Gallis, Nikas, Suhag, Huang and Kaloyeros3
This behavior is attributed primarily to the fact that the higher carbon SiC
x
O
y
has a higher density of Si–C bonds (as seen in Fig. 3), which is in turn translates into higher mass density than that of SiO2-like, and thus more effectively preventing oxygen diffusion inwards. This compelling behavior may provide a pathway for further controlling and enhancing the thermal stability of visible light emission at elevated temperatures (>500 °C) from such nanostructured materials through optimal engineering of Si–C/Si–O bonds in the matrix. In addition to the fact that the emission intensity is temperature independent, the lineshape of the observed visible light emission remains also unchanged (Fig. 7), showing good light emission stability for the SiC
x
O
y
nanostructured materials produced herein.
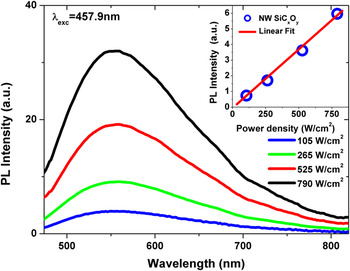
Second, the power dependence results at high continuous wave (cw)-excitation levels revealed that the integrated PL of SiC0.34O1.52 NWs remained linear over the investigated probing laser intensity range (100–800 W/cm2), as depicted in Fig. 8. It is worth noting that there was no change in the peak position and the lineshape of the PL in the NWs, revealing good emission stability at high excitation intensity.
Room-temperature PL spectra of the 70 nm-width SiC0.34O1.52 NWs for different cw excitation probing power-densities (excited at the λexc = 457.9 nm of an Ar ion laser). The inset shows the linear behavior of the integrated PL intensity as a function of the excitation power density.

This provides further evidence supporting the proposed origin of the visible emission in SiC x O y NWs and the absence of defect-related localized emission, as the latter is typically associated with PL saturation or deviation from the linearity (e.g., slope < 1) at high probing power intensity (e.g., due to state filling of the localized states). Reference Tayagaki, Fukatsu and Kanemitsu18,Reference Grieshaber, Schubert, Goepfert, Karlicek, Schurman and Tran32 Moreover, the influence of nonradiative AR on the overall luminescence efficiency of SiC x O y NWs will need to be considered in conjunction with the development of such nanostructures to achieve an improved PL efficiency. The fast AR becomes important under high excitation power densities and also when electron–hole pairs are localized in a small volume, as in Si nanocrystals with long radiative lifetimes, causing PL intensity saturation (bulk Si and Si-based materials). Reference Tayagaki, Fukatsu and Kanemitsu18,Reference Kovalev, Diener, Heckler, Polisski, Kunzner and Koch33
The linear behavior of the PL on the power density may be considered as indicative of a suppression of AR in SiC x O y NWs. The very short radiative lifetime of a few hundreds of picoseconds in the SiC x O y material produced herein (associated data will be presented in a subsequent report) may imply that fast nonradiative processes cannot dominate at high probing power densities. A decrease of the AR rate [(τnr)−1] has been observed in Si NW structures, Reference Guichard, Kekatpure, Brongersma and Kamins15 which is imposed by bimolecular annihilation so that the AR rate is characterized by a linear term (∼n), instead of quadratic term ∼n 2, of the carrier density (n). To obtain more insight into the PL-linearity-on-excitation-power behavior, dedicated studies including temperature dependence PL transient and time-resolved emission spectroscopy measurements will be carried out on SiC x O y NWs with different width dimensions (e.g., sub-15 nm).
IV. SUMMARY
The results presented herein reveal the fabrication of a novel nanostructured material with strong visible light emission based on periodically arranged SiC x O y NWs that emit in a broad visible range under blue light excitation. The composition of the thermal CVD-grown SiC x O y thin films approximate the SiC x O2(1−x) (0 < x < 1) stoichiometry as determined by compositional and structural analysis. The structural and bonding evolution of SiC x O y are well-correlated with their optical properties, namely, the optical gap and refractive index. The latter optical properties were found to exhibit a linear dependence on the [Si–C]/[Si–O] bond–area ratio. Moreover, the photo and thermal properties of the SiC0.34O1.52 NWs yielded very promising results as SiC0.34O1.52 NWs exhibits very good thermal-oxidation and photoexcitation intensity stability. In this regard, the potential advantages offered by the SiC x O y NWs approach proposed herein range from light emission tunability to thermal/photo-stability and from potential cost reduction in processing protocols to environmental benefits.