


INTRODUCTION
Vocabulary size is a basic indicator of children's linguistic development. In the first year of life, infants begin to comprehend and produce words. Between ages 0;8 and 1;4, children's receptive vocabularies nearly double in size every two months (Dale & Fenson, Reference Dale and Fenson1996). From 1;0 to 2;0, their expressive (productive) vocabularies follow a similar, although delayed, path of overall growth. Between 1;6 months and 18;0, children/adolescents have been estimated to acquire approximately ten new words per day, or one new word every 90 minutes that the child is awake (Bloom, Reference Bloom2000). Vocabulary size is often used in developmental studies as a key referential milestone to determine the developmental groups of the children in the study. For example, the literature shows that vocabulary size is a more powerful predictor of grammatical development than age or gender (Bates, Dale, & Thal, Reference Bates, Dale, Thal, Fletcher and MacWhinney1995; Dale & Fenson, Reference Dale and Fenson1996; Fenson et al., Reference Fenson, Dale, Reznick, Bates, Thal, Pethick and Stiles1994).
Thus, the methodology of evaluating vocabulary size has a long history and a substantial accumulation of technical improvements. Here, we mainly focus on the quantitative aspects of the two most widely used sampling schemes: longitudinal observation and questionnaire-based assessment. With both of these methods, there are necessary trade-offs between data collection cost and accuracy of the vocabulary size assessment. Although it is obvious that more data would provide better estimates, keeping track of a child's speech is generally costly, particularly in terms of the time needed to collect and code transcripts (Tomasello & Stahl, Reference Tomasello and Stahl2004). We will briefly review the historical experimental design of vocabulary size assessments and discuss the unique and shared limitations of these two key methods. Then, we will outline our proposed solution to address some of these limitations.
BACKGROUND
Experimental design for vocabulary size assessment
One of the earliest methods described is natural observation, which gives a detailed description of a child's behavior in a natural environment. Typically, trained assessors or caregivers, who are often scientists themselves, record a child's linguistic behavior at home or in another familiar environment for the child (Brown, Reference Brown1968, Reference Brown1973; Darwin, Reference Darwin1877; Dromi, Reference Dromi1987; Leopold, Reference Leopold1949; Tomasello, Reference Tomasello1992; Weir, Reference Weir1962). These studies typically track one or a few children over a period of months or years. A number of theoretical claims about language learning in a natural environment have been made based on longitudinal observational studies. For example, Tomasello (Reference Tomasello1992, Reference Tomasello1995) proposed the ‘verb island’ hypothesis, which states that a child's verb learning is not abstract from the beginning, as predicted by, for example, Chomsky (Reference Chomsky1972), Pinker, (Reference Pinker1991, Reference Pinker1994), and Yang (Reference Yang2004), but is built up from item-based frames. Tomasello based his hypothesis on a longitudinal observation of his young daughter, who produced such item-specific structures.
More recently, advanced recording techniques have allowed for the recording of finer-grained behavioral and linguistic patterns through multisensory recording in the order of milliseconds (Roy, Frank, & Roy, Reference Roy, Frank, Roy, Taatgen and van Rijn2009; Yu & Smith, Reference Yu and Smith2012). These recordings support and extend the classical natural observation methodology by relaxing the problem of subjectivity in relation to the typical observation method. Accurate and large-scale recording of spoken words can enable a nearly perfect sampling of not just speech, but also the context of word usage. This technique could address the ambiguity of the intentions behind words, for example, to distinguish whether a certain word is being used as a noun or verb. Such discerning classification could inform the study of early development. However, one shortcoming of this observation methodology is that data collection is extremely costly, and thus the sampled subjects need to be carefully selected (Braunwald & Brislin, Reference Braunwald, Brislin, Ochs and Schieffelin1979; Mervis, Mervis, Johnson, & Bertrand, Reference Mervis, Mervis, Johnson, Bertrand, Rovee-Collier and Lipsitt1992; Salerni, Assanelli, D'Odorico, & Rossi, Reference Salerni, Assanelli, D'Odorico and Rossi2007; Tomasello & Stahl, Reference Tomasello and Stahl2004). Therefore, generalizing the results to a wider population proves problematic.
An alternative approach to vocabulary size assessment is the use of caregivers' reports based on a standardized questionnaire. In contrast to the high accuracy and cost associated with observations, this method is generally cheap and easy, and thus it is often used when large sample cross-sectional developmental patterns are being investigated (Bates & Carnevale, Reference Bates and Carnevale1993). In a typical questionnaire method, caregivers are asked to check whether their children have either comprehended or uttered each word in a list of standard words usually known by a certain age range of children. For instance, the MacArthur–Bates Communicative Development Inventory(ies) (MCDI(s)) is one such standardized list, which includes 652 words that most children aged 2;6 know (Bates & Carnevale, Reference Bates and Carnevale1993; Fenson et al., Reference Fenson, Dale, Reznick, Thal, Bates, Hartung, Pethick and Reilly1993). Typically, it takes only minutes to check the listed words, and thus it is a popular pre-procedure before the main experimental procedure such as children's inferences about new words (for example, Samuelson & Smith, Reference Samuelson and Smith1999; Yoshida & Smith, Reference Yoshida and Smith2003).
When studying cross-sectional statistics, such as across-children individual variances in vocabulary sizes, the questionnaire-based assessment often correlates with the natural observation-based assessment (Bornstein & Haynes, Reference Bornstein and Haynes1998; Camaioni, Castelli, Longobardi, & Volterra, Reference Camaioni, Castelli, Longobardi and Volterra1991; Reznick & Goldfield, Reference Reznick and Goldfield1994; Ring & Fenson, Reference Ring and Fenson2000; Robinson & Mervis, Reference Robinson and Mervis1999). However, a limitation of the questionnaire method is that it only accounts for a standardized range of age and common words; the vocabulary development of children who know more words than are listed or atypical words may be underestimated (Law & Roy, Reference Law and Roy2008; Robinson & Mervis, Reference Robinson and Mervis1999). This is one of the reasons why the natural observation method is not completely replaceable by questionnaire-based vocabulary assessments.
Cost–accuracy trade-off
As discussed, these methods have trade-off relationships between cost and accuracy, leading to most applications being either expensive and accurate or cheap and limited. The former result is good for longitudinal design, while the latter is more suitable for cross-sectional studies. Thus, a number of studies have discussed methodological improvements by combining the two approaches. Tomasello and Stahl (Reference Tomasello and Stahl2004) discussed the quantitative aspect of the trade-off in relation to the vocabulary sampling size required to sufficiently quantify children's productive vocabulary. This would also consider the duration of the experiment, how frequently the behavior is likely to be observed, and how many children are involved in the study. Their claim is natural: the necessary sample size depends on the specific research question. If the study focuses on low-frequency events, such as developmental change in grammatical errors (for example, Rowland & Fletcher, Reference Rowland and Fletcher2006), it is likely to require dense and frequent sampling across many children.
Vocabulary assessment of growing corpora
With sufficient resources, i.e., where cost is not an issue, is there a simple and accurate measure of vocabulary size? We are pessimistic because, even if perfect sampling is possible, our target corpus – the list of words that children know – is always growing. Counting the vocabulary size of the growing corpora gives rise to issues that do not appear with static corpora. For example, we are often interested in period-by-period developmental change (e.g., daily, weekly, monthly, or yearly) of such growing corpora. However, the sampling rate (or utterance rate with perfect sampling) may not catch up to the growing rate of potential vocabulary size. At age 1;6 or older, a child's vocabulary size grows by approximately ten words per day. Will we be fortunate enough to observe these specific ten words every day? In general, it is difficult to catch up with a rapidly growing corpus, even with perfect sampling, at any resolution. With daily, weekly, monthly, or yearly sampling, will our samples be fortunate enough to include the desired degree of completeness of vocabulary size? The key problem is that the degree of underestimation is unknown.
This ‘run-away’ effect, of the vocabulary size evaluation being unable to catch up with the growing corpus, has two major causes. Obviously, one is a rapid growth in the vocabulary size. The other is a slow rate in sampling less-frequently uttered words, which is often due to a long-tailed distribution of the word frequency. Essentially, there are many rarely spoken words (i.e., those words at the tail-end of a word frequency distribution) that tend to remain unobserved in a limited set of samples. In theory, naive counting of observed types will always underestimate the number of types actually existing in the corpus, which almost inevitably include unobserved types. It is known that, in many cases, practical word frequency distributions follow Zipf's law (Baayen, Reference Baayen2001; Kornai, Reference Kornai2002; Zipf, Reference Zipf1949). This states that empirical word frequency distributions are often determined by a power function of the rank of the word in terms of frequency: p i∝i −a (i = 1, 2, …, N) where p i is the probability of drawing the i-th most frequent word out of N unique words with the exponent parameter a. According to Zipf's law, for a word frequency with exponent a = 1, for example, the probability of sampling a word of the 1000th frequency rank is less than 2/10,000 (p~1·34 × 10–4), and we need to sample more than 22,000 words, (1-(1-p)22000~0·95), in order to make certain that this word is in our sample at a 95% confidence interval. A realistic situation is even more difficult; we do not know how many unique words potentially exist in a corpus and so we do not know when to stop sampling.
Estimating the number of unobserved words
A crucial bottleneck relating to the limitations described above is that estimation accuracy is limited by the sample size of the collected data. The existing methods and potential run-away effects illustrated above are all based on the use of a naive estimator as the vocabulary size: if N unique words are identified in a child's speech corpus with M word tokens, then N is the estimated number of unique words the child knows. Obviously, unless the sample size M is infinite, this naive count estimator almost always underestimates the actual number of words children know. A remedy for this is to increase M, which may be costly or even impossible for a limited time interval for a growing corpus.
However, is it possible to go beyond the limitations of sample-size of the vocabulary assessment? With a more sophisticated estimator, the cost–accuracy trade-off and run-away effects of a growing corpus may be relaxed. The core idea of this study relies on estimating the latent number of types, or the true number of unique words if there was no limit on the number of tokens. If this is possible to some extent with a finite token size, we could accurately evaluate the vocabulary size. Before detailing our theory, we will briefly review the previous literature on the topic.
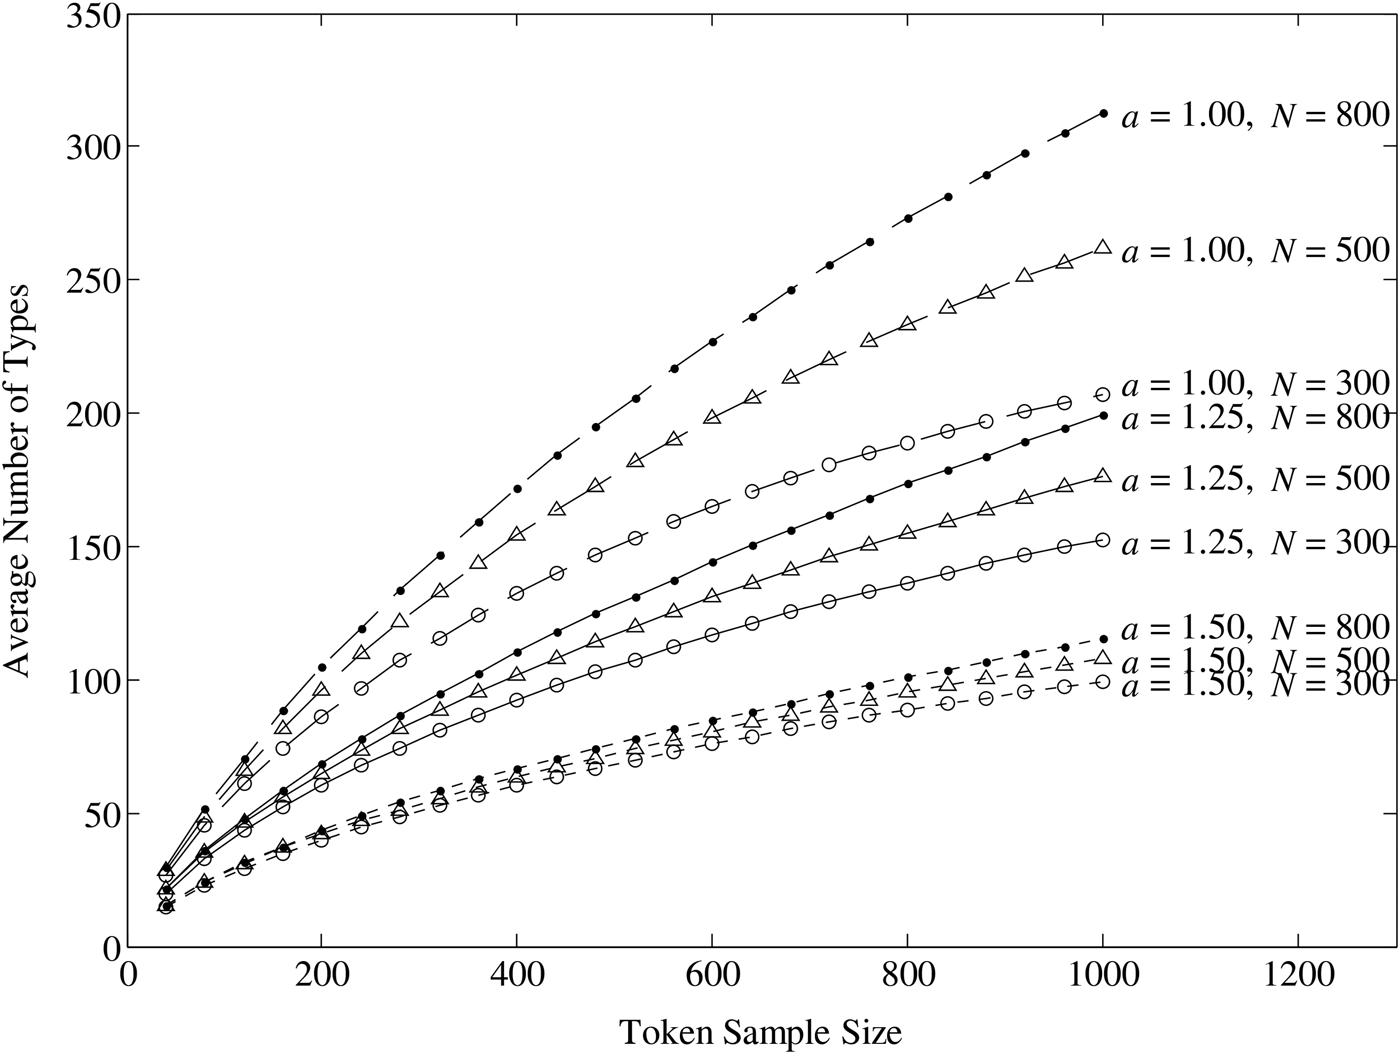
In the ecological and computational linguistics literature, the latent number of species, classes, or words beyond a sample-size limitation has been discussed in relation to quantifying ecological or lexical diversity (Bunge & Fitzpatrick, Reference Bunge and Fitzpatrick1993; Tweedie & Baayen, Reference Tweedie and Baayen1998), or vocabulary sizes (Edwards & Collins, Reference Edwards and Collins2011, 2013; Meara & Alcoy, Reference Meara and Alcoy2010; Thomson & Thompson, Reference Thomson and Thompson1915). There are two distinct approaches to this problem. One is based on the frequency spectrum (Chao & Shen, Reference Chao and Shen2003; Good, Reference Good1953; Horvitz & Thompson, Reference Horvitz and Thompson1952; Tuldava, Reference Tuldava1996), which we will not discuss in the main paper, but for which we have provided an extended analysis and discussion in ‘Appendix 2’. In ‘Appendix 2’, we further explain the relationship between the two approaches and provide a simulation study comparing their performances. The other approach is based on the type–token ratio, which we will focus on here. It is one of the earliest and most frequently used measures of lexical diversity with respect to vocabulary size assessment. The type–token ratio is the ratio of the number of types (referring to the number of unique word types) relative to tokens (the number of sampled words). In Figure 1, each line shows an average type–token curve, with the number of types as a non-decreasing function of the number of tokens, when we randomly draw words whose frequency follows a Zipf distribution, p i∝i−a (i = 1, 2, …, N). We use the exponents a = 1, 1·25, and 1·5, and the latent number of types N = 300, 500, and 800. These sets of parameters cover a range of parameters for empirical data found in development studies (see also ‘Study 1’ for an extension of the Zipf distribution).
The average number of types as a function of the number of sampled tokens from a numerical simulation (dashed line for a = 1, solid one for a = 1·25, and dotted one for a = 1·5) and as predicted by the general type–token distribution theory described below (solid lines). The colors indicate that words were drawn from corpora with the latent number of types N = 300 (circles), N = 500 (triangles), or N = 800 (dots).

The type–token ratio generally depends on the number of tokens, as indicated in Figure 1. The type–token ratio is not a reliable measure as is because it is not directly comparable for two corpora with different numbers of word tokens. In Figure 1, the slope of each curve at a higher token size is less steep, indicating a lower type–token ratio. In general, this shows the sample size effect – given a larger number of tokens, the number of types tends to have a lower type–token ratio than those given by a smaller number of tokens. Thus, many studies have proposed modified measures to normalize the sample size effect so that the ratio can be used as an indicator of lexical diversity. The earliest attempts involved a sample-size correction approach using a functional transformation (Dugast, Reference Dugast1979; Guiraud, Reference Guiraud1954; Herdan, Reference Herdan1960; see also the review by Tweedie & Baayen, Reference Tweedie and Baayen1998). However, these measures are not invariant to the number of tokens (Weitzman, Reference Weitzman1971). A more recent proposed approach is a curve-fitting method using the type–token ratio as a function of the sample size (Edwards & Collins, Reference Edwards, Collins, Jarvis and Daller2013; Malvern & Richards, Reference Malvern and Richards2002, Reference Malvern, Richards and Chapelle2012; McCarthy & Jarvis, Reference McCarthy and Jarvis2007). Malvern and Richards (Reference Malvern and Richards2002, Reference Malvern, Richards and Chapelle2012) proposed using the slope parameter in the curve fitting of the type–token ratio as a measure of lexical diversity. While curve fitting seems attractive because a large sample size is not needed if the curve can be estimated with a small number of samples, McCarthy and Jarvis (Reference McCarthy and Jarvis2007) showed that the curve-fitting parameter is not invariant to different sample sizes. McCarthy and Jarvis recently proposed a measure of textual lexical diversity (MTLD), a variant of mean segmental type–token ratio with a varying segment size, for evaluation of lexical diversity (McCarthy & Jarvis, Reference McCarthy and Jarvis2010). Although they claim this measure is invariant to different sample sizes, there is currently no clear theoretical relationship to the number of types.
General type–token distribution
Although, as discussed, there are few satisfying theoretical solutions for estimating the latent number of types, our recent study offers an estimator of the word frequency distribution based on a general theoretical distribution of a type–token curve (Hidaka, Reference Hidaka2014). The estimator is based on the general type–token distribution and will be described below. Figure 1 shows the number of types computed based on a general type–token distribution (solid lines) and that computed in Monte Carlo simulations (marked points) with different latent numbers of types (N = 300, 500, and 800) and exponents for power distributions (a = 1, 1·25, and 1·5). In each of the nine cases, the number of sampled types is smaller than the corresponding latent number of types, and the number of sampled types increases as a function of the number of tokens on average. Most importantly, the theoretical values fit the numerical values almost perfectly; the correlations between the theoretical and numerical numbers of types show a nearly perfect fit (R > ·97). The true word distribution– the latent number of words and the exponent parameter of the power distribution in these cases– can reproduce a well-fitting curve with the sampled number of types. In general, a corpus with a large number of words yields a quicker rise in a type–token curve (compare curves of N = 800 with those of N = 300 in Figure 1), while a corpus with a skewed distribution (with many rare words corresponding to a larger exponent in a power distribution) yields a slower rise (compare curves of a = 1·5 with those of a = 1·0 in Figure 1). Therefore, by fitting the theoretical distribution of the number of types, we can estimate the latent number of types for a corpus with a finite token size.
Specifically, according to our recent study (Hidaka, Reference Hidaka2014), the probabilistic distribution of the number of types K given the number of tokens M with the underlying word frequency distribution of N words, Θ = {p 1, p 2, …, p N} (p i > 0 and  $\sum\limits_{i = 1}^N {p_i} = 1$) is given as follows:
 $$P\left( {K\vert M,\Theta} \right) = \sum\limits_{k = 1}^K {\left( { - 1} \right)^{K - k} \displaystyle{{\left( {2N - K - k} \right)!} \over {\left( {N - k} \right)!\left( {N - K} \right)!}}\sum\limits_{\left\{ {s:\left\vert s \right\vert = k} \right\}} {\,p_s^M}} $$
where  $p_s = \sum\limits_{i \in s} {p_i} $. In particular, the size of the set, N = |Θ| is the latent number of types in the corpus. This probabilistic distribution, P(K|M,Θ), is called the general type–token distribution (Hidaka, Reference Hidaka2014). In this study, we employed an extension of Zipf's distribution, called the second-order Zipf distribution,
 $$p_i \propto \exp \left( { - a_1 \log \left( i \right) - a_2 \log \left( i \right)^2} \right)$$
with the three parameters of the number of words N and the exponent a 1 and a 2, as a normative distribution of word frequency. This extended distribution include the Zipf distribution p i∝i −a1 as a special distribution. The use of the extended distribution will be justified by analyzing the empirical dataset in a later section and in ‘Appendix 3’. By maximizing the likelihood for the theoretical type–token curve (Equation 1) to fit the empirical curve, we can estimate the latent number of types, N = |Θ|. The parameter estimation procedure is given in ‘Appendix 1’.
To test the soundness of the proposed method and its performance relative to alternatives, we performed numerical experiments with datasets generated by Monte Carlo simulations. The results clearly showed an advantage to using the type–token estimator over the three alternatives, including the Good–Turing (Good, Reference Good1953), modified Waring–Herdan (Tuldava, Reference Tuldava1996), and Horvitz–Thomson estimators (Horvitz & Thompson, Reference Horvitz and Thompson1952). See ‘Appendix 2’ for details of the numerical experiments.
In this study, we explore both longitudinal and cross-sectional datasets using an estimation procedure based on the type–token estimator.
Study 1: longitudinal datasets
In order to validate our proposed technique for vocabulary size assessment, we analyzed corpora from a longitudinal study on conversations of three child–caregiver pairs in free-play situations (Brown, Reference Brown1973) as found in the CHILDES database (MacWhinney & Snow, Reference MacWhinney and Snow1990). The corpora include short conversations between child and caregiver (30 to 60 minutes) sampled at monthly intervals from age 2;3 to 5;1. For each corpus, we evaluated the latent number of types for each child and caregiver separately. Since each transcript is only of a short session with a brief conversation where the child is at a particular age, the estimated number of words does not reflect the entire number of words the child knows, but only those related to the particular context. Here, we define the cumulative number of types across all of the transcripts until a particular age as an indicator of the vocabulary growth for each child.
Although our target dataset for each month is relatively small, up to an hour every month, we expect that it can be sufficient to evaluate the relative change of the vocabulary size across time. With a reference point, in which an absolute number of words is estimated reliably, the relative changes may be sufficient to keep track of vocabulary development. Thus, our goal here is not to evaluate the absolute number of types, but to evaluate the estimated latent number of types in order to keep track of relative vocabulary growth. If a measure of vocabulary size captures the relative change of potentially growing corpora, it would be expected to be linearly correlated with the cumulative number of types as the simplest first-order approximation, indicating a more reliable longitudinal measure of vocabulary growth than the naive counting of words in each session. We suppose that a good relative measure of the number of types gives a reliable linear correlation between the estimated number of types at each month of age (small-window measurements) and the cumulative number of types (largest-window measurements). To investigate this, we analyzed them in empirical datasets and compared the counted (naive estimator) and latent (proposed estimator) number of types.
METHOD
Data
The series of 30- or 60-minute-long conversations in child–caregiver pairs were analyzed. The three children in Brown's transcripts were analyzed: Adam (55 sessions from 27·1 to 60·4 months of age, 60 minutes long each), Eve (20 sessions from 18 to 27 months of age, 60 minutes long each), and Sarah (139 sessions from 27·2 to 61·2 months of age, 30 minutes long each).
Estimation of the latent number of types
For each transcript, we used the CLAN program (MacWhinney & Snow, Reference MacWhinney and Snow1990) to extract tagged word stems that identify syntactical variations of the same word. For example, the word stem ‘go’ identifies go, goes, and went. For a transcript with n words, a series of the numbers of types and tokens are inputted to the estimation procedure of the number of latent types (see also ‘Appendix 1’ for this estimation procedure).
RESULTS AND DISCUSSION
In order to evaluate the goodness of the relative vocabulary size estimation at each month of age, we compared the cumulative number of uttered types each progressive month as a function of either the counted number of uttered types or the latent number of uttered types at each month. The counted number of uttered types is simply the naive count of unique words uttered by a child, while the latent number of types is an estimation using the proposed inference procedure. If a measure of vocabulary size captures the relative change of potentially growing corpora, it would be linearly correlated to the cumulative number of types, indicating a more reliable longitudinal measure of vocabulary growth.
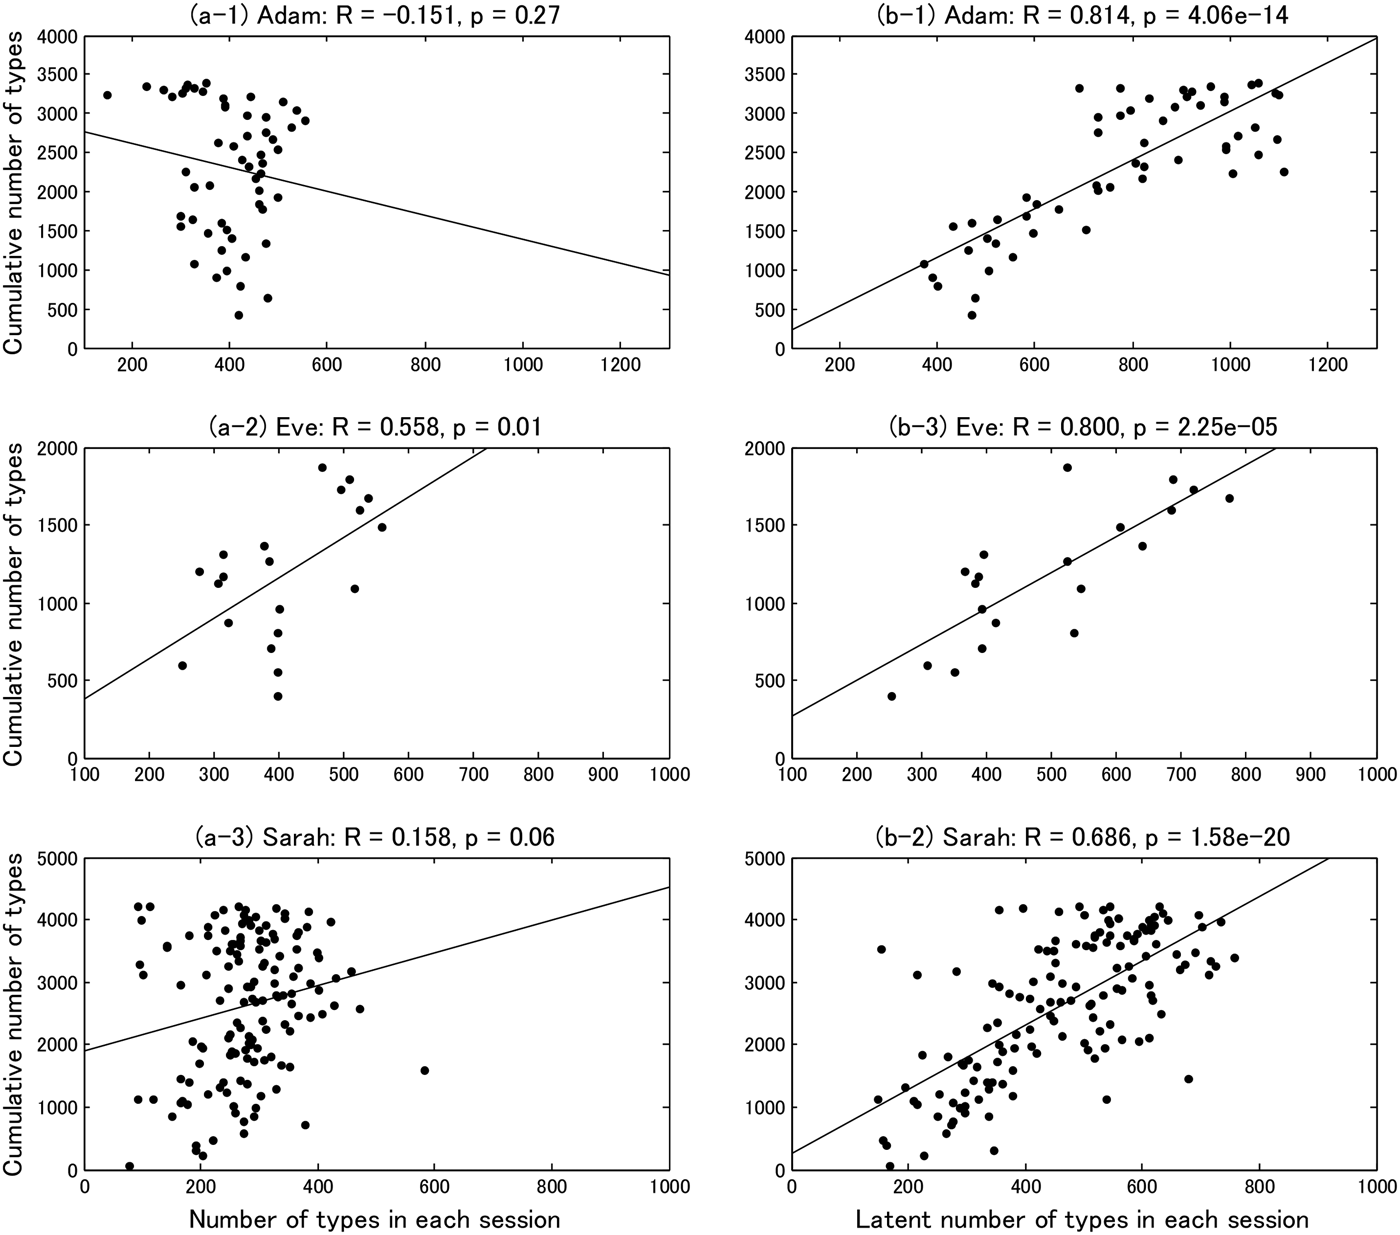
The left-hand panels of Figure 2 (a–1), (a–2), and (a–3) display the cumulative number of types as a function of the counted number of types for each of the three children. As expected, the analysis on the counted number of types (Figure 2 (a–1) and (a–3)) showed little correlation to the cumulative number of types – the cumulative and each-month number of types are not correlated significantly, with p = ·27 and p = ·06, except for Eve (Figure 2 (a–2)) with p = ·01 < ·05. In contrast, the analysis on the estimated latent number of words (Figure 2 (b–1), (b–2), and (b–3)) showed more reliable correlation to the cumulative number of types (p < ·001 for all three cases). The right-hand panels of Figure 2 (b–1), (b–2), and (b–3) show the cumulative number of types as a function of the latent number of words. As apparent from the figures, all three children showed significant correlation between the cumulative and latent number of types (R > ·65 and p < ·01 for all three).
The cumulative number of types as a function of the number of counted types in each session (left column) and as a function of the latent number of types in each session (right column), for the three children.
These results are striking; the estimated latent number of types accurately tracks the relative vocabulary growth even with a small sample size (i.e., up to an hour per month). The accuracy of the estimated latent number of words for each child is significantly better than a naive counting of the uttered types according to the statistical correlation test, which rejected the null hypothesis of equivalence between the correlation coefficients of the latent and sampled number of types for all three cases (p < ·01). This analysis clearly demonstrates that the estimated latent number of types increases with the number of cumulative types. In other words, a child who knows many words tends to produce relatively more types of words in a short conversation. The current estimation procedure captures this as the latent number of words, and thus improves the accuracy of the assessment despite the limitations in the sampling.
Post-hoc validation of the assumptions on the frequency distribution
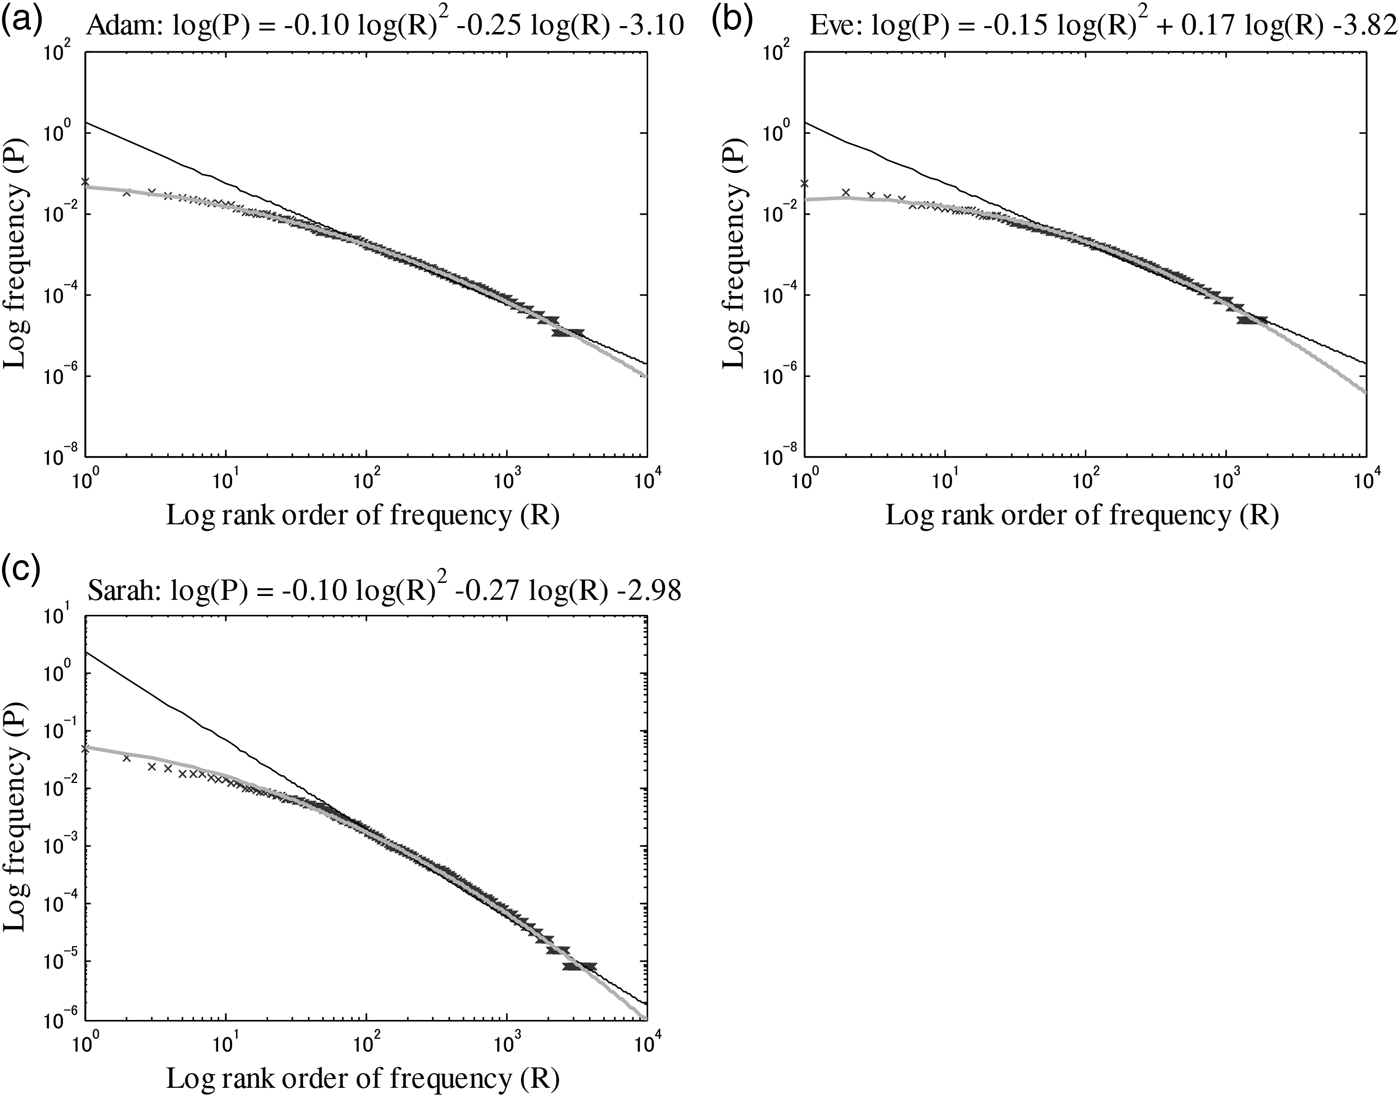
The current process assumes that the word frequency follows the Zipf distribution in which the probability of sampling the i-th most frequent word follows a power function of the rank order. This is often observed and justified in empirical analyses of corpora with a large sample size (Kornai, Reference Kornai2002; Zipf, Reference Zipf1949). However, our target dataset has a small sample size and is from developmental situations, and some recent studies have discussed the dissociation of word frequency in children's speech from Zipf distributions (Pine, Freudenthal, Krajewski, & Gobet, Reference Pine, Freudenthal, Krajewski and Gobet2013). Thus, we empirically analyzed whether the current dataset satisfied the assumptions that the empirical word frequency distributions follow the Zipf distribution and its extension (equation (2)). Figure 3 shows the log word frequency distribution as a function of log rank order of word frequency for all the word tokens collected per child. If the word frequency follows the Zipf distribution rigorously, it follows a straight line on the log–log plot (lines in Figure 3). The empirical word frequencies from the three children show an almost linear pattern; its tail (rarely spoken words) follows the power function (on the line) except for the hundred most frequent words generally being sampled less frequently than the theoretical distribution. A similar mismatch between empirical and Zipf distributions has also been found in Pine et a l. (2013). With consideration to the hundred most frequent words, the extended Zipf distributions (gray curves) showed better fits for all three children.
The word frequency distribution for each child. In each panel, the line shows the best-fitting Zipf distribution, and the curve shows the best-fitting second-order Zipf distribution.
Accordingly, we provide a further empirical test for the Zipf distribution by comparing it with its extension in ‘Appendix 3’. This numerical study demonstrated an advantage of the extended Zipf distribution over the Zipf distribution. Therefore, in this paper, we chose the extended distribution in order to approximate children's word frequency.
Study 2: cross-situational datasets
The previous section described some advantages of estimating the latent number of types in the three longitudinal datasets. Although each of these datasets gives a reliable longitudinal developmental pattern for each child, these findings may not generalize well due to individual variance. A question then remains regarding whether a similar analysis of the latent number of types is beneficial for a wider range of developmental datasets. Therefore, in this study, we analyzed each conversation between child and caregiver in a cross-sectional manner by extracting all datasets with a sufficient number of samples up to age 4;2 in the CHILDES datasets. We treated each of the datasets as an independent sample, and estimated the latent number of types. The estimated latent number of type was then compared with the normative data of vocabulary growth. As a normative measure of vocabulary growth, the English MCDI was used (Fenson et al., Reference Fenson, Dale, Reznick, Thal, Bates, Hartung, Pethick and Reilly1993). The MCDI contains the vocabulary growth for 652 words, each of which is defined by the proportion of children who are reported by their caregiver to have uttered it from age 0;8 to 2;6, combining the norm ‘Words and Gestures' for infants aged 0;8 to 1;4 and ‘Words and Sentences' for those aged 1;4 to 2;6. This normative month-by-month number of words was compared with the latent numbers of words estimated for each sample transcript identified in the CHILDES datasets.
Since the parent-reported vocabulary size in the MCDI may be an underestimate (Houston-Price, Mather, & Sakkalou, Reference Houston-Price, Mather and Sakkalou2007), we also considered another dataset for the number of words. Specifically, we employed a large dataset of ratings on age of acquisition (AoA ratings) as reported by Kuperman, Stadthagen-Gonzalez, and Brysbaert (Reference Kuperman, Stadthagen-Gonzalez and Brysbaert2012). This dataset consists of 30,000 English words, each being rated based on the average and standard deviation of age of acquisition. Using this large AoA norm, we counted the number of words which has a rating on age of acquisitions below a given age, and this number of words as a function of age was compared with the estimated number of words. A total of 402 out of the 30,000 words are rated as acquired on average by age 4;2. Since the AoA ratings have a certain degree of variability, we also considered the one-standard-deviation interval at average AoA ratings. Considering the lower bound of AoA ratings, 3,140 words out of 30,000 are rated acquired by age 4;2.
We performed a statistical test on correlation between the normative vocabulary growth in the MCDI, the number of words estimated based on the AoA ratings, and the number of words estimated from transcripts in CHILDES. Since CHILDES is a collection of many different published studies on language development that were each designed to address specific, separate goals with different experimental situations, there are no straightforward ways to compare or normalize these transcripts. That is, they differ in many factors, including situation, duration of session, experimental tasks, and so on. However, we expect that the overall average pattern as a collection of many experiments reflects the general trend of children's vocabulary development, and that this is comparable with the MCDI and the AoA ratings.
METHOD
We extracted 916 transcripts with the conditions that at least 1,500 word tokens were spoken by a targeted child who is aged 4;2 or younger. These were identified across multiple corpora collected in the CHILDES datasets (retrieved in October 2009). For each extracted transcript, we performed the same estimation procedure to approximate the latent number of types as discussed above.
RESULTS AND DISCUSSION
Figure 4 shows the latent (black dots) and original (gray dots) numbers of types as a function of the age of the child. In this figure, the numbers of words calculated from the MCDI ‘Words and Sentences' are overlaid from ages 1;4 to 2;6, which is the standardized range for productive words in the MCDI. The 50th-percentile line of the MCDI curve (red line; the colored one is available online) shows the number of words out of the 652 words listed in the MCDI that are acquired by more than 50% of children at each month of age. Likewise, the 10th- to 90th-percentile lines of the number of words are calculated (solid and dotted black lines, respectively). The numbers of words calculated from the average AoA ratings and the 60th-percentile confidence intervals (the mean AoA ± one standard deviation) are shown in a blue solid line and blue broken lines, respectively. Most of the numbers of words in CHILDES fall in the interval of the numbers of words estimated from the lower confidence interval (average subtracted by one standard deviation) to those estimated from the average AoA ratings.
(Colour online) The latent (black dots) and counted (gray dots) number of types as a function of the age of children. The normative numbers of words calculated based on the MCDI (10th, 20th, … , 90th percentiles of acquisition rate) are overlaid for the age range from 16 (1;4) to 30 (2;6) months and 0 to 652 words (red line, black solid lines, and black broken lines). The number of words calculated based on the average AoA ratings (blue line) and upper and lower bound of AoA ratings (blue broken lines) are also shown.
First, we analyzed the correlation between the estimated latent number of words and the AoA ratings. For each month of age in 191 CHILDES transcripts, we calculated the number of words estimated from AoA ratings. Then we performed a multiple regression analysis by treating the raw numbers of words in CHILDES and the estimated latent number of words as independent variables, and the number of words by the AoA ratings as a dependent variable. The analysis on the average AoA ratings showed that neither CHILDES nor estimated latent numbers of words have significant predictive power for the number of words calculated by the average AoA ratings (CHILDES: t(188) = –0·330, p = ·74; the estimated latent number of words: t(188) = 1·211, p = ·22). However, another analysis on the lower bound of AoA ratings revealed that the estimated latent words alone have significant predictive power for the number of words calculated by the lower bound of AoA ratings (CHILDES: t(188) = –1·779, p = ·08; the estimated latent number of words: t(188) = 3·109, p = ·002). As the number of words calculated by the average AoA ratings clearly underestimates the number of words (Figure 4), here we view the analysis on the lower bound of AoA ratings to be more reliable. Thus, the result of the multiple regression suggests that the number of words estimated by the proposed method gains significant additional predictive power compared to the number of words calculated by the AoA ratings.
In the CHILDES datasets, forty-nine transcripts were from children aged 2;6 or younger. For most of these forty-nine datasets, both the counted and latent number of words were in the range of the 10th- to 80th-percentiles. We then performed statistical tests regarding the null hypothesis that the number of words in the CHILDES datasets is not correlated to the number of words in the 50th-percentile MCDI curve. The correlation of the latent number of types as estimated for each dataset to the 50th-percentile was 0·459 (p < ·01). Meanwhile, the correlation relating to the counted number of types estimated for each dataset was 0·275 (p = ·06). This suggests that the predicted latent number of types was a better predictor of the normative number of words.
We also performed a more direct statistical test on whether the latent number of types fit with the normative number of words better than the counted number of types. Specifically, for each month-by-month age bin, we assumed that the number of types X followed the binomial distribution P(X | N, p) with N = 652 and p equal to the 50th-percentile number of words divided by 652 words. With the null hypothesis, the log-likelihood of the latent number of types was –73,340·2, while that of the counted number of types was –174,975·1. The test on the likelihood ratio revealed a significantly better fit in relation to the latent number of types (χ 2(1) = 101,634·8, p < ·001), further supporting the improved predictive power of using the theorized latent number of types. These analyses suggest the generality and robustness of the proposed method, such that the latent number of words gives a better indicator of the number of words in the cross-sectional samples collected in various experimental settings.
Finally, we support these findings by eliminating a possible technicality. That is, the latent number of types is, by definition, equal to or larger than the original number of types. Since a one-session transcript almost always underestimates the number of words in each child, any random overestimation is not only a better estimator of the latent number of types, but may also improve the accuracy of estimating the number of types on average. If this is true, the estimated latent number of types may have merely overestimated the number of words to some extent, regardless of the stage of development.
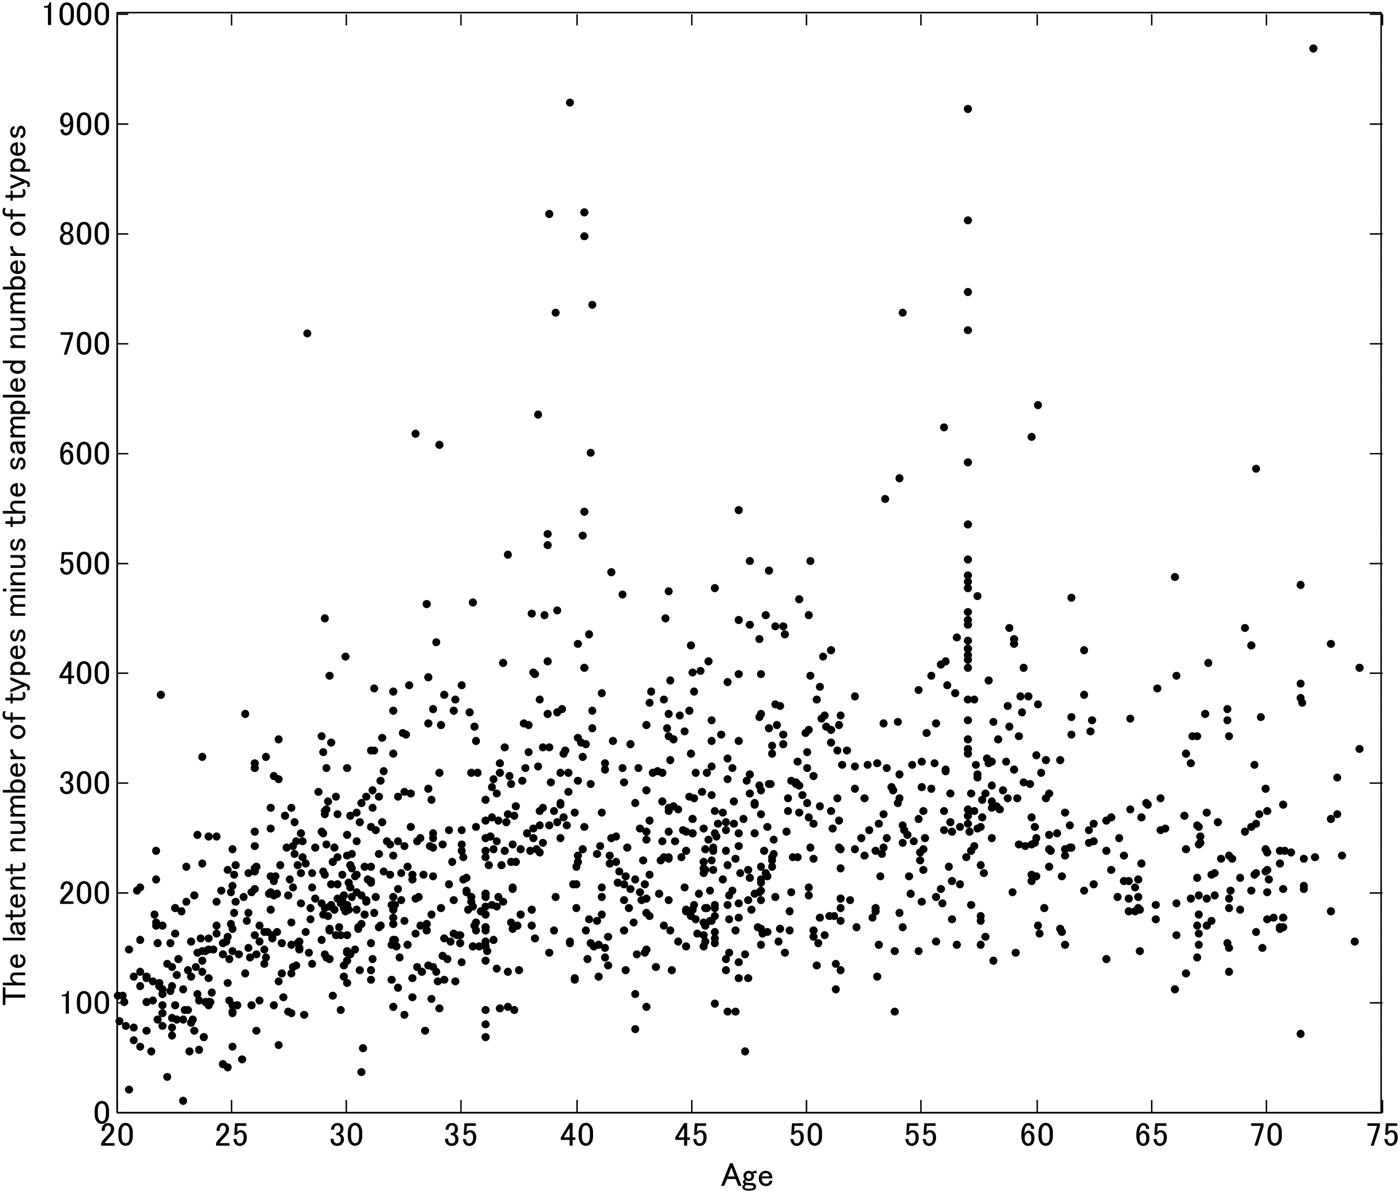
In order to eliminate this random-overestimation possibility, we further analyzed the difference between the latent and counted numbers of words as a function of children's ages (Figure 5). In general, the number of known types increases as function of age, while the number of samples in the data collection was generally constant regardless of the age. Additionally, in theory, the number of counted types calculated from a relatively small number of tokens of data underestimates the true number of types. Therefore, we expected that the number of learned words will have a greater underestimation for older children, as older children tend to know a larger number of types. As expected, for all the transcripts on children aged 4;2 or younger (N = 135), the correlation between the age of children and the margin from the counted to the latent number of words was significantly positive (R = ·521, p < ·001). This result provided supporting evidence for the validity of using the estimated latent number of types with respect to evaluating a child's development. Thus, we reject the possibility that our proposal is a random overestimation.
The difference between the latent and counted numbers of types as a function of age.
GENERAL DISCUSSION
This study discussed the reliable assessment of the vocabulary size of a corpus that itself potentially grows over time. A crucial issue in the analysis of such a corpus is that a limited number of samples, which may be costly to collect, may only be available for a certain period of time, while the corpus keeps growing with new and rarely spoken words. We proposed using the latent number of types as a new measure for the assessment of the size of a developing vocabulary from a small sample size. The latent number of types is a theoretical maximum number of types based on the result of if we were able to experimentally infinitely increase the number of sampled tokens. This measure is statistically inferred from the type–token curve. In empirical data analyses we showed that this measure was a better predictor for the cumulative number of types than the counted number of types in both cross-sectional and longitudinal datasets. These results suggested that estimating the latent number of types robustly enhances the accuracy of an assessment of vocabulary development.
A new combined sampling scheme for vocabulary assessment
With an accurate estimator of the number of types, we have a cheap yet reliable strategy for the assessment of children's vocabulary growth. Current experimental designs for vocabulary size assessment involve accurate but costly natural observations or limited use but cost-efficient questionnaires, and both have a trade-off between cost and accuracy. Therefore, a possible third option, based on the reliable estimator of the latent number of types, was explored to address their issue and improve the statistical power of a limited sample size. This allowed for sparse and cheap data collection that does not require daily or hourly sampling like the observation method, enhanced with a method for inferring a more accurate estimate of the number of words.
If we can accurately evaluate the relative vocabulary growth with a series of datasets that each have a small sample size, a single initial and accurate vocabulary assessment followed by a series of sparse and cheap data collection methods would be sufficient to keep track of the vocabulary development of a child. Specifically, we would need one or a few referential points, such as a relatively large samples (for instance, days of transcripts) in every year with relatively high cost, and subsequently these referential points could be interpolated with more frequent, but less costly data collection, such as an hour-long transcript every month.
Since the proposed estimation procedure can infer relative change over time with a small window of data collection, we can determine children's vocabulary growth with few reference points. This new sampling method minimizes the cost of data collection while maintaining a high accuracy of vocabulary assessment. With this proposed sampling scheme, both longitudinal experimental and cross-sectional designs can be enhanced.
Technical merits and future work
One technical advantage of the proposed method is that it requires no more than the original data, that is, recordings of the conversations between children and caregivers. Thus, there is no additional cost or design required for data collection, and it can be used not only on a newly collected dataset, but also when re-evaluating existing datasets, as in this study. In the present study, we re-evaluated the existing datasets and estimate the latent number of types. In general, there is no risk in using the proposed estimator unless the assumed class of the word frequency distribution is clearly wrong. Throughout this study, we assumed that the word frequency distribution in child speech follows a class of Zipf distribution, and we showed that the empirical word distribution (particularly its tail) follows a class of Zipf distribution.
A potential area for future research is an adaptive optimization of the class of word frequency distribution. In this study, we assumed a class of Zipf distribution for the word frequency distribution and the assumption was tested empirically. Ideally, it would be preferable to adaptively select an appropriate word frequency distribution out of a collection of multiple classes of distributions for each dataset. With this additional word frequency optimization process, the estimation accuracy could be further improved. This may be technically possible by reformulating the procedure as a hierarchical model in which the word frequency distribution is estimated over the distribution of the latent number of types.
Appendix 1: Estimation of the latent number of types through general type–token distribution
In this Appendix, we describe the estimation procedure for the number of latent types. Further technical details are given by Hidaka (Reference Hidaka2014). The probabilistic distribution of the number of types K given a number of tokens M with the underlying word frequency distribution of N words Θ={p 1, p 2, …, p N} (p i > 0 and  $\sum\limits_{i = 1}^N {p_i} = 1$) is given as follows:
 $$P\left( {K \vert M,\Theta} \right) = \sum\limits_{k = 1}^K {\left( { - 1} \right)^{K - k} \displaystyle{{\left( {2N - K - k} \right)!} \over {\left( {N - k} \right)!\left( {N - K} \right)!}}\sum\limits_{\left\{ {s:\left\vert s \right\vert = k} \right\}} {\,p_s^M}}$$
where  $p_s = \sum\limits_{i \in s} {p_i} $. Since the probabilistic distribution P(K|M, Θ) is computationally costly for large M, we used an approximated form:
 $$Q\left( {K\vert M,\Theta} \right) = \sum\limits_{\left\{ {s:\left\vert s \right\vert = K} \right\}} {\prod\limits_{i \in s} {q_{iM}} \prod\limits_{i \in \Theta \backslash s} {\left( {1 - q_{iM}} \right)}} $$
where the Q(K|M,Θ) is the Poisson binomial distribution with parameter q iM=1−(1−p i)M. Hidaka (Reference Hidaka2014) has proved its asymptotic behavior: Q(K|M, Θ)→P(K|M, Θ) as M→∞.
We employ the approximation Q(K|M, Θ) and assume a frequency of N words that follows Zipf's distribution with exponent a, such that p i ∝ i−a (i = 1, 2, …, N). Given n pairs of the number of tokens and types {m i, ni} (i = 1, 2, …, n), the likelihood function of the parameter a > 0 and |Θ| > 0 is defined as 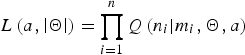 $L\left( {a,\left\vert \Theta \right\vert} \right) = \prod\limits_{i = 1}^n {Q\left( {n_i \vert m_i, \Theta, a} \right)} $ by the Poisson binomial approximation (Equation 2). We obtain the estimators of the exponent a and the number of types |Θ| by maximizing the logarithm of the likelihood, log L(a,|Θ|), as a function of the parameters {a, |Θ|}. The maximization process is computed by the ‘fminsearch’ function for the parameter a in the MATLAB system (MathWorks) with a discrete grid search over |Θ|=1, 2, …, 3000 in which the maximum bound 3000 was set greater than the range of the number of words for the targeted age range used in this study.
Appendix 2: Numerical validation of the estimator based on general type–token distribution
Here, we demonstrate the proposed estimator with simulated datasets in which the latent number of types is known. In this simulation, we assumed that each word is sampled from a Zipf distribution with exponent parameter a > 0 and number of types N > 0. The probability of the i-th most frequent type is p i ∝ −a (i = 1, 2, …, N). Manipulating the exponent a and number of tokens N, we performed a sensitivity analysis regarding small amounts of drawn tokens on the maximum likelihood estimator of the number of types based on the Poisson binomial approximation. The maximum likelihood estimator {a, |Θ|} for each dataset is obtained as described in ‘Appendix 1’.
We performed two simulations in which we estimated the latent number of types from each dataset sampled from a Zipf distribution. In the first simulation, we independently drew 1,000, 1,500, and 2,000 tokens of words from a corpus of N = 1,000 types following the true Zipf distribution with exponent a = 1. In the second simulation, we drew 2,000 tokens of words from a corpus of N = 1,000 types following a Zipf distribution with the exponents a = 0, 0·5, and 1. Clearly, by definition, the true number of types for each dataset was N = 1,000, and this was the variable being estimated. For each combination of parameters, we generated 100 datasets randomly and estimated the number of types.
The type–token estimates of these simulations are shown with (red) circles in Figures A1(a) and A1(b), respectively. Given the number of sampled types, the maximum likelihood inference gave estimators close to the true number of types, that is, N = 1000. Thus, these simulations validate the use of the maximized likelihood estimator based on the general type–token distribution.
In order to evaluate its performance relative to other existing methods, we also applied three existing estimators to our datasets. The first estimator we employed is the Good–Turing estimator (Good, Reference Good1953; Sampson & Gale, Reference Sampson and Gale1995) of the number of types. The Good–Turing estimator is often used to smooth the sample frequency. This estimator considers the ‘frequency of frequency’ or frequency spectrum f k: the number of types that appear exactly k times in a corpus. For example, f 1 is the number of types that appear only once in a given corpus. With this notation, 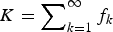 $K = \sum\nolimits_{k = 1}^\infty {f_k} $ is the number of sampled types and
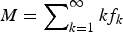 $M = \sum\nolimits_{k = 1}^\infty {kf_k} $ is the number of sampled tokens. The basic concept of the Good–Turing estimator is as follows: we wish to know the number of unseen types f 0. Intuitively, when we sample a word from the pool of sampled words, the probability of sampling a type that appears once is f 1/M. This is the case when one of the types appearing once becomes one of the types appearing twice as a result of sampling these types by the sample estimate of probability f 1/M. Applying the same inference on the case where one of the types appearing zero times becomes one of the types appearing once, the probability f 1/M can be an empirical estimate of the probability for the unseen types. This inference is indeed true under a certain condition (see Good, Reference Good1953, for details). Therefore, with the number of types f k appearing exactly k times in the corpus, the Good–Turing estimator is defined as
 $\hat N_{GT} \equiv f_1 + K$. This estimator incorporates the sample frequency of each type into the inference of the latent number of types. It is easy to see that this estimator converges to the true number of types, when it samples infinitely many tokens from a corpus with a finite number of types: with infinite tokens, f 1 = 0 and K is the true number of types. However, the question is whether this estimator is still reasonable for a relatively small dataset.
The second method to estimate the number of unseen types based on a similar idea as above is the Waring–Herdan's estimator (Tuldava, Reference Tuldava1996), which also incorporates the frequency. It is defined by:
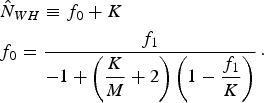 $$\eqalign{& \hat N_{WH} \equiv f_0 + K \cr & f_0 = \displaystyle{{f_1} \over { - 1 + \left( \displaystyle{{K} \over {M}} + 2 \right)\left( 1 - \displaystyle{{f_1} \over {K}} \right)}}}. $$
This estimator is expected to work for corpora of a relatively large size up to M ≈ 200, 000. However, for the small sample size considered in this paper, M < 2, 000, the estimated frequency of unseen types f 0 is often negative, and this estimator does not make sense. Thus, instead of the original estimator, we used a modified estimator:
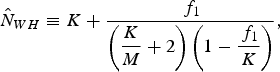 $$\hat N_{WH} \equiv K + \displaystyle{{\,f_1} \over {\left( {\displaystyle{K \over M} + 2} \right)\left( {1 - \displaystyle{{\,f_1} \over K}} \right)}},$$
which always takes a positive value. Both the original and modified estimators converge to the true finite number of types as M→∞.
The third alternative model we employed was the Horvitz–Thomson estimator (Horvitz & Thompson, Reference Horvitz and Thompson1952), which is often used in statistical studies of ecosystems (Chao & Shen, Reference Chao and Shen2003). The Horvitz–Thomson estimator can be used more generally than merely estimating the number of types. Here, we applied it to the indicator of each type (0 or 1) by assuming a sampling without replacement. Specifically, the Horvitz–Thomson estimator of the latent number of types is defined as: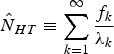 $\hat N_{HT} \equiv \sum\limits_{k = 1}^\infty {\displaystyle{{f_k} \over {\lambda _k}}} $, where λ k = 1−(1−k/M)M is the estimate of inclusion probability of the types that appear exactly k times.
The average numbers of types estimated by  $\hat N_{GT} $,
 $\hat N_{WH} $, and
 $\hat N_{HT} $ are shown as (blue) triangles, (green) squares, and (purple) downward triangles, respectively, in Figures A1(a) and (b). For most of the current datasets, these three estimators were biased toward either smaller or larger numbers of types. In particular, these estimators severely underestimated in the case where the exponent a of the Zipf distribution was as large as 1 (Figure A1(a)). As shown in Figure 3, the empirical datasets of child speech commonly showed a > 1. Since samples from a Zipf distribution with a larger exponent a have more unseen types in general, the three alternative estimators will be of little practical use. The modified Waring–Herdan and Horvitz–Thomson estimators were biased less severely only in the special case of M = 2000 and a = 0.5. However, these estimators were not consistent across different datasets; they over- or underestimated the number of types in the case of M = 2000 and a = 0 or a = 1, respectively. These results suggest that the alternative estimators are biased and unreliable in many cases when the probability of sampling types follows the Zipf distribution.
(Colour online) The estimated number of types for data drawn from the Zipf distribution (a) as a function of the number of tokens (M = 1,000, 1,500, 2,000) and (b) as a function of the exponent (a = 0, 0·5, 1). The averages and standard deviations of the estimators for the hundred randomly generated datasets are shown.
Given the accuracy of the generalized type–token estimator, these results show the advantages of the general type–token estimator over the Good–Turing, modified Waring–Herdan, and Horvitz–Thomson estimators in the majority of datasets considered. More importantly, there appears to be no simple and systematic way to correct these alternative estimators because they can be biased toward both larger and smaller numbers of types depending on unknown parameters of the frequency distribution, such as the exponent a and the number of sampled tokens.
Appendix 3 Are children's word distributions non-Zipfian distributions?
In the post-hoc validation of Study 1 (Figure 3), we found the empirical word frequency in children's corpora may not rigorously follow and show some mismatch from Zipf's law. Here, we formally evaluate whether they follows a Zipf distribution or not. Although there are possibly many alternatives, here we choose a simple extension of Zipf distribution. As Zipf distributions are often stated also as ‘power laws' in which log of frequency is a linear function of log(rank order of words), we consider the second-order polynomial extension of this. Namely our alternative is the second-order Zipf distribution with two parameters a 1, a 2 in which the probability of the i-th most frequent type is p i ∝ exp(−a 1log(i)−a 2log(i)2) (i = 1, 2, …, N). Note that we consider a family of extension, n-th order Zipf distribution, p i ∝ exp(−a 1log(i) −a 2log(i) 2⋯−a nlog(i)n), and we can approximate any distributions with arbitrarily large n. Thus, this extended family of Zipf distribution has children's empirical distributions as its instances. The question we answer here is which order of Zipf distribution fit children's word distribution the best.
Here we simply obtains the maximum likelihood estimator (MLE) of the first- and second-order Zipf distribution, and test which class of distributions explains children's empirical word distribution better. As the first- and second-order Zipf distributions have different number of parameters, we evaluated their AIC (Akaike Information Criterion; Akaike, Reference Akaike1974), which adjusts likelihood by the degree of freedom of the models. If the first-order Zipf distributions are favored over the second-order ones in this test, it supports the use of Zipf distributions assumed in this study.
For each of the three children, Adam, Eve, and Sarah, Brown's corpus used in Study 1 of this paper contains 55, 20, and 139 transcripts. For each and all child utterances in the Brown corpus, we obtained AIC of the first- and second-order Zipf distribution. Out of the 214 individual datasets, we found 198 datasets that show the advantage of the second-order Zipf distributions over the first-order ones. The result suggests an additional advantage of employing the second-order Zipf distribution over the first-order Zipf distribution, concerning children's word distribution.
Accordingly, we further tested the significance of the second-order Zipf distribution in estimation of the latent number of types. Following the same procedure as presented in ‘Appendix 2’, we analyze the effects of different word distributions. Here we employed two distributions: the first-order Zipf distribution with the average parameters estimated from the word frequency of the three children in the Brown corpus (a = 0·924), and the second-order Zipf distribution with the average parameters for the average parameters (a 1 = 0·345, a 2 = 0·066). By assuming the true number of types N = 1,000, we sample 1,000, 1,500, 2,000, and 3,000 tokens from each of these distributions. For each of the four different numbers of tokens, we generated 100 datasets by Monte Carlo simulation. For each dataset, we estimated the latent number of types by the Good–Turing, modified Waring–Herdan, and Horvitz–Thomson estimators, and general type–token estimator with the first- and second-order Zipf distribution. Figure A2 shows the estimated number of types for the first- and second-order Zipf distributions, averaged across four datasets with different number of tokens. The error bars show the standard errors. These results show that the class of word frequency distributions has an impact on the general type–token estimator using the first-order Zipf distribution, but little effect on the estimator using the second-order Zipf distribution. It suggests that the estimator assuming the first-order Zipf distribution may underestimate the latent number of types, if the underlying word distribution is the second-order Zipf distribution. In contrast, the second-order estimator is more robust – it can accurately estimate the latent number of types, even if the underlying word distribution is the first-order Zipf distribution. The other alternatives, Good–Turing, modified Waring–Herdan, and Horvitz–Thomson estimators, tend to underestimate the latent number of types regardless of the class of word frequency distributions. Therefore, we decided to use the general type–token estimator with the second-order Zipf distribution in this paper.
(Colour online) The average estimated number of types for the first- and second-order Zipf distributions.