




No CrossRef data available.
Article contents
MULTIASSET MARKET DYNAMICS
Published online by Cambridge University Press: 01 November 2004
Abstract
This paper explores multiasset market dynamics. We consider a limited number of markets on which two types of agents are active. Fundamentalists specialize in a certain market to gather expertise. Chartists may switch between markets since they use simple extrapolative methods. Specifically, chartists prefer markets that display price trends but that are not too misaligned. The interaction between the traders causes complex dynamics. Even in the absence of random shocks, our artificial markets mimic the behavior of actual asset markets closely. Our model also offers reasons for the high degree of comovements in stock prices observed empirically.
Keywords
Information
- Type
- ARTICLES
- Information
- Copyright
- © 2004 Cambridge University Press
INTRODUCTION
By showing that the act of trading may create excess volatility, the chartist-fundamentalist approach offers a promising alternative to the efficient-market hypothesis. Asset price movements may be amplified by nonlinear trading rules or due to a switching between linear predictors. For example, Day and Huang (1990) derive complex dynamics from nonlinear fundamental trading rules, whereas in the models of Chiarella (1992), Chiarella et al. (2002), and Farmer and Joshi (2002) the agents apply nonlinear technical trading rules. The switching process developed by Kirman (1991) depends on social interactions. In Brock and Hommes (1998), the traders tend to select predictors that have been profitable in the recent past. Lux and Marchesi (2000) combine social interactions and profit considerations.
What is the contribution of this branch of research? On the one hand, these models are remarkably successful in replicating the stylized facts of financial markets. On the other hand, these models have clearly improved our knowledge about what is going on in the markets. A main insight is that asset prices are at least partially driven by an endogenous nonlinear law of motion. In the near future we hope to be able to study the consequences of regulatory means, such as price limits, within computer-based laboratory markets to improve market efficiency [Westerhoff (2003b)].
The above models focus on one risky market only. Our paper suggests a framework in which traders are allowed to switch between a number of different speculative markets. The working of the model is roughly as follows: Fundamentalists are regarded as experts who specialize in one market and thus stay in that market. In contrast, chartists use rather flexible extrapolative methods to forecast prices. Chartists are thus not restricted to a certain market. Note that if the composition between chartists and fundamentalists varies, the stability of the markets may be affected. For instance, if the market impact of chartists exceeds a critical threshold, prices may be driven away from fundamentals.
The aim of this paper is to improve our understanding of multiasset market dynamics. We also explore the extent to which our model is able to mimic the stylized facts of financial markets. As it turns out, our model is able to produces unpredictable prices, lasting bubbles, excess volatility, fat tails for the distribution of the returns, and volatility clustering. Since we focus on more than one risky asset, our approach allows us to study the relationship between different asset prices. For instance, we are able to confirm Shiller's (2000) hypothesis that comovements in stock prices may occur if the agents' perception of the fundamental value of a stock is anchored to the price evolution of other stocks.
The paper is organized as follows: In Section 2, we review the empirical foundations of the chartist-fundamentalist approach. In Section 3, we present the model, its calibration, and a steady-state solution. In Section 4, we explore the dynamic properties of the model, and in Section 5, we discuss some extensions of the model. The last section concludes the paper.
MOTIVATION
Chartist-fundamentalist models are motivated by solid empirical regularities. Let us briefly sketch some of the most crucial findings. Experimental evidence [e.g., Kahneman et al. (1986), Smith (1991), Simon (1997)] reveals that agents are not fully rational. Agents typically lack the cognitive capabilities to derive fully optimal actions. However, this does not imply that they are irrational. Clearly, agents strive to do the right thing. Their behavior may best be described as a rule-governed behavior, meaning that they follow simple rules that have proven to be useful in the past. Since the rules experience a permanent natural selection pressure, the number of applied rules is quite limited.
Three related strands of literature are important for our line of research. Survey studies such as Taylor and Allen (1992) or Lui and Mole (1998) indicate that professional traders strongly rely on technical and fundamental analyses to predict future prices. Technical analysis aims at identifying trading signals out of past price movements. For instance, if prices increase, a buying signal is triggered. Fundamental analysis presumes that prices converge toward fundamental values. For instance, if prices are above fundamental values, selling is suggested. Both the work of Smith (1991) and Sonnemans et al. (in press), who conduct asset pricing experiments in the laboratory, and the work of Ito (1990) and Takagi (1991), who study survey data on expectation formation, point in a similar direction: Agents build adaptive and regressive expectations.
Behind this evidence, let us further elaborate the idea of our model. Remember that fundamental analysis requires intensive research. Fundamentalists thus concentrate on a limited number of markets. For the sake of convenience, we assume that they focus on one market only. Technical analysis applies to all markets. Chartists are therefore much more flexible and may wander between markets. How do they do this? Chartists tend to enter markets that show clear trading signals. Such a mechanism may generate interesting dynamics. For instance, if a market displays a high fitness for the chartists, it attracts an increasing number of chartists. Since chartists typically destabilize the market, a bubble is likely to occur. However, every chartist knows that all bubbles eventually burst. If they react to this risk in the sense that they leave the market, fundamentalists may drive prices to more moderate values. Note that chartists neither evaporate nor convert into fundamentalists (as is the case in other models) but appear again on another market where they continue their positive-feedback trading.
MODEL
Setup
We consider k=1, 2, …K symmetric asset markets of equal size. The evolution of the fundamental prices of the K assets depends on the news arrival process. The log fundamental value of asset k in period t+1 evolves as

News N is constant, equal among markets, and arrives every trading period. We assume that all agents know the fundamental values. However, this assumption is relaxed in Section 5.1.
The prices of the k assets are determined on order-driven markets. The efficiency of the price discovery process depends on the behavior of the agents. Our focus is on three different types of agents: market makers, fundamentalists, and chartists. All orders are initiated against market makers who stand ready to absorb imbalances between buyers and sellers. Depending on the excess demand, market makers adjust prices according to a loglinear price impact function [Farmer (2002)]. Hence, the log asset price in market k in period t+1 is

where aM is a positive price adjustment coefficient; DF,k and DC,k are the orders of fundamentalists and chartists, respectively, in market k; and Wk is the fraction of chartists who are currently active in market k. Note that excess buying drives prices up and excess selling drives them down.
Since all markets are equal in size, a price index is given as

The log price index I is the average of log prices of the k markets.
The traders submit buying (selling) orders if they expect an increase (decrease) in the price. The demand of the speculators is expressed as

and

where aF and aC denote reaction coefficients of fundamentalists and chartists, respectively. Such orders are in harmony with myopic mean-variance maximizers [Hommes (2001)].
Fundamentalists expect the prices of the assets to return to their fundamental values. Such regressive expectations may be expressed as

where bF stands for the expected adjustment speed of the log asset price toward its log fundamental value. Chartists follow simple technical analysis rules:

The degree of extrapolation is given by bC. Similar expectation formation processes are, for instance, used by Kirman (1991).
Whereas fundamentalists stick to their markets, chartists regularly switch between them. According to Murphy (1999), the main principle of technical analysis is to ride on a bubble, but as is well known, eventually every bubble bursts. Clearly, there is a risk connected with such behavior. Chartists therefore try to identify the attractiveness of a market as

The bell-shaped form of the above fitness measure is bounded between −∞ and 0 and entails the risk of being caught in a bursting bubble. For Fk=Sk, the attractiveness of a market reaches its maximum value 0. The larger the distance between Fk and Sk, the lower the fitness of the market. The fitness parameter f is positive.
The relative percentage of chartists choosing market k at time t is given by the discrete-choice model of Manski and McFadden (1981):

The higher the attractiveness of market k, the more chartists will enter that market. The parameter g is called the intensity of choice and measures how sensitive the mass of traders is to selecting the most attractive market. Note that an increase in the intensity of choice may be interpreted as an increase in the rationality of the traders. For g=0, the chartists do not observe any differences in the fitness of the markets. As a result, they are evenly divided into markets. If g goes to infinity, all chartists enter the market with the highest fitness. The use of a discrete-choice model in the context of heterogeneous agents' economies has been popularized by Brock and Hommes (1997).
The solution of the model, obtained by combining (1) to (9), is a high-dimensional nonlinear difference equation system. Since the law of motion of the asset prices precludes closed analysis, we proceed with a numerical analysis.
Calibration
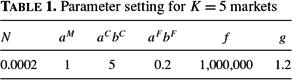
Table 1 displays the parameter setting we use for the simulation analysis. Unfortunately, empirical guidance on how to pick the parameters of chartist-fundamentalist models is limited. Let us briefly attempt to interpret our choice. We consider K=5 asset markets. Since we calibrate the model to daily data, the news level corresponds to a trend growth of 5% per year. The total market impact of chartists is somewhat higher than that of fundamentalists, but note that chartists split into five markets. The fitness parameter f is set such that the price changes resemble those observed in real markets.

Overall, it should be fairly simple to replicate our results. Simulations indicate that we are not dealing with a special case; that is, the dynamic behavior is robust for a broad range of parameters. Surprisingly, bifurcation diagrams do not reveal the usual routes to chaos such as period-doubling bifurcation. Instead, one mainly finds regions with stable, chaotic, or unstable orbits. We skip such technical considerations and concentrate on the economic reasons behind the dynamics.
A Steady-State Solution
Let us begin our analysis by looking at a special case. Suppose we have the following initial values: Fk0=Sk0 and Fk1=Sk1 for all k. Then, the solution of the model is a steady state. Note first that as long as F=S, the demand of the fundamentalists is zero. Ironically, it is the behavior of the chartists that ensures efficiency. Their trading rules pick up the trend growth correctly. Since chartists are divided evenly across the markets, all asset prices increase at the rate of the news level.
As long as the shocks are equal across the markets in period 1, the attractiveness of the markets does not differ. Since Wkt=1/K, our model collapses into a linear model. To make use of the multiasset market framework, the initial values for the asset prices in period 1 are thus set slightly differently.
SIMULATION ANALYSIS
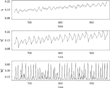
Figure 1 displays the dynamics for 300 observations starting in period 650. The top panel shows the log price index, the second panel shows the log asset price of market k=1, and the third panel shows the fraction of chartists who are active in market k=1. Visual inspection reveals that asset prices fluctuate in an intricate fashion.1
The dynamic behavior we discuss here is independent of the assumed trend growth in the fundamental value. However, since asset markets show an exponential increase in the long run, we have included a drift term. In addition, it is sometimes conjectured that chartist-fundamentalist models have difficulties in mimicking the stylized fact of financial markets in a nonstationary setting. This, at least, is not the case for our model.

Dynamics in the short run. The first panel shows the log priceindex, the second panel shows the log price of market 1, and the third panelshows the fraction of chartists who are active in market 1. The dynamicsare plotted for 300 periods, starting in t=650. Parameters are as in Table 1.
What drives the dynamics? Broadly speaking, chartists tend to destabilize the markets, whereas fundamentalists exercise a stabilizing impact on the dynamics. If there are more fundamentalists than chartists in a market, prices are pushed toward (perceived) fundamentals. Such a development increases the attractiveness of the market for the chartists so that more and more of them enter this market. However, this development also implies that the market share of chartists decreases at least in one other market. Clearly, the one market is destabilized, whereas the stability of the other market increases.
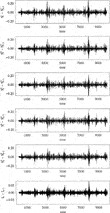
Figure 2 displays the evolution of the returns in the time domain for 10,000 periods. The top five panels show the return time series for the five asset markets, whereas the bottom panel shows the return time series for the index market. Single returns in individual markets may be larger than 20%. Extreme price changes of the aggregated market are around 7%. Since the trend growth of the markets is 5% per year, volatility is quite excessive. Moreover, there is clear evidence of volatility clustering [Mandelbrot (1963)]. Periods of high volatility are also correlated across markets.

Evolution of the returns. The first five panels show the returnsof the five asset markets, and the bottom panel shows the returns of the indexmarket. The dynamics are displayed for 10,000 observations. Parameters areas in Table 1.
Extreme price changes occur as follows. Remember that market makers adjust prices strongly when they have to mediate a high excess demand. This may be the case when a market with a high concentration of chartists displays a strong technical trading signal. The order size may even be higher if fundamentalists trade in the same direction. Note that an extreme price change may indicate the next clear trading signal for the chartists. Therefore, volatility may remain elevated for some time.
However, there is also another origin of a volatility outburst. The bottom part of Figure 1 indicates that chartists switch rather quickly between markets. However, this may not always be the case. If all markets are simultaneously in a bubble process, then chartists have no reason to leave the market. Clearly, chartists may stick to a market that is highly volatile and distorted.2
Compare also Section 5.3.
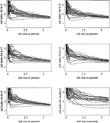
Figure 3 contains estimates of the tail index for the five asset markets and the index market. The tail indices are computed with the Hill tail index estimator [Hill (1975)] using 0% to 6% of the largest observations. The results are shown for 20 simulation runs, each containing 10,000 observations. Actual financial data are characterized by tail indices between 2 and 5 [Farmer (1999), Lux and Ausloos (2002)]. The tail indices of the five artificial markets hover between 2.5 and 3.5 at the 5% level. Most estimates of the aggregated market scatter between 3 and 5. Hence, our results are in harmony with estimates obtained for real financial markets.

Estimation of the tail index. The six panels show the tail indicesfor the five asset markets and the index market for increasing tail sizes (0% to 6% of the largest observations). Every panel contains the estimatesfor 20 simulation runs, each containing 10,000 observations. Parameters areas in Table 1.
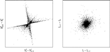
So far, we have demonstrated the model's ability to produces bubbles, excess volatility, fat tails for the distribution of the returns, and volatility clustering. Next, we explore the extent to which the simulated time series are unpredictable. Figure 4 shows the dynamics in phase space. The left panel shows S1t+1−S1t versus S1t−S1t−1, and the right panel shows It+1−It versus It−It−1. Note that in the left panel, some structure—a so-called strange attractor—emerges, although one would expect the returns to be distributed symmetrically around zero. Almost identical patterns appear for the other four markets, but at least the figure in the right panel resembles a scatterplot with almost no visible structure.

Dynamics in phase space. The left panel shows an attractor forlog price changes of market 1 in period t+1 versus log price changesin period t, and the right panel shows the same for the index market. The dynamics are displayed for 10,000 observations. Parameters are as in Table 1.
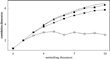
The correlation dimension is a measure to determine the degree of complexity of such objects. Figure 5 shows estimates of the correlation dimension with respect to increasing embedding dimensions. The Chaos Data Analyzer software developed by Sprott and Rowlands (1995) allows us to calculate the correlation dimension for embedding dimensions up to 10. A proper estimate for the correlation dimension is obtained if the estimates converge to some almost constant value. This is the case for the return time series of the five individual markets. For instance, the line with the circles shows the estimates for market 1. Since markets 2–5 appear very similar, one may conclude that the correlation dimension for individual markets is about 3.

Estimations of the correlation dimension. The first line from thetop shows estimates for normally distributed returns, the second line fromthe top shows estimates for daily Dow Jones returns between 1974 and 1998,the third line from the top shows estimates for the returns of the indexmarket, and the bottom line shows estimates for the returns of market 1. Allartificial time series contain 10,000 observations. Parameters are as in Table 1.
A truly stochastic process exhibits increasing estimates of the correlation dimension with increasing embedding dimensions. The top line shows the estimates for normally distributed returns. Clearly, the correlation dimension does not converge to a constant value. The line with the black squares shows estimates for daily Dow Jones returns between 1974 and 1998. Although this line does not converge to some constant value either, it seems that the dynamics are slightly less complex than the random-walk process [see Chen et al. (2001)]. The line with the black circles visualizes the case for the returns of the index market. At least for embedding dimensions up to 10, there is no convergence. The estimates are slightly below the estimates for the Dow Jones data. However, a correlation dimension of above 5.5 indicates highly complex dynamics.
EXTENSIONS
In this section, we present three possible extensions of our simple multiasset market model. First, we relax the assumption that agents know the true fundamental values of the assets. Then, we allow for more complex technical analysis rules. Finally, we investigate the issue of memory in the fitness function. Each extension refers to the basic setting developed in Section 3.
Perception of the Fundamental Values
Most chartist-fundamentalist models are concerned with the price dynamics of a single asset whose fundamental value is constant over time. Moreover, the agents are assumed to know this fundamental value. Such simplifying assumptions are reasonable because they help us to understand complex price dynamics. Since this paper studies multiasset markets, which are characterized by a trend growth, we try to relax this hard assumption.
Experimental evidence suggests that agents may perceive fundamental values according to the anchor and adjustment heuristic. Tversky and Kahneman (1974) report that people make estimates by starting from an initial value that is adjusted to yield the final answer. However, adjustments typically are insufficient, implying biased estimates toward initial values. Here, the perception of the fundamental value is modeled as follows [Westerhoff (2003a)]:

The first three elements of the right-hand side of (10) represent the anchor. The initial value for computing the fundamental value is a weighted average of Pk, Ik, and Sk. The weights c1, c2, and c3 are positive and add up to 1. The motivation for the formulation of the anchor is that many traders believe that asset prices themselves reflect relevant information.
The adjustment of the anchor takes place in two steps: First, traders naturally react to the arrival of new information. However, since the exact meaning of news is unknown, the agents tend to misperceive news. For instance, if the recent update of the perceived fundamental value has been above the news impact (Pkt−1−Pkt−2>N), traders become optimistic and overreact to news. The degree of misperception is given by d. The second adjustment process covers the learning or research behavior of the agents. Psychologists argue that such error correction learning is typically slow over time and small in magnitude. Hence, e is positive but relatively small.
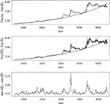
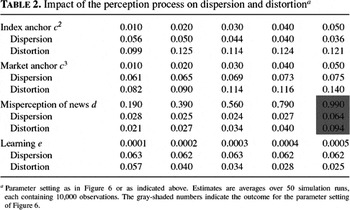
For the following simulation, we assume that the price index enters the anchor with 0.5% and the asset price with 1.5%. The misperception of news coefficient is close to 1 (d=0.99). The adjustment due to learning is rather small (e=0.00005). The other parameters of the model are as in Section 3. Figure 6 presents the dynamics for the first 10,000 observations. The top panel shows the price index and the central panel the price of market k=1. The smooth lines in the top two panels indicate the evolution of the fundamental value. Obviously, the model is able to generate bubbles. Prices may deviate strongly and persistently from fundamental values. Note that the bubbles displayed in Figure 6 deflate slowly. A similar bubble pattern emerged in Japan in the 1990's.

Dynamics in the long run. The first panel shows the priceindex and its fundamental value (the smooth line), the second panel showsthe price of market 1 and its fundamental value (the smooth line), and thebottom panel shows the deviation between the log of the largest price andthe log of the smallest price of the five markets. The dynamics are displayedfor 10,000 observations. We set c1=0.98, c2=0.005, c3=0.015, d=0.99, e=0.00005. The other parameters areas in Table 1.
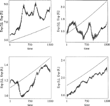
Figure 7 reveals that the model has the potential to produce quite different boom and bust patterns. The four panels show price sequences of the index market for 1,500 periods. The smooth line represents again the development of the fundamental value. The top left panel displays a typical bubble and crash scenario. After a sharp price increase, the market collapses quickly again, but even after the crash, the market remains overvalued. The top right panel illustrates a similar price pattern. The difference is that the market now crashes below its fundamental value. The bottom left panel demonstrates that a market may even crash out of the blue. The price is close to its fundamental value, and suddenly the price declines quickly, but the dynamics are not always that turbulent. In the bottom right panel, the price fluctuates parallel to its fundamental value. Surprisingly, an undervaluation of about 20% lasts for more than 1,500 time steps. Since the model is calibrated to daily data, this corresponds to a time span of around 6 years. However, further simulations reveal that prices are 53% of the time above fundamental values (average value over 50 simulation runs, each containing 10,000 observations). The reason is that because of the trend growth, technical analysis generates more overshooting than undershooting.

Bubbles and crashes. All four panels show the price index and itsfundamental value (the smooth line). Sequences of 1,500 observations aredisplayed. Parameters are as in Figure 6.
The bottom panel of Figure 6 displays the distance between the highest and the lowest price of the five markets. Sometimes, the markets move closely together. However, differences between the prices may become as large as 40%. Shiller (1989) reports that stock prices move strongly together. More precisely, comovements in stock prices are much larger than comovements in fundamentals. For example, after the stock market crash in 1987, the levels of stock prices in all major stock markets around the world made similarly spectacular drops. Shiller (2000) argues that for individual stocks, price changes tend to be anchored to price changes of other stocks via the expectation formation and perception process.
Our model allows the investigation of this hypothesis. Table 2 shows how dispersion and distortion are influenced by the perception of fundamental values. Dispersion is defined as the average distance between the highest and the lowest price of the K markets:

Distortion is computed as the average absolute distance between the price index and the fundamental value:

All estimates are averages over 50 simulation runs, each containing T=10, 000 observations. The gray-shaded numbers indicate the outcome for the parameter setting of Figure 6. On average, we observe a dispersion of 6.4% and a distortion of 9.4%.

If the traders rely more strongly on the price index as an anchor, then the distortion increases but the dispersion decreases. On the one hand, mistakes in the pricing of the assets are transferred into a misperception of the fundamentals. Therefore, bubbles become more pronounced. On the other hand, by using the price index more strongly as an anchor, the agents perceive rather similar fundamental values across markets. Since perceived fundamentals attract prices, comovements in prices increase. Hence, our analysis supports Shiller's hypothesis.
The picture for the market price as an anchor appears differently. The higher the c3, the higher the dispersion and distortion. For instance, for c3=0.05, dispersion is 7.5% and distortion is 14%. Again, a mispricing of the assets is transformed into a misperception of fundamental values, but now the individual markets show a life of their own. If the misperception of news coefficient approaches 0.99, distortion and dispersion increase sharply. For d>0.99, the dynamics are likely to explode. Learning decreases the level of mispricing but surprisingly has almost no impact on the degree of the comovements of stock prices.
Technical Analysis
To obtain a first understanding of nonlinear dynamic systems, it is typical to start with a deterministic setup [e.g., Day and Huang (1990), Chiarella (1992), Brock and Hommes (1997, 1998)]. For example, one may then be able to relate some of the stylized facts directly to certain features of the model. So far, we have seen that the dynamics are quite complex, yet one still finds too much structure in the time series, which is a usual problem of chaotic models. In particular, actual asset prices do not fluctuate in a sawtooth behavior, as visible in Figure 1. This section thus aims at improving the model's time-series performance, preferably without losing the other stylized facts such as persistent volatility. The usual way to overcome this matter is to add some kind of stochasticity to the model. Given the fact that real asset price motion is polluted by noise, such a procedure seems to be reasonable.
Next, we alter the technical analysis rule. Remember that the trading behavior of chartists has been approximated by a very simple positive feedback rule. In reality, however, there exists an ocean of different technical trading strategies [see Murphy (1999) for an extensive collection of chart rules]. Besides trend-following trading rules, there exist also many popular trend reversal rules (e.g., oscillators such as the double-crossover method or the head-and-shoulders pattern). Although chartists seem to be positive-feedback traders most of the time, it is important to recognize that negative-feedback trading also takes place. For instance, Manzan and Westerhoff (2002) find statistical evidence for a regime-switching behavior of chartists in foreign exchange markets. To be precise, chartists turn from positive-to negative-feedback trading when the most recent absolute price change has exceeded a certain threshold.
To preserve the structure of the model, we opt for a simple stochastic regime-switching process to characterize the orders of the chartists. Let us substitute (5) and (7) with

According to (13), chartists bet on a trend continuation (reversal) with probability p(1−p). There exist several ways to endogenize such a stochastic process. For instance, in Lux and Marchesi (2000), chartists switch between an optimistic and a pessimistic mood.
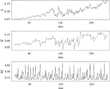
Figure 8 illustrates the dynamics of the revised model. The first panel shows the log price index, the second panel shows the log price of market 1, and the third panel shows the fraction of chartists who are active in market 1. The simulation run is generated with p=0.6; that is, chartists display bandwagon behavior most of the time. The other parameters are as in Figure 1.3
Further simulations demonstrate that already weak trend-reversal behavior destroys most of the structure in the time series (e.g., p=0.9). However, a better fit is obtained for p=0.6.

Trend-following and trend-reversal technical analysis rules. Thefirst panel shows the log price index, the second panel shows the log priceof market 1, and the third panel shows the fraction of chartists who areactive in market 1. The propability of trend-following behavior is p=0.6. The other parameters are as in Table 1, T=300 observations.
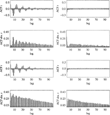
Figure 9 investigates whether the dynamics are indeed unpredictable. The first, second, third, and fourth row of panels show autocorrelation functions for raw returns of market k=1, absolute returns of market k=1, raw returns of the aggregated market, and absolute returns of the aggregated market, respectively. The left-hand panels display the estimates for the deterministic setting of Section 4. We find typical autocorrelation functions for absolute returns, but the autocorrelation for raw returns is much too high. In fact, financial data display only weak autocorrelation in raw returns [Campbell et al. (1997), Mantegna and Stanley (2000)]. The right-hand panels present the estimates for the setting with more complex technical analysis rules. Although the impact on the autocorrelation of absolute returns is modest, the mean reversion tendency is much lower. It is interesting to see that the incorporation of a regime-switching behavior of the chartists dissolves the predictability of the asset prices without affecting the other stylized facts.

Unpredictability and volatility clustering. The first, second,third, and fourth row of panels show autocorrelation functions for rawreturns of market k=1, absolute returns of market k=1, rawreturns of the aggregated market, and absolute returns of the aggregatedmarket, respectively. The left-hand (right-hand) panels are for the basic(extended) model. Parameters are as in Figures 1 or 8, T=10, 000observations. Confidence intervals of 95% are plotted as ±2/√T (assumption of white noise).
Memory
This section explores the issue of memory, an aspect that has recently gained some attention. In LeBaron (2001a,b), investors view different lengths of past information as being relevant to their investment-decisionmaking process. LeBaron finds that short-horizon agents may act as volatility generators, whereas long-horizon agents tend to stabilize the dynamics. Since agents with short-term perspective create their own evolutionary space where they are able to thrive, the impact of long-term traders remains limited. Thus, financial markets may be excessively volatile. Hommes (2001) finds opposite evidence; that is, increasing memory may yield larger price fluctuations. Suppose that agents switch between technical and fundamental analysis depending on the rules past realized profits. When memory in fitness is large, differences in accumulated profits can become sufficiently large to cause the majority of traders to switch to destabilizing trading rules.
How does memory affect the dynamics in our multiasset market model? To answer this question, let us rewrite the fitness function (8) as

where 0≤h≤1 is a memory parameter describing how fast past fitness values are discounted. For h=0 (no memory), the fitness depends only on the market's attractiveness in period t. For h=1 (perfect memory), the fitness equals the accumulated fitness values over the entire past.
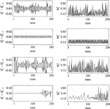
Figure 10 illustrates the effect of memory. The left-hand panels present log price changes and the right-hand panels display the fraction of chartists active in market 1. In the first, second, third, and fourth line of panels, we assume h=0, h=0.35, h=0.65, and h=1. The other parameters are as in Table 1. In the top panels (h=0), we see again the dynamics of the basic model, as discussed in Section 4. Prices fluctuate strongly and the speed of market change is high. For h=0.35, a period-6 cycle emerges. Asset prices fluctuate less strongly and the fraction of chartists is limited between 5% and 33%.4
Note that two of the other five markets show the same cyclical solution as this market while the other markets show different cyclical solutions.

Effect of memory. The left-hand panels show log price changesand the right-hand panels show the fraction of chartists active in market 1.In the first, second, third, and fourth row of panels, we set h=0, h=0.35, h=0.65, and h=1. The other parameters are as in Table 1, T=200 observations.
CONCLUSIONS
Chartist-fundamentalist models have proven to be quite successful in explaining the stylized facts of financial markets. Contributions such as Day and Huang (1990), Kirman (1991), Chiarella (1992), Brock and Hommes (1998), Lux and Marchesi (2000), Chiaretta et al. (2002), and Farmer and Joshi (2002) focus on one risky market. This paper develops a framework in which traders are allowed to switch between markets. Since fundamental analysis requires intensive observation of the market, fundamentalists concentrate on one market only. The use of extrapolative methods allows chartists to switch between markets. Chartists enter those markets that show price trends but that are not too misaligned. The interaction between the traders causes complex dynamics. Prices are highly unpredictable and excessively volatile and may deviate from fundamentals. In addition, the prices of the assets move closely together. The reason is that if agents anchor their perception of fundamental values to the evolution of the price index, they perceive rather similar fundamental values across markets. Our model also produces fat tails for the distribution of the returns and volatility clustering.
This paper was presented at the 9th International Conference of the Society for Computational Economics, July 2003, Seattle, Washington; at the CeNDEF seminar, April 2003, Amsterdam; at the CERGE-EI seminar, March 2003, Prague; and at the Erich Schneider seminar, October 2002, Kiel. I thank the participants, especially Cees Diks, Tony He, Cars Hommes, and Thomas Lux, for stimulating discussions. I also thank an anonymous referee and an associate editor for very helpful comments. A generous travel grant from the Universitätsgesellschaft Osnabrück is gratefully acknowledged.
References
Brock W. &
C. Hommes
1997
A rational route to randomness.
Econometrica
65,
1059–
1095.Google Scholar
Brock W. &
C. Hommes
1998
Heterogeneous beliefs and routes to chaos in a simple asset pricing model.
Journal of Economic Dynamics and Control
22,
1235–
1274.Google Scholar
Campbell J.,
A. Lo &
C. MacKinlay
1997
The Econometrics of Financial Markets.
Princeton:
Princeton University Press.
Chen S.-H.,
T. Lux &
M. Marchesi
2001
Testing for nonlinear structure in an artificial financial market.
Journal of Economic Behavior and Organization
46,
327–
342.Google Scholar
Chiarella C.
1992
The dynamics of speculative behavior.
Annals of Operations Research
37,
101–
123.Google Scholar
Chiarella C.,
R. Dieci &
L. Gardini
2002
Speculative behaviour and complex asset price dynamics: A global analysis.
Journal of Economic Behavior and Organization
49,
173–
197.Google Scholar
Day R. &
W. Huang
1990
Bulls, bears and market sheep.
Journal of Economic Behavior and Organization
14,
299–
329.Google Scholar
Farmer D.
1999
Physicists attempt to scale the ivory towers of finance.
Computing in Science and Engineering
1,
26–
39.Google Scholar
Farmer D.
2002
Market force, ecology, and evolution.
Industrial and Corporate Change
11,
895–
953.Google Scholar
Farmer D. &
S. Joshi
2002
The price dynamics of common trading strategies.
Journal of Economic Behavior and Organization
49,
149–
171.Google Scholar
Hill B.
1975
A simple general approach to inference about the tail of a distribution.
Annals of Statistics
3,
1163–
1173.Google Scholar
Hommes C.
2001
Financial markets as nonlinear adaptive evolutionary systems.
Quantitative Finance
1,
149–
167.Google Scholar
Ito T.
1990
Foreign exchange rate expectations: Micro survey data.
American Economic Review
80,
434–
449.Google Scholar
Kahneman D.,
P. Slovic &
A. Tversky
1986
Judgment Under Uncertainty: Heuristics and Biases.
Cambridge, UK:
Cambridge University Press.
Kirman A.
1991
Epidemics of opinion and speculative bubbles in financial markets.
In Mark Taylor (ed.),
Money and Financial Markets,
pp. 354–
368.
Oxford:
Blackwell.
LeBaron Blake
2001a
Empirical regularities from interacting long- and short-memory investors in an agent based stock market.
IEEE Transactions on Evolutionary Computation
5,
442–
455.Google Scholar
LeBaron B.
2001b
Evolution and time horizons in an agent-based stock market.
Macroeconomic Dynamics
5,
225–
254.Google Scholar
Lui Y.-H. &
D. Mole
1998
The use of fundamental and technical analysis by foreign exchange dealers: Hong Kong evidence.
Journal of International Money and Finance
17,
535–
545.Google Scholar
Lux T. &
M. Ausloos
2002
Market fluctuations I: Scaling, multi-scaling and their possible origins.
In A. Bunde,
J. Kropp &
H.J. Schellnhuber (eds.),
Theories of Disaster: Scaling Laws Governing Weather, Body and Stock Market Dynamics,
pp. 373–
410.
Berlin:
Springer.
Lux T. &
M. Marchesi
2000
Volatility clustering in financial markets: A micro-simulation of interacting agents.
International Journal of Theoretical and Applied Finance
3,
675–
702.Google Scholar
Mandelbrot B.
1963
The variation of certain speculative prices.
Journal of Business
36,
394–
419.Google Scholar
Manski C. &
D. McFadden
1981
Structural Analysis of Discrete Data with Econometric Applications.
Cambridge, MA:
MIT Press.
Mantegna R. &
E. Stanley
2000
An Introduction to Econphysics.
Cambridge, UK:
Cambridge University Press.
Manzan S. &
F. Westerhoff
2002
Heterogeneous Expectations, Exchange Rate Dynamics and Predictability.
CeNDEF working paper series WP-02–14.
Murphy J.
1999
Technical Analysis of Financial Markets.
New York:
New York Institute of Finance.
Shiller R.
1989
Comovements in stock prices and comovements in dividends.
Journal of Finance
44,
719–
729.Google Scholar
Shiller R.
2000
Irrational Exuberance.
Princeton:
Princeton University Press.
Simon H.
1997
An Empirically Based Microeconomics.
Cambridge, UK:
Cambridge University Press.
Smith V.
1991
Papers in Experimental Economics.
Cambridge, UK:
Cambridge University Press.
Sonnemans J.,
C. Hommes,
J. Tuinstra, &
H. van de Velden (in press)
The instability of a heterogeneous cobweb economy: A strategy experiment on expectation formation.
Journal of Economic Behavior and Organization.
Sprott J. &
G. Rowlands
1995
Chaos Data Analyzer: The Professional Version 2.1.
New York:
American Institute of Physics.
Takagi S.
1991
Exchange rate expectations: A survey of survey studies.
IMF Staff Papers
38,
156–
183.Google Scholar
Taylor M. &
H. Allen
1992
The use of technical analysis in the foreign exchange market.
Journal of International Money and Finance
11,
304–
314.Google Scholar
Tversky A. &
D. Kahneman
1974
Judgment under uncertainty: Heuristics and biases.
Science
185,
1124–
1131.Google Scholar
Westerhoff F.
2003a
Expectations driven distortions in the foreign exchange market.
Journal of Economic Behavior and Organization
51,
389–
412.Google Scholar
Westerhoff F.
2003b
Speculative markets and the effectiveness of price limits.
Journal of Economic Dynamics and Control
28,
493–
508.Google Scholar
Parameter setting for K=5 markets
Dynamics in the short run. The first panel shows the log priceindex, the second panel shows the log price of market 1, and the third panelshows the fraction of chartists who are active in market 1. The dynamicsare plotted for 300 periods, starting in t=650. Parameters are as in Table 1.
Evolution of the returns. The first five panels show the returnsof the five asset markets, and the bottom panel shows the returns of the indexmarket. The dynamics are displayed for 10,000 observations. Parameters areas in Table 1.
Estimation of the tail index. The six panels show the tail indicesfor the five asset markets and the index market for increasing tail sizes (0% to 6% of the largest observations). Every panel contains the estimatesfor 20 simulation runs, each containing 10,000 observations. Parameters areas in Table 1.
Dynamics in phase space. The left panel shows an attractor forlog price changes of market 1 in period t+1 versus log price changesin period t, and the right panel shows the same for the index market. The dynamics are displayed for 10,000 observations. Parameters are as in Table 1.
Estimations of the correlation dimension. The first line from thetop shows estimates for normally distributed returns, the second line fromthe top shows estimates for daily Dow Jones returns between 1974 and 1998,the third line from the top shows estimates for the returns of the indexmarket, and the bottom line shows estimates for the returns of market 1. Allartificial time series contain 10,000 observations. Parameters are as in Table 1.
Dynamics in the long run. The first panel shows the priceindex and its fundamental value (the smooth line), the second panel showsthe price of market 1 and its fundamental value (the smooth line), and thebottom panel shows the deviation between the log of the largest price andthe log of the smallest price of the five markets. The dynamics are displayedfor 10,000 observations. We set c1=0.98, c2=0.005, c3=0.015, d=0.99, e=0.00005. The other parameters areas in Table 1.
Bubbles and crashes. All four panels show the price index and itsfundamental value (the smooth line). Sequences of 1,500 observations aredisplayed. Parameters are as in Figure 6.
Impact of the perception process on dispersion and distortiona
Trend-following and trend-reversal technical analysis rules. Thefirst panel shows the log price index, the second panel shows the log priceof market 1, and the third panel shows the fraction of chartists who areactive in market 1. The propability of trend-following behavior is p=0.6. The other parameters are as in Table 1, T=300 observations.
Unpredictability and volatility clustering. The first, second,third, and fourth row of panels show autocorrelation functions for rawreturns of market k=1, absolute returns of market k=1, rawreturns of the aggregated market, and absolute returns of the aggregatedmarket, respectively. The left-hand (right-hand) panels are for the basic(extended) model. Parameters are as in Figures 1 or 8, T=10, 000observations. Confidence intervals of 95% are plotted as ±2/√T (assumption of white noise).
Effect of memory. The left-hand panels show log price changesand the right-hand panels show the fraction of chartists active in market 1.In the first, second, third, and fourth row of panels, we set h=0, h=0.35, h=0.65, and h=1. The other parameters are as in Table 1, T=200 observations.
 You have
Access
- 94
- Cited by