Introduction
For a subset of older adults, cognitive abilities decline more than normal, which may be the first indication of a pathological condition. There have been many terms for such decline [e.g., age-related cognitive decline, age-associated memory impairment (American Psychiatric Association, 1994), and cognitive impairment no dementia (CIND; Ebly, Hogan, & Parhad, Reference Ebly, Hogan and Parhad1995; Graham, Rockwood, & Beattie, Reference Graham, Rockwood and Beattie1997)], but the most widely recognized diagnostic category is mild cognitive impairment (MCI; Petersen et al., Reference Petersen, Smith, Waring, Ivnik, Tangalos and Kokmen1999). While early research focused on amnestic MCI (Petersen, Reference Petersen1995), where memory is the only domain of cognitive impairment, a broadened conception has been advocated (Petersen, Reference Petersen2004) and includes classifications for single- and multiple-domain non-memory impairments, under an assumption that different neurodegenerative disorders may present with different patterns of cognitive symptoms.
Petersen's criteria (2004) include a requirement for unimpaired daily functioning, subjective cognitive complaint, and an exclusion of dementia. These criteria are somewhat flexible, as they do not specify which instruments should be used to examine each of these criteria. Additionally, performance cutoffs vary by study, often ranging from 1–2 standard deviations below the mean (Jak, Bondi, et al., Reference Jak, Bondi, Delano-Wood, Wierenga, Corey-Bloom, Salmon and Delis2009). Because of this flexibility, the classification of MCI across studies has varied widely (e.g., Busse, Bischkopf, Riedel-Heller, & Angermeyer, Reference Busse, Bischkopf, Riedel-Heller and Angermeyer2003; Caracciolo, Gatz, Xu, Pedersen, & Fratiglioni, Reference Caracciolo, Gatz, Xu, Pedersen and Fratiglioni2012; Tuokko & McDowell, Reference Tuokko and McDowell2006). Jak, Bondi, and colleagues (2009) demonstrated that varying classification criteria yielded results of 10–74% of their sample being characterized as having MCI. The International Working Group's (Winblad et al., Reference Winblad, Palmer, Kivipelto, Jelic, Fratiglioni, Wahlund and Petersen2004) recommendations for MCI criteria closely resembled Petersen's (2004), with the exception of not requiring a subjective cognitive complaint in lieu of concerns voiced by a collateral. The subjective complaint component is somewhat controversial and was not included in the current study, in part because of concerns about low validity of complaints (Cook & Marsiske, Reference Cook and Marsiske2006), limited utility due to confounding factors like overlying depression and impaired awareness (Crowe et al., Reference Crowe, Andel, Wadley, Cook, Unverzagt, Marsiske and Ball2006; DeJager, Blackwell, Budge, & Sahakian, Reference DeJager, Blackwell, Budge and Sahakian2005; Jorm et al., Reference Jorm, Christensen, Korten, Henderson, Jacomb and Mackinnon1997), and the existence of several studies that have shown that cognitive complaints are poor predictors of progression (Blazer, Hays, Fillenbaum, & Gold, Reference Blazer, Hays, Fillenbaum and Gold1997; Busse et al., Reference Busse, Bischkopf, Riedel-Heller and Angermeyer2003; Fisk, Merry, & Rockwood, Reference Fisk, Merry and Rockwood2003; Jorm et al., Reference Jorm, Christensen, Korten, Henderson, Jacomb and Mackinnon1997; Palmer, Backman, Winblad, & Fratiglioni, Reference Palmer, Backman, Winblad and Fratiglioni2003).
In addition to concerns about subjective complaints, there have also been questions raised about the inclusion of unimpaired daily functioning. There has not been consensus on which functions to measure (Panza et al., Reference Panza, D'Introno, Colaciccio, Capurso, Del Parigi, Caselli and Solfrizzi2005). Marsiske and Margrett (Reference Marsiske and Margrett2006), for example, reviewed a large number of studies finding that cognitive measures of everyday functioning—particularly those emphasizing Instrumental Activities of Daily Living (IADLs; e.g., finances, managing medication regimens)—do in fact discriminate persons with MCI from normal older adults. It is important, however, to distinguish between physical and cognitive sources of functional impairment, since the later is more likely to be dementia-related. Previous work from the ACTIVE study suggested that being classified in any MCI subgroup (amnestic, non-amnestic, multi-domain) predicted greater 3-year decline in both Activities of Daily Living (ADL) and IADL perceived difficulty and performance (Wadley et al., Reference Wadley, Crowe, Marsiske, Cook, Unverzagt, Rosenberg and Rexroth2007). While there was very little variability in baseline ADL/IADL of ACTIVE participants due to the inclusion criteria described below, measuring changes over time may serve as an important variable in determining what factors may be predictive of poor outcomes in MCI.
Many MCI investigations to date have been clinical studies, where participants are self-selected and most often already have cognitive complaints (Feldman & Jacova, Reference Feldman and Jacova2005; Panza et al., Reference Panza, D'Introno, Colaciccio, Capurso, Del Parigi, Caselli and Solfrizzi2005). Extending the MCI concept to community-based population studies can be challenging due to the feasibility and cost associated with a full clinical and neuropsychological assessment to determine MCI status. While several prospective studies have used consensus classification of MCI (e.g., Busse et al., Reference Busse, Bischkopf, Riedel-Heller and Angermeyer2003; Fisk et al., Reference Fisk, Merry and Rockwood2003; Jorm et al., Reference Jorm, Christensen, Korten, Henderson, Jacomb and Mackinnon1997; Manly et al., Reference Manly, Bell-McGinty, Tang, Schupf, Stern and Mayeux2005, Reference Manly, Tang, Schupf, Stern, Vonsattel and Mayeux2008; Unverzagt et al., Reference Unverzagt, Gao, Baiyewu, Ogunniyi, Gureje, Perkins and Hendrie2001, Reference Unverzagt, Ogunniyi, Taler, Gao, Lane, Baiyewu and Hall2011), the use of a novel algorithmic (test-based) classification approach has also been examined. For example, Ganguli et al. (Reference Ganguli, Chang, Snitz, Saxton, Vanderbilt and Lee2010) used an algorithmic approach to determine the prevalence of MCI using different classification criteria. When classification was based solely on cognitive performance, using a cutoff of 1 standard deviation below the sample mean, 35% of their sample was classified with MCI. Ritchie, Artero, and Touchon (Reference Ritchie, Artero and Touchon2001) retrospectively identified amnestic MCI in a French population-based study that included a computerized neuropsychological battery, as well as subjective complaint and daily function measures.
The goal of this study, consistent with the work of Ganguli, Dodge Shen, and DeKosky (Reference Ganguli, Dodge, Shen and DeKosky2004), Ganguli et al. (Reference Ganguli, Chang, Snitz, Saxton, Vanderbilt and Lee2010), and Ritchie et al. (Reference Ritchie, Artero and Touchon2001), was to study the 5-year outcome of retrospectively identified cognitively low functioning, at-risk participants of the ACTIVE (Advanced Cognitive Training of Independent and Vital Elders) study over the first 5 years of follow-up. The ACTIVE study offers a large, multi-site, well-characterized, and long-studied (soon to be 10 years) cohort, thus offering a unique opportunity to examine cognitive aging outcomes that many other studies may not be equipped to examine. However, a limitation, as discussed in more detail below, is that the study did not use standard clinical measures and procedures to classify participants. While cognitive domains were created to be roughly analogous to those used by Jak, Bondi, et al. (Reference Jak, Bangen, Wierenga, Delano-Wood, Corey-Bloom and Bondi2009), the measures do not perfectly correspond.
While not conforming to the exact clinical MCI criteria (e.g., Petersen et al., Reference Petersen, Smith, Waring, Ivnik, Tangalos and Kokmen1999), multiple forms of low cognitive functioning were identified using a psychometric algorithm approach outside the usual clinical context, rather than via a clinical consensus. Since outcomes of MCI are complex, input from a variety of samples and definitional methodologies may assist in identifying the critical baseline MCI features that predict poor outcomes or morbidity. While other studies of MCI have examined long-term outcomes such as conversion to dementia, nursing home placement, and death (e.g., Artero et al., Reference Artero, Ancelin, Portet, Dupuy, Berr, Dartigues and Ritchie2008; Ganguli et al., Reference Ganguli, Dodge, Shen and DeKosky2004; Storandt, Grant, Miller, & Morris, Reference Storandt, Grant, Miller and Morris2002), we examined differences in group characteristics, including baseline functional (ADL/IADL) status, general self-reported health, and depression. We also explored differences in progression to incident dementia based on estimates derived by Unverzagt et al. (Reference Unverzagt, Guey, Jones, Marsiske, King, Wadley and Tennstedt2012) and attrition, as failure to continue to participate may be informative of one's broader functional and/or motivational status at the time of withdrawal. Lastly, the stability of classifications over the 5-year interval was determined by group with a focus on examining the differences in functional outcomes for those that remained stably impaired versus those with variability in classification.
Method
Participants
All participants (N = 2802) randomized in the ACTIVE clinical trial were considered for cognitive impairment classification. Recruitment procedures, sample characteristics, and study design have been described elsewhere (Ball et al., Reference Ball, Berch, Helmers, Jobe, Leveck, Marsiske and Willis2002; Willis et al., Reference Willis, Tennstedt, Marsiske, Ball, Elias, Mann Koepke and Wright2006). Briefly, the randomized, controlled, single-blind trial evaluated the effectiveness of three cognitive training interventions in improving mental abilities and daily functioning in independent adults over age 65. Inclusion criteria required participants to have a Mini-Mental State Examination (MMSE; Folstein, Folstein, & McHugh, Reference Folstein, Folstein and McHugh1975) score of ≥23, no prior diagnosis of dementia, and no self-reported ADL limitations (e.g., bathing, dressing, and personal hygiene). Participants were recruited at six field sites and included over-sampling of African Americans. All procedures were approved by the Institutional Review Boards at each collaborating site and informed consent was obtained before participation.
For the larger ACTIVE intervention study, participants were randomized into one of four training conditions, and half of the trained participants were subsequently randomized to receive additional booster training. This resulted in seven experimental groups (Control, Memory, Memory + Booster, Reasoning, Reasoning + Booster, Speed, Speed + Booster; see Willis et al., Reference Willis, Tennstedt, Marsiske, Ball, Elias, Mann Koepke and Wright2006). The current study did not examine training effects, but these groupings were used to adjust for differential rates of change at later occasions, as described below.
Analyses examined cognitive impairment at each of the study occasions except the immediate posttest (baseline, BL; first annual, A1; second annual, A2; third annual, A3; fifth annual; A5; there was no fourth annual assessment), as well as the association between stability of impairment and selected outcomes over all possible temporal sequences (1-, 2-, 3-, 4-, and 5-years). The 5-year stability information was largely similar to that of all shorter sequences, so for the purposes of parsimony the BL-to-A5 sequence is the focus of this study. At baseline, all 2802 participants were included in analyses. A total of 1877 participants returned for A5 (56.3% retention rate) and 66 participants were not classified due to missing cognitive data resulting in an analytical sample of 1811 at A5. Group differences in rates and type of attrition are presented in the results section below.
Measures
Description of domains and measures
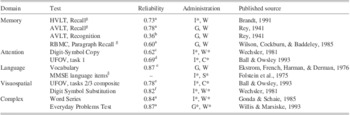
Cognitive measures in ACTIVE were selected as cognitive endpoints for the intervention study (i.e., did trained participants improve?) or for screening/sample characterization purposes. ACTIVE did not include a standard neuropsychological battery or standard administration for all measures. At the same time, ACTIVE did use a robust battery of individual differences measures to permit the longitudinal characterization of the sample. Following Jak, Bondi, et al. (Reference Jak, Bangen, Wierenga, Delano-Wood, Corey-Bloom and Bondi2009), the cognitive measures for this study were categorized into five major domains: Memory, Attention, Language, Visuospatial Processing Speed, and Complex Cognition. (The latter category deviates from Jak's “executive functioning” domain, but better reflects the measures given in ACTIVE). Measures for each domain are shown in Table 1, along with a description of their administration conditions.
Cognitive measures by domain

Note. Administration legend: I = individually administered, G = group administered, W = written responses, S = spoken (interviewer recorded) responses, C = computer administered test. *Asterisked administrations represent standard/usual conditions. Reliability data are all test-retest correlations. UFOV tasks: Task 1 required the participant to identify a target of either a truck or a car that is presented at a central fixation point on the screen. Tasks 2 and 3 were more complex as they required the participant to identify a target of either a truck or a car that is presented at a central fixation point on the screen as well as identify the location of a peripheral car that appeared in one of eight locations both without (Task 2) or with (Task 3) distracter triangles. Scores were recorded based on the minimum stimulus duration in which the participant responded correctly 75% of the time.
HVLT = Hopkins Verbal Learning Test; AVLT = Auditory Verbal Learning Test; RBMT = Rivermead Behavioural Memory Test; UFOV = Useful Field of View; MMSE = Mini-Mental Status Exam; Visuospatial = Visuospatial Processing Speed. Some memory tests were modified for group administration (AVLT, RBMT), and all memory tests employed audiotape administration, written responses by participants, and no delayed trials.
§Items extracted from MMSE; published reliabilities not available.
aBall et al., 2002.
bSchmitt, 2004.
cCalculated using ACTIVE control group, BL-1 Year.
dEdwards et al., 2005.
eCalculated using ACTIVE control group, BL-Post test.
fWechsler, 1981.
gNo delayed recall list was given.
Additional measures were used to compare group differences at baseline and follow-up. These include the MMSE to measure global functioning (Folstein et al., Reference Folstein, Folstein and McHugh1975), and the Center for Epidemiological Studies-Depression-12 scale (CES-D) to assess depressive symptomotology (Radloff, Reference Radloff1977). A composite of everyday functioning that is composed of the sum of the IADL performance and difficulty scores and ADL score (ADL/IADL Morris et al., Reference Morris, Fries, Steel, Ikegami, Bernabei, Carpenter and Topinkova1997) was used as a tool to examine functional status (higher scores = lower functioning). The Physical Functioning and General Health subscales of the MOS Short Form Health Survey (SF-36; Ware & Sherbourne, Reference Ware and Sherbourne1992) were used to evaluate general well-being that is non-specific to cognition.
Procedures
Classification of participants
The baseline data were used as the basis for the percentiling of all scores at all occasions. Percentiles were used (vs. a standard-deviation-unit cutoff) to guard against possible non-normality of scores. The baseline score distribution for each measure was computed separately for each combination of age (65–69.9, 70–74.9, 75–79.9, and 80+ years), education (0–11.9 years, 12–15.9 years, and 16+ years), and race (African American, White).
At occasions after baseline, raw scores were first adjusted for practice/training effects, and then were percentiled according to each participant's baseline subgroup distribution. For example, if a participant was randomized into the “reasoning + booster training group”, then the average later-occasion gain experienced by that group was subtracted from the participant's follow-up score. So, if the reasoning + booster training group, on average, had a baseline score of 12, 14 at A1, and 16 at A2, then the group's net gain at A1 and A2 were 2.0 and 4.0 points, respectively. These net gains were subtracted from every reasoning + booster participant to rescale their later scores back into baseline metric. This rescaling was done separately for every measure, at every occasion, and for each of the seven groups listed above. This approach corrected for gross training and practice effects, but still allowed individuals who gained more or less than their group to preserve their differential changes. It was these adjusted scores that were percentiled against an individual's age-race-education baseline subgroup's distribution. Once all tests were percentiled at all occasions, then composite percentile scores (mean of each individual test's percentile) were computed in each of the five cognitive domains (Memory, Attention, Language, Visuospatial Processing Speed, Complex Cognition) at each occasion. Individuals whose average percentile was 15.87 or lower (∼1 SD below the mean) were classified as impaired in that domain.
Using these domain percentiles, participants were then classified into three groups: Unimpaired, Amnestic MCI, and Non-Amnestic MCI. At each occasion, participants were considered Amnestic if they were considered impaired in the Memory domain, and Non-Amnestic if they were impaired in one or more of the other four domains (Attention, Language, Visuospatial Processing Speed, Complex Cognition) and not Memory. While these classifications use similar terminology to Petersen (Reference Petersen2004), subjective memory complaints were not considered. Given ceiling effects in daily functioning at baseline (due to ACTIVE inclusion criteria), there was no exclusion criterion for functional impairments in the current study. Not having done so at baseline, we also did not do so at later classifications, so as not to disrupt the stability of our classification algorithm. ADL/IADL differences are considered, however, in our group comparisons below.
Intraindividual stability of classification
For every combination of occasions (i.e., BL-to-A1, BL-to-A2, BL-to-A3, BL-to-A5, A1-to-A2, etc.), participants were classified into six groups based on the stability of their impairment classification at each respective occasion (Amnestic, Non-Amnestic, Unimpaired). As noted above, given the similarity of findings across occasions, only data from BL to A5 (the longest possible sequence) are presented here; shorter sequences are presented in the Appendix. Participants were considered (1) Stable Amnestic (AMNESTIC) if they were classified as Amnestic at both respective occasions (e.g., BL and A5); (2) Stable Non-Amnestic (NON) if they were classified as Non-Amnestic at both occasions; (3) Flipped Impairment (FLIP) if they were impaired at both occasions, but whose impairment classification switched (i.e., from Amnestic-to-Non-Amnestic or Non-Amnestic-to-Amnestic); (4) Reverted to Unimpaired (REVERT) if the participant was impaired at the first occasion (e.g., BL) but then were unimpaired at the second occasion (e.g., A5); (5) Worsened to Impaired (WORSEN) if they were first classified as Unimpaired but then were impaired at the second occasion being examined; and (6) Stable Unimpaired (UNIMPAIRED) if the participant was consistently Unimpaired across the respective occasions being investigated. If a participant was not present at one of the two occasions being examined, then they were not included in those specific classification analyses.
Attrition
Overall study attrition was examined and defined as not being present at A5 (they may have dropped out at any point during the intervening 5 years). Follow-up attrition analyses examined differences between baseline impairment groups in subtypes of attrition (using categories first described by Cooney, Schaie, & Willis, Reference Cooney, Schaie and Willis1988), including voluntary (not motivated/interested, no time, moved, or lost-to-follow-up, unresponsive, non-compliant, or for unspecified reasons), involuntary (relocation, too sick, caregiving demands, moved to nursing home, dementia, or family refuses access), and death.
Statistical Analyses
Demographic comparisons between groups were conducted with Bonferroni-corrected one-way analyses of variance (ANOVAs) for continuous variables. χ2 analysis was used for dichotomous variables, with logistic regressions (unimpaired group as reference group) as Bonferroni-corrected follow-ups. Subsequent analyses compared the six intraindividual stability groups on A5 outcomes. As with the baseline comparisons, Bonferroni-corrected one-way ANOVAS and or χ2 analyses were conducted. To test whether reasons for attrition differed by baseline impairment group we used a χ2 Goodness of Fit test, under the equiprobability null hypothesis. This approach enabled us to compare proportions directly, and was not biased by differences in group size.
Results
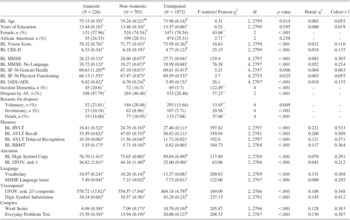
Table 2 shows demographic information and various outcomes of the baseline classification of the analytic sample. At baseline, the results indicated that a total of 929 participants met the algorithmic criteria for MCI, with 8.07% of the analytical sample classified with as Amnestic and 25.09% as Non-Amnestic (i.e., impairment in 1 + non-memory domain), resulting in 66.85% of the sample being Unimpaired. Table 3 displays the raw number of participants classified as impaired by specific cognitive domain. While the analyses only distinguished between Amnestic and Non-Amnestic, for the sake of transparency, Table 3 distinguishes between single-domain, mulitdomain—amnestic, and multidomain—non-amnestic.
Baseline raw impairment numbers (percent) by cognitive domain

Note. The percentage corresponds to the proportion of people with that particular impairment (e.g., memory) classified as either single domain, multidomain amnestic, or multidomain non-amnestic. Visuospatial = Visuospatial Processing Speed.
Comparing the impairment groups (Table 2; to adjust for possible sources of group differences, vision and depression were covaried), several significant group differences were found. Specifically, the Amnestic group was significantly older than the Unimpaired group, despite using age as a stratification variable in the percentiling of individual scores. Neither education nor the proportion of African Americans differed across groups. There was a higher proportion of men in the Amnestic (p < .05) and Non-Amnestic (p < .10) groups. Both of impaired groups performed significantly worse than the Unimpaired group on Vision, depressive symptoms, and the SF-36 Physical Functioning subscale. On the MMSE and the IADL/ADL outcome, a three-group difference emerged (Unimpaired > Non-Amnestic > Amnestic). Since five language items from the MMSE were used as a language domain measure (for the purpose of classification), we re-examined the group differences with the language items removed, and the pattern of group differences was identical. On the SF-36 General Health subscale, the Non-Amnestic group rated its health more poorly than the unimpaired group.
Baseline cognitive status classifications and means (standard errors) of respective baseline outcomes (N = 2,802)

Note. BL = Baseline; CES-D = Center for Epidemiological Studies-Depression-12; MMSE = Mini-Mental Status Exam; SF-36 = MOS Short Form Health Survey; IADL/ADL = Instrumental Activities of Daily Living/Activities of Daily Living; HVLT = Hopkins Verbal Learning Test; AVLT = Auditory Verbal Learning Test; RBMT = Rivermead Behavioural Memory Test; UFOV = Useful Field of View; Visuospatial = Visuospatial Processing Speed
Matching superscript letters indicate values are not significantly different, p > .05, using Bonferroni corrected one-way ANOVAs. Chi-squared tests were used to measure dichotomous variables and are denoted with superscript+. Significant overall chi-square statistics were followed up with logistic contrasts, using the Unimpaired group as the reference value; significant differences after adjusting for the 2 comparisons to the reference group are denoted with superscript asterisk. Trend-level significant difference from the Unimpaired group, p < .10, is denoted with superscript T. Values after CES-D are after covarying for BL Vision and Depression.
Incident Dementia and Attrition
Differences in progression to dementia status
As shown in Table 2, χ2 analyses with follow-up logistic regressions revealed that the proportion of participants progressing to dementia status defined by Unverzagt et al. (Reference Unverzagt, Guey, Jones, Marsiske, King, Wadley and Tennstedt2012) by A5 was significantly higher in the Amnestic and Non-Amnestic groups than in the Unimpaired group. Combining data from the Amnestic and Non-Amnestic groups, and comparing to the Unimpaired, impaired participants had 3.4 times higher rates of progression to dementia.
Differences in dropout by impairment group
Similar to incident dementia, the proportion of participants dropping out of the study by A5 was significantly higher in the Amnestic and Non-Amnestic groups than in the Unimpaired group. When we subsequently examined type of attrition, both impaired groups evinced a higher proportion of dropouts in each category relative to the Unimpaired group. Combining data from the impaired groups and comparing to the Unimpaired, impaired participants had 1.4, 1.6, and 1.7 times higher rates of dropout for reasons of voluntary (i.e., not interested, too busy), involuntary (i.e., relocated, too ill, caregiving), and death, respectively.
Long-term Consequences of Stability of Impairment Status
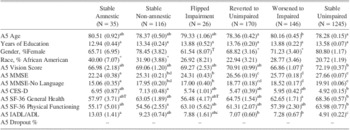
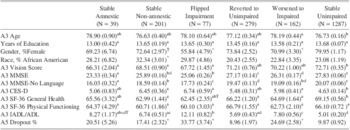
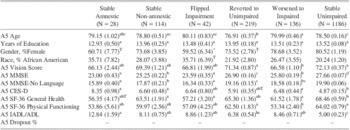
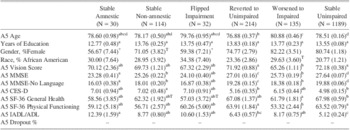
As noted in the Method section, the results focus on the individual outcomes associated with one's classification stability from BL-to-A5. Due to length limitation and similar findings compared to the 5-year period, stability for all shorter periods are not discussed here (see Appendix for tables).
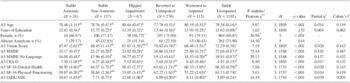
Table 4 displays the six different kinds of stability/instability observed in this study. These include the following: (1) stably amnestic (AMNESTIC), (2) stably non-amnestic (NON), (3) impaired at both occasions but “flipped” from one subtype to another (FLIP), (4) impaired at baseline but were later unimpaired (REVERT), (5) initially unimpaired but progressed to impaired (WORSEN), and (6) stably unimpaired across the period (UNIMPAIRED).
Stability classifications from BL to A5 and means (standard errors) of respective A5 outcomes (N = 1,811)

Note. A5 = 5-year follow-up; MMSE = Mini-Mental Status Exam; CES-D = Center for Epidemiological Studies-Depression-12; SF-36 = MOS Short Form Health Survey; IADL/ADL = Instrumental Activities of Daily Living/Activities of Daily Living.
Matching superscript letters indicate values are not significantly different, p > .05, using Bonferroni corrected one-way ANOVAs. Chi-squared tests were used to measure dichotomous variables and are denoted with superscript +. Significant overall chi-square statistics were followed up with logistic contrasts, using the Stable Unimpaired group as the reference value; significant differences after adjusting for the five comparisons to the reference group are denoted with superscript *. Trend-level significant difference from the Stable Unimpaired group, p < .10, is denoted with superscript T.
Given the complexity of Table 4, the best general schematic summary of differences is UNIMPAIRED >REVERT>WORSE>NON>FLIP>AMNESTIC. This ordering was fairly consistent across most of the long-term outcomes. Breaking this down, we first examined the three stable groups. Generally, AMNESTIC showed the poorest scores on most outcomes considered although, for reasons of statistical power, differed from the UNIMPAIRED participants only on MMSE and ADL/IADL performance. The NON group showed a similar pattern, evincing poorer performance than the UNIMPAIRED on the MMSE and ADL/IADL. The NON group also had a higher proportion of African Americans than the UNIMPAIRED. Comparing AMNESTIC and NON, the AMNESTIC group showed significantly lower MMSE scores (approximately 2 scale points).
Next, for groups who experienced classification changes between BL and A5, the REVERT>WORSE>FLIP pattern suggested above held for the MMSE, ADL/IADL, General Health and Physical Functioning, and the CES-D. A small exception to this pattern was seen for vision, where the WORSEN group showed poorer vision than the FLIP group. FLIP and WORSEN groups were significantly older than the UNIMPAIRED, and there was a significantly higher proportion of women in the FLIP group than in the UNIMPAIRED. In general, while performing slightly better on most variables, the FLIP and WORSEN groups were not statistically different from either the AMNESTIC or NON groups.
Taken together, the results suggest that impairment status at any time was associated with poorer long-term outcomes in cognitive, affective, functional, and sensory domains, with the least long-term risk for those who appeared to revert to normal. This held despite the fact that impairment classifications were adjusted for age, education, and race group membership.
Discussion
The first aim of this study was to identify MCI participants for each follow-up over the first 5 years of the study using a psychometric method that solely relied on normative for sample- and training-corrected cognitive performance. At baseline, results indicated a total of 8.07% of the sample had an amnestic impairment, while 25.09% had a non-memory impairment (i.e., impairment in either attention, language, visuospatial processing speed, or complex executive domain). This rate is likely over-inclusive due to the four domains that comprise this group compared to the one domain for the amnestic group, as well as the 1-SD definition of impairment. Nonetheless, it likely identifies community-dwelling individuals with low baseline cognition that may be at risk of further decline. The remaining 66.85% of the sample were not impaired in any domain. Importantly, ACTIVE is not a population-based cohort and since 929 individuals (33.15%) met the criterion for some type of mild impairment at baseline, the current classifications should not be considered incidence rates.
In a prior algorithmic study, Ritchie et al. (Reference Ritchie, Artero and Touchon2001) found a rate of amnestic MCI of 3.2%, which is lower than the rate of amnestic impairment in the current study, despite having the same 1-SD definition of impairment. The current rate of any impairment is slightly lower than the 35% noted in a population-based study that algorithmically classified MCI using the same a 1-SD definition as done in the current study (Ganguli et al., Reference Ganguli, Chang, Snitz, Saxton, Vanderbilt and Lee2010). The current rate of cognitive impairment is also similar to previous population estimates (e.g., Plassman et al., Reference Plassman, Langa, Fisher, Heeringa, Weir, Ofstedal and Wallace2008; Unverzagt et al., Reference Unverzagt, Gao, Baiyewu, Ogunniyi, Gureje, Perkins and Hendrie2001). As such, the similarity of our prevalence rates relative to other investigations lends support to the use of the MCI label in this non-traditional investigation of community-based participants. The between-study differences in rates are likely due to the substantial sampling variations.
Demographic and functional status comparisons at baseline suggested that the Amnestic group was disadvantaged in several ways in comparison to the other groups. Both impaired groups performed worse than the unimpaired group on measures of vision, self-reported physical functioning, and depressive symptoms. Additionally, impaired participants were significantly more likely to progress to dementia status and leave the study over the 5-year interval. There were no significant differences between classification groups on education level or race, likely as a result of controlling for these variables in developing the sample's normative cognitive scores for classification. The magnitude of these differences (Cohen's f: 0.1 = small; 0.25 = medium; 0.4 = large; Cohen, Reference Cohen1988) range from very small for most of the demographic variables (e.g., age, education, general health, physical functioning), to small for IADL/ADL, to medium for the MMSE. The magnitude for the differences in raw test scores ranged from medium (e.g., Digit Symbol Copy) to large (e.g., HVLT).
The group classifications in the current study were somewhat fluid over the 5-year interval. In general, those who were stably impaired had poorer long term outcomes across the variables studied (e.g., ADL/IADL, MMSE), lending support to the notion that the baseline impaired participants were likely an at-risk group. Additionally, inconsistency in performance and classification also appeared to be related to poorer outcomes, with those who “flipped” impairment, as well as those who worsened over time, appeared to have poorer outcomes for almost all outcome variables. Lastly, even the group that reverted from impaired to unimpaired had less favorable 5-year outcomes than those who were stably unimpaired; however, this “revert” group did have the least poor outcomes of all the impairment groups. The magnitude of these group differences ranged from small for age, education, vision, CES-D, general and physical health, to medium for IADL/ADL functioning, to large for the MMSE. Taken together, it appears that even in a study like ACTIVE, where clinical classification was not the intended goal at the outset of the study, there is prognostic value for identifying and tracking long-term cognitive impairment outcomes.
While no ACTIVE participants met CES-D cutoffs indicative of major depression at enrollment, baseline impaired groups did report a higher number of depressive symptoms compared to the Unimpaired group. Over time, those who worsened and flipped impairment groups appeared to have more depressive symptoms than those who remained stably unimpaired. This is consistent with literature suggesting that there is a higher risk of conversion to MCI when participants initially demonstrate depressive symptoms (Goveas, Espeland, Woods, Wassertheil-Smoller, & Kotchen, Reference Goveas, Espeland, Woods, Wassertheil-Smoller and Kotchen2011) and that early onset and/or chronic depression itself serves as a risk for developing dementia (Panza et al., Reference Panza, Frisardi, Capurso, D'Introno, Colacicco and Solfrizzi2010).
The fluidity of classifications over time is similar to previous studies that have found substantial rates of individuals originally classified as impaired, but subsequently classified as normal on follow-up assessment (for review, see Brooks, Iverson, Holdnack, & Feldman, Reference Brooks, Iverson, Holdnack and Feldman2008). Briefly, such fluidity can result from various factors, such as retrofitting criteria to data that may not have been collected for the purposes of MCI identification, the rigidity of an algorithm whereas small shifts in a test score might not sway clinical consensus panels, the possibility of regression to the mean, as well as an understanding of the base rates of low or “abnormal” test scores in the population (Brooks, Iverson, & White, Reference Brooks, Iverson and White2007). It is likely that the large number of Non-Amnestic participants contributed the instability found in this sample, as the single-domain non-amnestic subtype often displays the lowest stability, with evidence of up to 50% returning to unimpaired status (e.g., Bickel, Mösch, Seigerschmidt, Siemen, & Förstl, Reference Bickel, Mösch, Seigerschmidt, Siemen and Förstl2006; for review, see Jak, Bangen, et al., Reference Jak, Bangen, Wierenga, Delano-Wood, Corey-Bloom and Bondi2009). Regardless of the source, the classification variability underscores the importance of multiple assessments for determining the most appropriate treatment action (Feldman & Jacova, Reference Feldman and Jacova2005).
There are several limitations to this study. First, ACTIVE does not represent a nationally representative sample. Comparison of the baseline enrollment sample (enrolled between 1998 and 2000) and the 2000 US census (US Census Bureau, 2000) suggests that ACTIVE fairly well represented the proportion of the population of white females and African American males, but slightly over-represented African American females and under-represented the prevalence of white males. The oldest cohorts were also somewhat under-represented. Whites in ACTIVE were somewhat more educated than the population, whereas African American participants were substantially more educated than the population. Notably, these differences played little role in individual impairment classifications, since classifications were done separately for age/educational/race subgroups. Importantly, the majority of participants of ACTIVE were in a training program intended to improve their performance. While this factor does add variance in the data that is not present in other published longitudinal MCI studies, a correction factor derived from the average gain for each treatment group was used to adjust for some of this additional variance.
Second, ACTIVE had a high rate of attrition over the 5-year interval, and the groups with cognitive impairment had higher rates of attrition compared to the unimpaired elders. However, the analyses in this study suggest that amount and type of attrition (>1.5 times the rate of involuntary attrition, like illness and relocation, as well as death) was consistent with the notion that those classified as impaired were less able to continue with the demands of the study. Another limitation is that the current study did not use standard clinical measures and procedures to classify participants as what is typically considered MCI, thus the measures used in the present study might not be the best indicators of impairment. Some cognitive tasks shown in published studies to be affected in MCI patients were not included in the study (e.g., delayed memory free recall, verbal fluency, set-shifting, and visuospatial constructions).
Because of the battery of measures used and the non-standard administration, external published normative information was not appropriate to use. Moreover, classification was based solely on composite test performance standardized to the sample mean after controlling for confounding variables (e.g., age, education, race), which has inherent error and variability that may have led to misclassification, especially for those participants who were close to the cutoff (Larrieu et al., Reference Larrieu, Letenneur, Orgogozo, Fabrigoule, Amieva, Le Carret and Dartigues2002). Next, by relying on a percentile cutoff in our algorithm, this serves to pre-define the proportion of participants who will have impairment, which is true of all normative-based approaches. Lastly, the algorithmic approach used in this investigation did not exclude participants who may have cognitive impairment beyond MCI. So as not to compromise the consistency of the algorithm at the fifth annual follow-up, daily functioning was not included at the later occasion. Given the limitations, additional studies using a more standard assessment are needed for replication of findings. It is noteworthy that, despite these limitations, we found clear functional differences between impaired and unimpaired groups (even after age/education/race correction), higher rates of incident dementia and informative dropout in those classified as impaired, and that stable classification as impaired was associated with poorer 5-year outcomes. Thus, while the classifications in this study cannot be upheld as meeting a rigorous clinical evaluation standard, we believe that the findings may nonetheless have relevance and interest to a neuropsychologist audience. ACTIVE offers an unusually large, well-characterized, and long-studied cohort, and, therefore, offers a naturalistic lens on cognitive changes that many other studies cannot.
Now that classifications have been developed for ACTIVE, future work can further explore the neuropsychological, demographic, and medical predictors of the cognitive impairment classifications within this sample, as this study can serve as a lens into how incipient cognitive impairment may play out in a large, community-dwelling cohort. Additionally, these classifications can be used to determine how low initial cognitive functioning may have impacted training gains or other functional outcomes, including driving, medication use, or relocation. This study has shown that other longitudinal cognitive aging studies could potentially have an alternative way of analyzing data that was not specifically collected for the purpose of identifying cognitive impairment. In turn, these studies could help to better understand the complexity of the longitudinal outcomes of MCI from different samples and definitional methodologies to assist in identifying what critical baseline MCI features may predict poorer outcomes.
Acknowledgments
Supported by grants from the National Institute of Nursing Research (U01 NR04508, U01 NR04507) and the National Institute on Aging (U01 AG14260, U01 AG14282, U01 AG14263, U01 AG14289, U01 AG014276). The content is solely the responsibility of the authors and does not necessarily represent the official views of the National Institute of Nursing Research, National Institute on Aging, or the National Institutes of Health. Representatives of the funding agency have been involved in the review of the manuscript but not directly involved in the collection, management, analysis or interpretation of the data. Drs. Unverzagt and Marsiske have received research support from Posit Science, Inc., in the form of site licenses for cognitive training programs for different research projects. There were no conflicts of interest.
Appendix
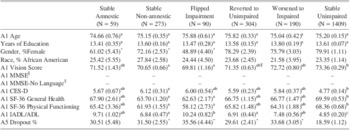
Stability classifications from BL to A1 and means (standard errors) of respective A1 outcomes (N = 2,325)

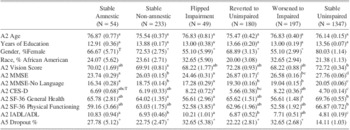
Stability classifications from A1 to A2 and means (standard errors) of respective A2 outcomes (N = 2,060)

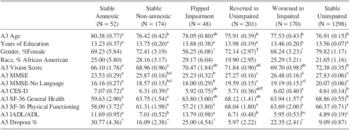
Stability classifications from A2 to A3 and means (standard errors) of respective A3 outcomes (N = 1,943)

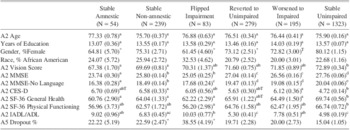
Stability classifications from BL to A2 and means (standard errors) of respective A2 outcomes (N = 2,173)

Stability classifications from A1 to A3 and means (standard errors) of respective A3 outcomes (N = 1,941)

Stability classifications from A3 to A5 and means (standard errors) of respective A5 outcomes (N = 1,738)

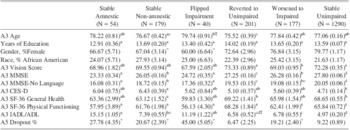
Stability classifications from BL to A3 and means (standard errors) of respective A3 outcomes (N = 2,045)

Stability classifications from A2 to A5 and means (standard errors) of respective A5 outcomes (N = 1,725)

Stability classifications from A1 to A5 and means (standard errors) of respective A5 outcomes (N = 1,714)