Introduction
The anatomical structure of the elasmobranch retina adheres to the typical vertebrate plan (Walls, Reference Walls1942; Hughes, Reference Hughes and Crescitelli1977; Fernald, Reference Fernald, Atema, Fay, Popper and Tavolga1988; Collin, Reference Collin, Archer, Djamgoz, Loew, Partridge and Vallerga1999). The photoreceptors capture the light information and transform it into an electrical signal. This neural signal is carried vertically and laterally through the retinal interneurons (horizontal, bipolar and amacrine cells) to the ganglion cells, where the signal is conveyed along the optic nerve and to the brain. The density and distribution of cells in the vertebrate retina, particularly in the photoreceptor and ganglion cell layers, influence fundamental visual abilities, such as spatial resolution and spatial summation (Lythgoe, Reference Lythgoe1979). The convergence of visual information via interneuronal wiring between photoreceptors and ganglion cells leads to signal summation. High summation can enhance the retina’s sensitivity to light in scotopic conditions (Warrant, Reference Warrant1999). However, as it is only the axons of the retinal ganglion cells that constitute the optic nerve, the number of ganglion cells in the retina places a limit on the spatial resolution of the eye, and consequently, high summation between the photoreceptor and the ganglion cells restricts the spatial resolution of the eye (Rodieck, Reference Rodieck1973). In elasmobranchs, retinal areas of high spatial resolution are found in different locations to areas of high spatial summation (Litherland & Collin, Reference Litherland and Collin2008).
The topographic analysis of retinal neurons, specifically the photoreceptor and ganglion cells, provides information about the importance of specific regions of the visual environment and reveals insights into the visual behavior for many vertebrates, including fish (Collin, Reference Collin, Archer, Djamgoz, Loew, Partridge and Vallerga1999), amphibians (Dunlop & Beazley, Reference Dunlop and Beazley1981), reptiles (Barbour et al., Reference Barbour, Archer, Ghart, Thomas, Dunlop, Beazley and Shand2002), birds (Hayes & Brooke, Reference Hayes and Brooke1990), and mammals (Hughes, Reference Hughes and Crescitelli1977; Murayama et al., Reference Murayama, Somiya, Aoki and Ishii1995). The heterogenous distribution of cells identified in topographic studies can be classified into two prevailing patterns: an area describes a concentric increase in retinal cell densities, while a visual streak describes elongated increases in retinal cell densities (Hughes, Reference Hughes and Crescitelli1977). Increased sampling by these specialized regions of the retina provides an animal with improved visual ability across a corresponding section of the visual field (Hughes, Reference Hughes and Crescitelli1977). Among sharks, the topographic distribution of retinal neurons forms both areae and visual streaks. Pelagic and benthopelagic species show a central area of high cell density, that is, the cookie cutter shark, Isistius brasiliensis (Bozzano & Collin, Reference Bozzano and Collin2000), the white shark, Carcharodon carcharias (Litherland, Reference Litherland2001), the blue shark, Prionace glauca, and the grey nurse shark, Carcharias taurus (Lisney & Collin, Reference Lisney and Collin2008), while species inhabiting a less complex terrain, or with an open view of the horizon, show an archetypal visual streak, that is, the lemon shark, Negaprion brevirostris (Hueter, Reference Hueter1991), the tiger shark, Galeocerdo cuvier (Bozzano & Collin, Reference Bozzano and Collin2000), and the dogfish, Centroscymnus coelolepis (Bozzano, Reference Bozzano2004). Species inhabiting structurally complex visual environments, that is, the whitetip reef shark, Triaenodon obesus, or using specialized ambush predatory strategies, that is, the ornate wobbegong shark, Orectolobus ornatus, show multiple areae (Litherland & Collin, Reference Litherland and Collin2008). The range of retinal specializations shown among shark species highlights the diversity of visual demands encountered by this vertebrate group.
The eyes of teleosts and sharks continue to grow throughout life, and changes in retinal anatomy may occur to preserve visual capabilities as the eye continues to grow. In addition, the visual system of some vertebrates can be modified during growth to maintain its efficiency in a new environment (Archer, Reference Archer, Archer, Djamgoz, Loew, Partridge and Vallerga1999; Beaudet & Hawryshyn, Reference Beaudet and Hawryshyn1999). Many shark species are long lived and wide ranging and often select different habitats for growth, reproduction, and feeding (Compagno et al., Reference Compagno, Dando and Fowler2005). Consequently, habitat complexity, environmental lighting conditions, and feeding strategies may change throughout these animals’ lifetime. Changes in the visual system may also occur to improve certain visual abilities as the environment and/or behavior change throughout ontogeny (Fernald, Reference Fernald, Atema, Fay, Popper and Tavolga1988; van der Meer, Reference van der Meer1995; Shand, Reference Shand1997; Shand et al., Reference Shand, Chin, Harman and Collin2000a).
Here, we investigate ontogenetic variability in retinal specializations for two species of shark: the sandbar shark, Carcharhinus plumbeus (Carcharhinidae), and the shortspine spurdog, Squalus mitsukurii (Squalidae). S. mitsukurii is widely distributed in the upper reaches of insular and continental shelves and upper slopes, preying on benthic and mesopelagic prey (200–1000 m) (Wilson & Seki, Reference Wilson and Seki1994). C. plumbeus has an extensive distribution from shallow coastal estuaries to offshore oceanic islands (0–300 m). Juveniles and adults can occupy different habitats or depth ranges and show ontogenetic shifts in diet with benthic crustaceans being replaced by teleosts and elasmobranchs as the animal matures (McAuley et al., Reference McAuley, Lenanton, Chidlow, Allison and Heist2005; McElroy et al., Reference McElroy, Wetherbee, Mostello, Lowe, Crow and Wass2006; Ellis & Musick, Reference Ellis and Musick2007; Grubbs et al., Reference Grubbs, Musick, Conrath, Romine, McCandless, Kohler and Pratt2007). This study complements a concurrent investigation on ontogenetic variability of visual optics in these two species (Litherland et al., in press).
The aims of this study were to characterize the spatial distribution of photoreceptor and ganglion cells in the retina of C. plumbeus and S. mitsukurii and to investigate if the spatial distribution of retinal neurons in the ganglion cell layer undergo any changes with ontogenetic growth of the eye. Furthermore, we calculate the peak spatial resolving power (SRP) and the convergence ratio between photoreceptor and ganglion cells within the retina. We quantify the angular extent of the visual field and indicate the parts of the visual field preferentially sampled with high-resolution vision. Our results reveal that species-specific retinal specializations in C. plumbeus and S. mitsukurii are correlated with each species’ behavior and ecology.
Materials and methods
Specimen collection
A population of S. mitsukurii were sampled (n = 13) from the insular shelf of the Hawaiian Island chain in the Central Pacific. Three populations of C. plumbeus were sampled (n = 25) for the study to represent the extremes in visual environment encountered by this species: a tropical population inhabiting the insular shelf of the Hawaiian Island chain (C. plumbeus H1 = transparent oceanic waters, depth >70 m), a temperate population inhabiting the continental shelf in the northwestern Atlantic Ocean (C. plumbeus H2 = turbid estuarine waters, depth <10 m), and a subtropical population inhabiting the continental shelf of eastern Australia in the western Pacific (C. plumbeus H3 = green coastal waters, depth >50 m). Specimens were later pooled due to insignificant differences in retinal specializations between populations. Specimens were caught either on rod and reel or on a demersal longline using 14/0 and 18/0 baited circle hooks, set at depths of approximately 300 m (S. mitsukurii), 70–100 m (C. plumbeus H1), and approximately 10 m (C. plumbeus H2), or donated from commercial longline fishing operations (C. plumbeus H3). Live sharks were sacrificed with a large dose of either benzocaine (>250 mg/kg; Sigma-Aldrich Inc., St. Louis, MO) or sodium pentobarbital (Beuthanasia-D, >300 mg/kg; Schering-Plough Animal Health Corp. Union, NJ). Procedures used here adhere to guidelines of the animal care and use committees of the University of Hawaii: HIMB (IACUC# 029-07), the College of William and Mary: VIMS (IACUC# 0423), and the University of Queensland Animal Welfare Committee (AEC# VTHRC/216/05).
After euthanasia, the dorsal and nasal regions of the limbus were scored for orientation and the eyes excised. The cornea and lens were removed, and the eyecup was immersion fixed, for approximately 24 h, in a solution of 4% paraformaldehyde and 0.25% glutaraldehyde in 0.1 m phosphate buffer (pH 7.4). The retinal tissue was dissected free from the eyecup and whole mounted for topographic analysis of photoreceptor and ganglion cell distributions. In addition, pieces of retinal tissue (1 mm2) were sampled from central regions of the eyecup in a juvenile and adult specimen of both C. plumbeus and S. mitsukurii and processed for light microscopy. Samples were embedded in araldite, and sections were cut on an LKB rotary microtome (LKB, Bromma, Sweden) using glass knives. Sections were stained with 4% toluidine blue and photographed using a Tucsen 5.0 MP camera (Optem DC500U; Tucsen, Fujian, China) mounted on a light microscope (Olympus BX50).
Assessment of visual field
The visual field of C. plumbeus (young of the year, n = 2 and adult, n = 2) and S. mitsukurii (juvenile, n = 2 and adult, n = 1) was assessed posteuthanasia in cryosectioned eyes. Whole enucleated eyes were snap frozen and sectioned in a cryostat (Leitz 1720 digital kryostat). The angular extent of the retina was measured (ImageJ freeware, version 1.3.1; http://rsb.info.nih.gov/ij/) from scaled photographs (Canon Powershot s31s) of sectioned eyes through the geometric axis of the eye along both the axial and the equatorial planes. To cross-check this method of measuring the visual field, the angular extent of the retina in C. plumbeus was investigated in a freshly caught adult specimen. The retina was viewed through an ophthalmoscope (model no. 19090; Welch Allyn, Rydalmere, Australia), and the maximum angle where the retina was still visible in the axial and equatorial planes was measured from a protractor centered over the eye.
Assessment of retinal cell distributions
The spatial distributions of photoreceptor and ganglion cells were assessed using the retinal whole-mount technique. This technique allows the sequential examination of photoreceptor and ganglion cells in one retina, while reducing retinal shrinkage and allowing more accurate cell density counts, compared to alternative methods using retinal sections (Coggeshall & Lekan, Reference Coggeshall and Lekan1996). Initially, retinae were whole mounted, photoreceptor layer uppermost, on a glass slide. A border of thin adhesive tape was used to surround the retina to prevent flattening of the photoreceptor outer segments when a coverslip was applied. The visual contrast of the tissue was increased by infiltrating the retina with a few drops of 99% dimethyl sulfoxide (DMSO; Sigma-Aldrich Inc.). The DMSO was blotted away after 24 h and replaced with 100% glycerol. The preparation was coverslipped, and a seal of nail polish prevented dehydration. After the photoreceptor distribution was analyzed, the retinae were flipped and remounted, ganglion cells uppermost, onto gelatinized slides and allowed to air-dry for 2 days. Whole-mounted retinas were rehydrated in an ethanol series, stained with 0.05% cresyl violet (0.05% concentration, pH 3.9), dehydrated, and then cleared in xylene. Ganglion cell whole mounts were coverslipped with Depex mounting medium (Sigma-Aldrich Inc.).
The outline of each whole-mounted retina was drawn onto graph paper using coordinates from the microscope stage rulers. An eyepiece graticule, subdivided into 100 squares, defined areas for counting directly from the microscope at an overall magnification of 400× (for ganglion cell densities) or 1000× (for photoreceptor cell densities). Cell densities were sampled at 0.5- and 0.2-mm steps across the retina (in high- and low-density areas, respectively). Cell counts were converted to cells per square millimeter by dividing the number of cells counted by the area counted in square millimeter. Isodensity contour lines were drawn to link areas of similar cell density following Litherland and Collin (Reference Litherland and Collin2008).
Photoreceptor whole mounts were examined using Nomarski differential interference contrast optics (Zeiss, Oberkochen, Germany) (Table 1 shows groups and sample sizes). Rod and cone photoreceptors were differentiated on the basis of their inner segment diameter, which, in elasmobranchs, is considerably larger in cones than in rods, and frequent adjustment of the fine focus (Hart et al., Reference Hart, Lisney, Collin, Ladich, Collin, Moller and Kapoor2006; Litherland & Collin, Reference Litherland and Collin2008). The identity of rod and cone cells in C. plumbeus and S. mitsukurii has been confirmed at the ultrastructural level in a concurrent investigation (Litherland, Reference Litherland2009).
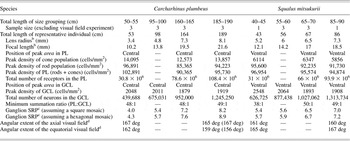
Topographic variation in retinal characteristic in four size groups of the sandbar shark and the shortspine spurdogFootnote a

GCL, ganglion cell layer; PL, photoreceptor layer; —, photoreceptor whole mount or visual field not analyzed for that size class.
a Values are for a representative individual within each size group.
b Values obtained using the lens ray tracing technique (Litherland, Reference Litherland2009).
c SRP in cycles/deg calculated in the peak area.
d Values in parenthesis indicate measurements obtained using an ophthalmoscope.
The ganglion cell layer was examined for cells containing Nissl substance (Table 1 shows groups and sample sizes). Ganglion and amacrine cells could be distinguished from the glial cells in the elasmobranch retina by the presence of cytoplasmic staining (Lisney & Collin, Reference Lisney and Collin2008; Litherland & Collin, Reference Litherland and Collin2008). Ganglion and amacrine cells could be distinguished from each other also by their different staining characteristics. Small, circular darkly stained profiles were designated as amacrine cells, and large, granular irregularly shaped profiles were identified as ganglion cells (Collin, Reference Collin1988). The total number of cells in the photoreceptor and ganglion cell layers was calculated by multiplying the area of each isodensity contour by the average cell density of that contour and then adding the values together.
A representative topographic map for each species was rejoined along the peripheral slits in the retina to form a three-dimensional topographic map (Litherland & Collin, Reference Litherland and Collin2008). This made it possible to approximate which part of the visual field retinal regions of higher cell density subtended, and a schematic illustration of the resulting visual projections was drawn for each species.
Estimating retinal summation and SRP
Summation ratios and SRP were determined for each retina. The density of photoreceptors is compared to that of ganglion cells, within a 1.0 mm2 area, for between 100 and 150 loci in each retina. Topographic maps were constructed to display any spatial differences in summation occurring across the retina (Litherland & Collin, Reference Litherland and Collin2008). SRP was calculated for peak ganglion cell densities assuming both a square mosaic (Collin & Pettigrew, Reference Collin and Pettigrew1989) and a hexagonal mosaic (Theiss et al., Reference Theiss, Lisney, Collin and Hart2007).
Results
The eye and the retina
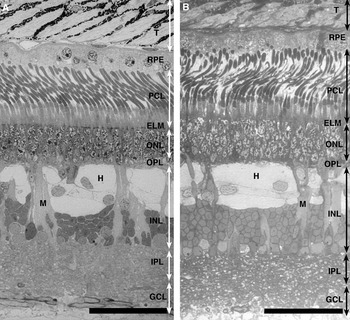
The retinal structure of mature C. plumbeus and S. mitsukurii is shown in Fig. 1. The thickness of the retina decreases between juveniles and adults and differs marginally between the adults of the two species (184–149 μm in C. plumbeus and 186–172 μm in S. mitsukurii). In both species, the photoreceptor layer is dominated by long slender rod cells, which account for approximately 27% of the absolute retinal thickness in C. plumbeus and 30% in S. mitsukurii. Both species show a duplex retina with a rod-to-cone ratio of 7:1 in the area (central retina) of C. plumbeus and 14:1 in the area (ventral retina) of S. mitsukurii. The outer nuclear layer (ONL) consists of three to four layers of photoreceptor nuclei and accounts for approximately 15% of the absolute retinal thickness in both species. The inner nuclear layer (INL) is thicker than the ONL, accounting for approximately 34% of the absolute retinal thickness in both species. Three tiers of cuboidal horizontal cells with large cell bodies and a high number of bipolar cells dominate the INL. In both species, Müller cells are regularly dispersed between the horizontal cells. The ganglion cell layer consists of widely spaced neural cells with axons forming a fibrous layer on the vitreal surface of the retina.
Light micrographs of transverse sections of the retina in a mature individual of Carcharhinus plumbeus H1 (A) and Squalus mitsukurii (B). Note long slender rod cells dominate the photoreceptor layer, and the INL is dominated by large horizontal cells (H) with the vertical arms of Müller cell processes (M) dispersed throughout the retinal layer. T, tapetum lucidum; RPE, retinal pigment epithelium; PCL, photoreceptor layer; ELM, external limiting membrane; OPL, outer plexiform layer; IPL, inner plexiform layer; GCL, ganglion cell layer. Scale bar = 50 μm.

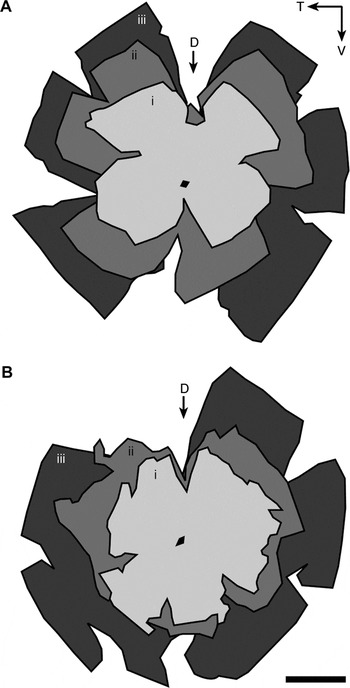
In a previous analysis in C. plumbeus (ranging from 53 to 196 cm total length; species size range = 50–240 cm TL) and S. mitsukurii (ranging from 39 to 86 cm TL; species size range = 30–125 cm TL), we show that the eye grows continually throughout the animals’ lifetime (Litherland et al., in press). This study confirms that the retina in both species continues to grow throughout the size range investigated and also presumably throughout the animals’ lifetime (Fig. 2). The retinal area in C. plumbeus increases threefold from 6.5 cm2 in young-of-the-year stages (53 cm TL) to 21 cm2 in the largest adult stages sampled (189 cm TL) (Fig. 2A). A similar increase in retinal area occurs in S. mitsukurii, which increases from 7 cm2 in the smallest juvenile stages sampled (48 cm TL) to 17.4 cm2 in the largest adult stages sampled (86 cm TL) (Fig. 2B). The total number of neurons in the ganglion cell layer increases linearly with retinal growth (C. plumbeus, r 2 = 0.97, y = 130,000 + 5500x, n = 18 and S. mitsukurii, r 2 = 0.98, y = 390,000 + 220,000x, n = 8). Overall, however, peak ganglion cell densities decrease as the area of the retina increases between juveniles and adults in both C. plumbeus and S. mitsukurii (Table 1).
Schematic representation of three whole-mounted retinae of different sizes overlaid using the optic nerve head as a reference point for Carcharhinus plumbeus H1 (A) and Squalus mitsukurii (B). (A) i = 53 cm TL, ii = 112 cm TL, and iii = 189 cm TL. (B) i = 43 cm TL, ii = 56 cm TL, and iii = 86 cm TL. The retina more than doubles in area from 6.5 to 21 cm2 in C. plumbeus H1 and from 7 to 17.4 cm2 in S. mitsukurii. T, temporal; V, ventral; D, dorsal orientation slit. Black circle indicates the optic nerve head. Scale bar = 1 cm.

Visual field
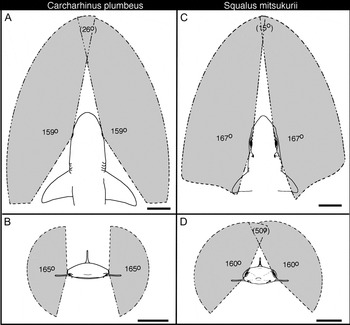
The maximum angular extent of the retina indicates that juvenile C. plumbeus have a visual field approaching 160 deg in the equatorial plane and 165 deg in the axial plane, which affords a 26-deg binocular overlap in the frontal visual field (Fig. 3A). When the pupillary aperture constricts with light adaptation in C. plumbeus (Litherland et al., in press), the visual field narrows by 20–25 deg in the equatorial plane. Estimations of the visual field obtained from measurements of sectioned eyes fall within 5 deg of measurements obtained using an ophthalmoscope in an adult C. plumbeus (Table 1). Juvenile S. mitsukurii have a visual field approaching 170 deg in the equatorial plane and 160 deg in the axial plane. This affords a binocular overlap of 15 deg in the frontal visual field and 50 deg in the dorsal visual field (Fig. 3B). It is relevant to note here that the pupil aperture of S. mitsukurii does not constrict with light adaptation (Litherland et al., in press). In S. mitsukurii, the convergence point (the point at which the monocular fields overlap and binocular vision occurs) occurs closer to the eyes for the dorsal binocular overlap than for the frontal binocular overlap. For both species, the visual field is similar between juveniles and adults; however, as the distance between the eyes increases with animal size, so too does the convergence point. For example, in the frontal visual field, the distance between a midpoint between the eyes and the convergence point increases from approximately 15 cm (C. plumbeus) and 20 cm (S. mitsukurii) in juveniles to >30 cm in adults of both species.
Visual field projections along the axial and equatorial planes in the dark-adapted eyes of Carcharhinus plumbeus H1 (A and B) and Squalus mitsukurii (C and D). C. plumbeus H1 has a binocular overlap in the frontal visual field of approximately 26 deg with no binocular overlap in the dorsal visual field. S. mitsukurii has a binocular overlap of approximately 15 deg in the frontal visual field and another region of overlap of approximately 50 deg in the dorsal visual field. Scale bar = 5 cm.

Retinal topography
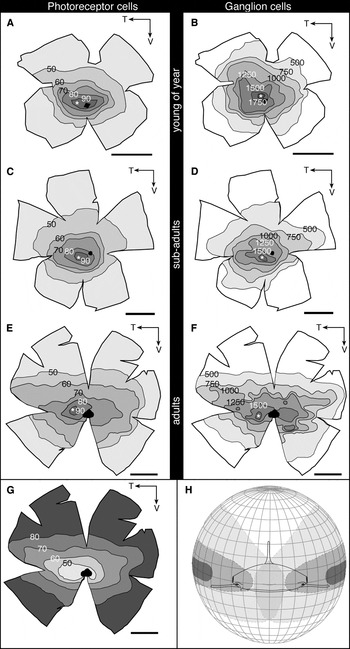
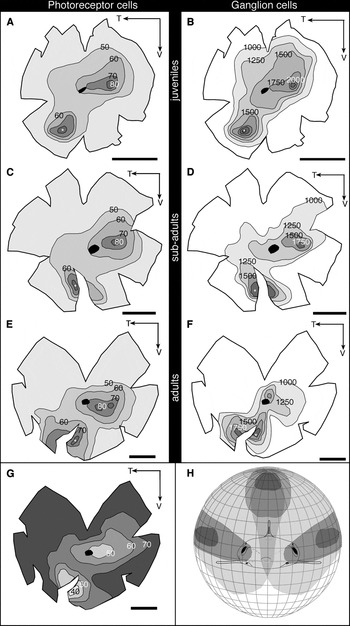
A large variation in photoreceptor and ganglion cell density is shown within each retina, resulting in a nonuniform distribution of neurons. Isodensity contour maps display the relative positions of regions of high cell density for C. plumbeus (Fig. 4) and S. mitsukurii (Fig. 5). The mature sandbar shark, C. plumbeus, has a peak density of rods (94,223 cells/mm2) and cones (13,857 cells/mm2) and ganglion cells (1919 cells/mm2) situated in the central retina (Table 1; Fig. 4). Centro-peripheral gradients in ganglion cell density approach 10:1 with cell densities of below 200 cells/mm2 in the peripheral retina. The spatial distribution of retinal ganglion cells was comparable between C. plumbeus sampled from different populations with no significant difference in peak ganglion cell densities (juvenileH1vs. juvenileH2, P > 0.05, t-test and adultH1vs. adultH3, P > 0.05, t-test). The mature shortspine spurdog, S. mitsukurii, has a peak density of rods (91,730 cells/mm2), cones (5856 cells/mm2), and ganglion cells (1908 cells/mm2) situated in the ventral retina (Table 1; Fig. 5). S. mitsukurii show a second peak in cell density (rods, cones and ganglion cells) in the central retina, positioned nasal to the optic nerve head (Fig. 5). Centro-peripheral gradients in ganglion cell density are approximately 3:1 with cell densities of less than 500 cells/mm2 in the peripheral retina.
Representative topographic distributions of photoreceptor and ganglion cell neurons in the retina of the three different sizes of sandbar shark, Carcharhinus plumbeus H1. The region of highest cell density (*) in both the photoreceptor and the ganglion layers occurs in the central retina. (A and B) Distribution of cells in a young of the year, 53 cm TL. * = 102,891 cells/mm2 in the photoreceptor layer (rods + cones) (A) and 2048 cells/mm2 in the ganglion cell layer (B). (C and D) Distribution of cells in a subadult, 169 cm TL. * = 90,365 cells/mm2 in the photoreceptor layer (rods +cones) (C) and 1879 cells/mm2 in the ganglion cell layer (D). (E and F) Distribution of cells in an adult, 189 cm TL. * = 95,730 cells/mm2 in the photoreceptor layer (rods + cones) (E) and 1919 cells/mm2 in the ganglion cell layer (F). Values in (A), (C), and (E) indicate densities ×103 cells/mm2. Values in (B), (C), and (E) indicate densities in cells per square millimeter. (G) Isodensity summation map. Values represent the number of photoreceptors converging onto a ganglion cell (189 cm TL individual). (H) Diagrammatic representation of the approximate extent of the visual field (represented in light gray) and the projection of retinal areas of higher cell density onto the visual surrounds (represented in dark grays). T, temporal; V, ventral. Black circle indicates the optic nerve head. Scale bar = 1 cm.

Representative topographic distributions of photoreceptor and ganglion cell neurons in the retina of three different sizes of the shortspine spurdog, Squalus mitsukurii. The region of highest cell density (*) in both the photoreceptor and the ganglion cell layers occurs in the ventral retina. (A and B) Distribution of cells in a juvenile, 43 cm TL. * = 96,954 cells/mm2 in the photoreceptor layer (rods + cones) (A) and 2548 cells/mm2 in the ganglion cell layer (B). (C and D) Distribution of cells in a subadult, 67 cm TL. * = 95,574 cells/mm2 in the photoreceptor layer (rods + cones) (C) and 1893 cells/mm2 in the ganglion cell layer (D). (E and F) Distribution of cells in an adult, 86 cm TL. * = 94,874 cells/mm2 in the photoreceptor layer (rods + cones) (E) and 1908 cells/mm2 in the ganglion cell layer (F). Values in (A), (C), and (E) indicate densities ×103 cells/mm2. Values in (B), (C), and (E) indicate densities in cells per square millimeter. (G) Isodensity summation map. Values represent the number of photoreceptors converging onto a ganglion cell (86 cm TL individual). (H) Diagrammatic representation of the approximate extent of the visual field (represented in light gray) and the projection of retinal areas of higher cell density onto the visual surrounds (represented in dark grays). T, temporal; V, ventral. Black circle indicates the optic nerve head. Scale bar = 1 cm.

A comparison of the ganglion cell topography in four age classes in both species shows that only minor changes in the spatial distributions of neurons occur with growth (Table 1; Figs. 4 and 5). In all age groups of C. plumbeus, ganglion cell densities increase in the central retina. The location of the peak in cell density occurs dorsal of the optic nerve head in young of the year and temporal of the optic nerve head in adults. In addition, the spatial distribution of neurons shows a more distinct area in young of the year compared to adults. In all age groups of S. mitsukurii, ganglion cell densities increase in the ventral retina with a second increase in ganglion cell densities in the central retina. The position of this second peak shifts slightly with retinal growth from nasal of the optic nerve head in juveniles to dorsal of the optic nerve head in adults. These variations in the spatial distribution of retinal neurons in the ganglion cell layer do not appreciably change the region of the visual field that is sampled with improved visual ability.
The locations of the regions of highest cell density in the photoreceptor and ganglion cell layers occur in topographic register in both species (Figs. 4 and 5). The ratio of the total number of photoreceptor cells to ganglion cells indicates the degree of summation occurring across the retina. For both species, the degree of retinal summation is inversely related to the cell density counts, whereby the areae have the lowest amount of convergence. In C. plumbeus, summation ratios range from approximately 48:1 in the area to 80:1 in the peripheral retina (Fig. 4G), and in S. mitsukurii, summation ratios range from approximately 40:1 in the areae to 70:1 in the peripheral retina (Fig. 5G).
By combining the information on the visual field with the retinal topography maps and eye position in the chondrocranium, it is possible to reconstruct a schematic view of the animals’ visual field. The central area in C. plumbeus increases visual sampling of the fronto-lateral visual field (Fig. 4H). The ventral area in S. mitsukurii increases visual sampling of the dorso-frontal visual field, and the central area increases sampling of the lateral visual field (Fig. 5H).
Spatial resolving power
The ganglion cell layer defines the quantity of visual information passing from the eye to the brain for higher visual processing. It is thereby considered here that the ganglion cells are a reasonable proxy for defining the upper limit of the anatomically defined spatial resolving abilities of the eye. In C. plumbeus, the SRP of the eye increases with eye growth from 4.3 cycles/deg in young of the year to 8.9 cycles/deg in adults (Table 1). In S. mitsukurii, the change in SRP with eye growth ranges from 5.7 cycles/deg in juveniles to 7.2 cycles/deg in adults (assuming a hexagonal mosaic) (Table 1).
Large ganglion cells in the retina of C. plumbeus
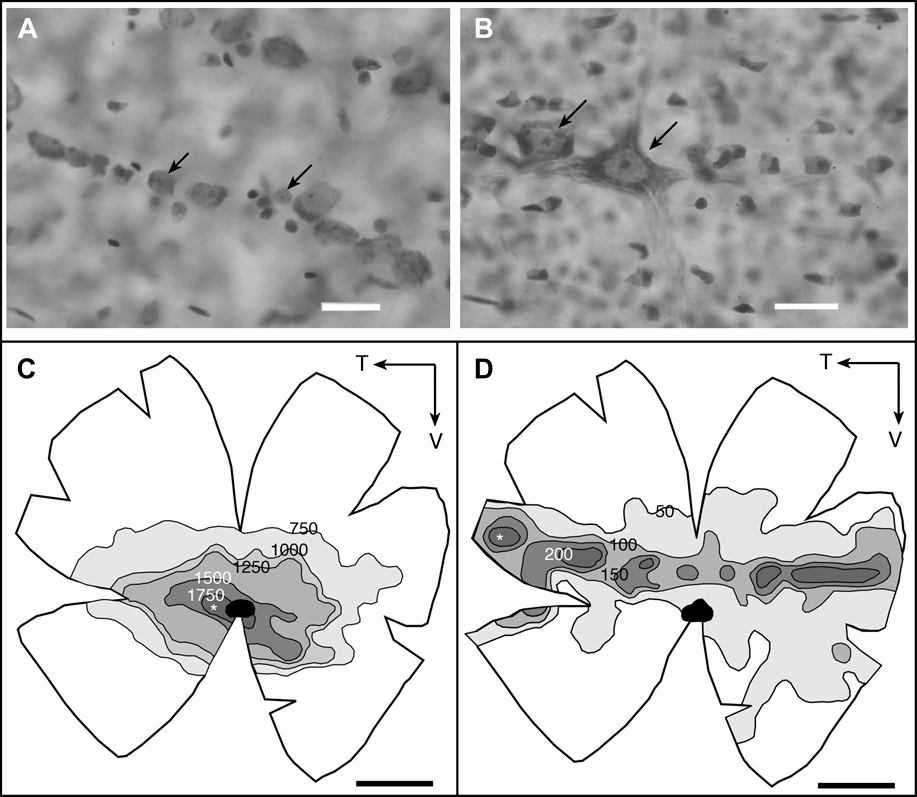
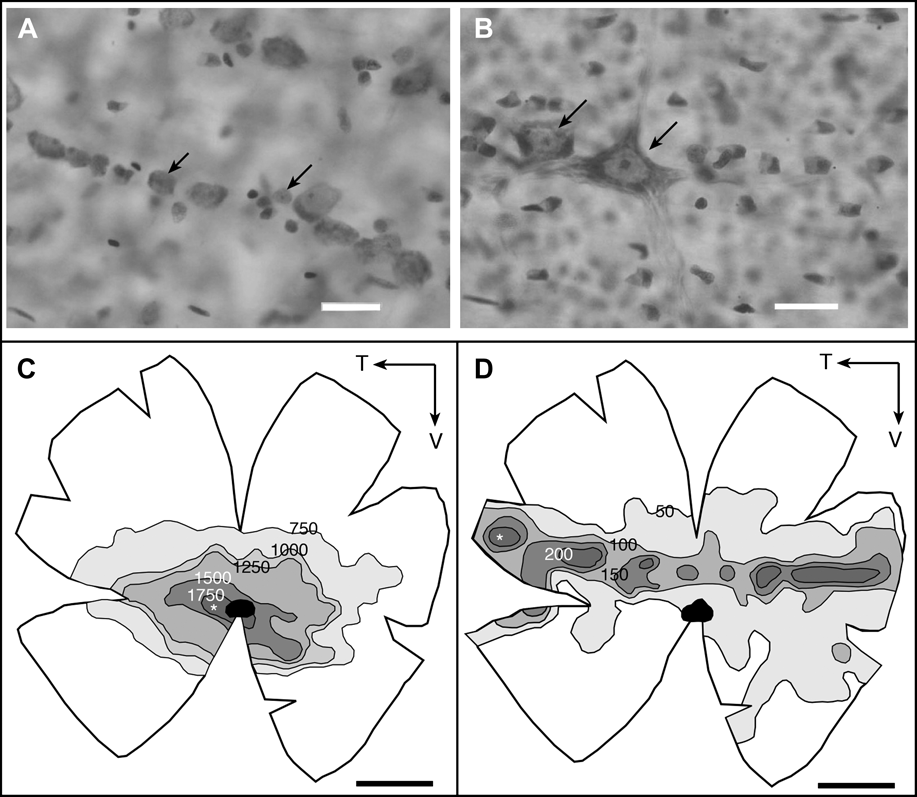
In the retina of C. plumbeus, all ganglion cell soma are distributed within distinct fascicles radiating from the optic disc with axon fasciculation becoming less ordered in the periphery. Morphologically distinct populations of ganglion cells are clearly visible in the ganglion cell layer of C. plumbeus (Fig. 6). Using the same classification criteria, however, large ganglion cells were not reliably identified in the retina of S. mitsukurii. In mature individuals of C. plumbeus, the spatial distribution of ordinary-sized ganglion cells (soma area 30–120 μm2) and large ganglion cells (soma area 120–350 μm2) is mapped separately (Fig. 6). The spatial distribution of the large-sized and ordinary-sized ganglion cells differs, and regions of peak cell density do not occur in the same retinal location. The ordinary-sized ganglion cells feature an increase in cell density in the central retina with peak cell density situated slightly temporal to the optic nerve head (peak density approximately 1774 cells/mm2 affording an SRP of 7.7 cycles/deg). The large-sized ganglion cells are less numerous (peak density approximately 350 cells/mm2 affording an SRP of 3.1 cycles/deg) than the ordinary-sized ganglion cells and feature a narrow horizontal increase in cell density, dorsal to the optic nerve head. The temporal region of high cell density in the large-sized ganglion cell population samples the frontal visual field within the area of the binocular overlap.
(A and B) Light micrographs of cells in the ganglion cell layer of Carcharhinus plumbeus H1. Arrow indicates ordinary-sized ganglion cells (soma area 30–120 μm2) (A) and large-sized ganglion cells (soma area >120 μm2) (B). Scale bar = 25 μm. (C and D) The topographical distribution of ordinary-sized ganglion cells (C) and large-sized ganglion cells (D) in C. plumbeus H1. The region of highest cell density (*) occurs in the central retina for ordinary-sized ganglion cell population and in the temporal retina for the large-sized ganglion cell population. Values indicate densities in cells per square millimeter. T, temporal; V, ventral. Black circle indicates the optic nerve head. Scale bar = 1 cm.
Discussion
Morphology of the retina
The retinal anatomy of C. plumbeus and S. mitsukurii follows the typical vertebrate plan and shows a number of characteristics typical of the elasmobranch retina (Fig. 1). Rod and cone cells are found in the photoreceptor layer of both C. plumbeus and S. mitsukurii, and the rod-to-cone ratios reported here for the areae (7:1 C. plumbeus and 14:1 S. mitsukurii) fall within the range reported in the literature for other sharks (Hart et al., Reference Hart, Lisney, Collin, Ladich, Collin, Moller and Kapoor2006). The photoreceptor layer is dominated by the long outer segments of the rod cells (approximately 37 and 44 μm in adult C. plumbeus and S. mitsukurii, respectively; Litherland, Reference Litherland2009). Among sharks, there is a trend for shallow-water species to have shorter slender rod outer segments (i.e., <30 μm long and 1.6–2.6 μm wide) (Gruber et al., Reference Gruber, Hamasaki and Bridges1963; Hamasaki & Gruber, Reference Hamasaki and Gruber1965; Kohbara et al., Reference Kohbara, Niwa and Oguri1987; Litherland & Collin, Reference Litherland and Collin2008), while elasmobranchs inhabiting waters deeper than 400 m have broader and longer rod outer segments (i.e., 45–70 μm long and 2–5 μm wide) (Denton & Nicol, Reference Denton and Nicol1964; Kohbara et al., Reference Kohbara, Niwa and Oguri1987). Long outer segments are also found in deep-water teleosts, where an increased receptor size may represent an adaptation to enhance photon capture in a dim-light habitat (Warrant, Reference Warrant2000; Fritsches et al., Reference Fritsches, Marshall and Warrant2003). A concurrent study has found that adult C. plumbeus and S. mitsukurii have a moderate optical sensitivity compared to deep-sea fish (Litherland, Reference Litherland2009). The INL in C. plumbeus and S. mitsukurii is relatively thick, and similar to other elasmobranchs, this layer is dominated by horizontal cells with large cuboidal cell bodies (Hart et al., Reference Hart, Lisney, Collin, Ladich, Collin, Moller and Kapoor2006). Large horizontal cells are also a characteristic feature in teleost species frequenting dim light (i.e., with crepuscular or nocturnal habits and/or occupying turbid or deep-water habitats) (Wagner, Reference Wagner, Douglas and Djamgoz1990). The arrangement of the horizontal cells into three tiers matches observations of retinal morphology in other sharks (Stell & Witkovsky, Reference Stell and Witkovsky1973b; Anctil & Ali, Reference Anctil and Ali1974; Gruber & Cohen, Reference Gruber and Cohen1985; Kohbara et al., Reference Kohbara, Niwa and Oguri1987; Litherland, Reference Litherland2001; Harahush et al., Reference Harahush, Hart, Green and Collin2009). In the smooth dogfish, Mustelus canis, each tier of horizontal cells differs in its morphology and interneuron connections, which implies that each tier has a different role in the processing of visual information across the retina (Stell & Witkovsky, Reference Stell and Witkovsky1973b; Malchow et al., Reference Malchow, Qian, Ripps and Dowling1990).
Retinal features do show a change with ontogenetic eye growth. In both species, the total number of photoreceptors and ganglion cells increases with eye size, and the absolute thickness of the retina decreases with eye size. A decrease in retinal thickness with eye growth is also shown in the whitetip reef shark, T. obesus (Kato, Reference Kato1962), the epaulette shark, Hemiscyllium ocellatum, and the shovelnose ray, Aptychotrema rostrata (Litherland, Reference Litherland2001). However, in the bamboo shark, Chiloscyllium punctatum, an increase in retinal thickness occurs between juveniles and adults (Harahush et al., Reference Harahush, Hart, Green and Collin2009). The reduction in retinal thickness between juveniles and adults shown here may result from the stretching of retinal tissue as the eye grows, as occurs in teleosts (Fernald, Reference Fernald1991). In teleosts, two processes are responsible for the continual growth of the retina: stretching of existing retinal tissue and cell addition (Fernald, Reference Fernald1985). In the growing retina of C. plumbeus and S. mitsukurii, the total number of ganglion cells increases, while the maximum cell density decreases. This change implies that retinal stretching dominates retinal growth in C. plumbeus and S. mitsukurii. A specific investigation of the mechanisms of retinal growth in elasmobranchs is warranted.
Retinal specializations and visual ecology
The dominant axis for high-resolution vision differs between the two species (Figs. 4 and 5). This implies that each species experiences different visual environments by virtue of exploiting different habitats and food resources. An improved region of visual ability in the latero-frontal visual field in C. plumbeus (Fig. 4) would enhance the visualization of objects, such as potential prey items, as the shark patrols throughout the water column and over the seafloor. C. plumbeus is a benthopelagic species that actively predates on teleost fishes but also consumes a variety of benthic invertebrate prey (McElroy et al., Reference McElroy, Wetherbee, Mostello, Lowe, Crow and Wass2006; Ellis & Musick, Reference Ellis and Musick2007). The even distribution of electrosensory pores over the ventral and dorsal surfaces of the head further indicates that this species is well equipped to forage in the water column as well as on the seafloor (Kajiura, Reference Kajiura2001). A comparable topographic arrangement is observed in the retina of other benthopelagic and pelagic species of shark (Litherland, Reference Litherland2001; Lisney & Collin, Reference Lisney and Collin2008). In particular, the location of peak cell densities proximal to the optic nerve head affording similar levels of SRP has been documented for other carcharhinid species (Lisney & Collin, Reference Lisney and Collin2008). When swimming, C. plumbeus can show side-to-side movements of the head, accompanied by saccades of the eye along the horizontal plane from rear to nasal (L. Litherland, pers. obs.). This eye movement may be analogous to the compensatory eye movements described for the dogfish, Squalus acanthias (Harris, Reference Harris1965), and the lemon shark, N. brevirostris (Hueter, Reference Hueter1991). In C. plumbeus, this head and eye movement could allow the region of improved resolution vision to scan across, or fixate on, objects of interest in the lateral visual field.
S. mitsukurii has two axes of improved visual ability: a ventral retinal area sampling the dorsal visual field and a central retinal area sampling the dorso-lateral visual field (Fig. 5). The difference in visual acuity between these areae equates to less than 0.25 cycles/deg in juveniles and 0.4 cycles/deg in adults. S. mitsukurii is found on or near the seafloor and preys on both benthic and mesopelagic prey typical of oceanic environments, including fish, cephalopods, and crustaceans (Wilson & Seki, Reference Wilson and Seki1994). The ventral area in S. mitsukurii projects into the dorsal region of binocular overlap, enhancing depth perception in the dorsal visual field. This ventral specialization could facilitate the detection of objects passing overhead and supports an earlier suggestion that S. mitsukurii may employ a silhouette foraging strategy (Litherland, Reference Litherland2009). Many prey items of S. mitsukurii such as Enoploteuthis squid and stomiiform and aulopiform fishes are bioluminescent or use photophores for counter-illumination camouflage (Cocker, Reference Cocker1978; Wilson & Seki, Reference Wilson and Seki1994). S. mitsukurii and another deep-sea dogfish, Centroscymnus coelolepis, both show high SRP (7.2 and 7.2–7.4 cycles/deg, respectively) in comparison to the deep-sea sharks, Galeus melastomus (3.8 cycles/deg) and Etmopterus spinax (2.8 cycles/deg) (Bozzano & Collin, Reference Bozzano and Collin2000; Bozzano, Reference Bozzano2004). This may represent a visual adaptation affording the acute detection of bioluminescent flashes in these two deep-sea species (Warrant, Reference Warrant2000). In addition, sampling of the lateral visual field with high-resolution monocular vision may assist in the visual detection of passing objects, and as S. mitsukurii often occur in large aggregations or schools, this could facilitate the detection and location of conspecifics.
In both species, the degree of convergence occurring between the photoreceptor and the ganglion cell populations increases with retinal distance from the dominant visual axis. However, even in the area of best vision, a relatively high degree of spatial summation is shown (i.e., 48:1 in C. plumbeus and 40:1 in S. mitsukurii). Among teleost fish, there is a trend for species living in brightly lit environments to have a lower degree of spatial summation (approaching a 1:1 ratio in the area of best vision) compared to those living in dimly lit environments (O’Connell, Reference O’Connell1963; Wagner, Reference Wagner1978; Collin, Reference Collin1997; Fritsches et al., Reference Fritsches, Marshall and Warrant2003). The high spatial summation shown in shark retinas in this and another study (Litherland & Collin, Reference Litherland and Collin2008) indicates that spatial pooling of visual information is an important mechanism used by sharks to increase sensitivity to light. We acknowledge that these are broad indications of the degree of convergence occurring between the photoreceptor and the ganglion cell layers, and without knowing the interneuronal wiring in the shark retina, it is not possible to reliably indicate the level of summation occurring for each photoreceptor type.
Intraspecific variations in retinal specializations and spatial resolution
The spatial distribution of retinal ganglion cells shows only minor variation with eye growth in either species, indicating that the importance placed on different regions of the visual field does not change markedly with ontogeny in C. plumbeus or S. mitsukurii. This is similar to findings from an ontogenetic analysis of photoreceptor distribution in the Atlantic stingray, Dasyatis sabina (Logiudice & Laird, Reference Logiudice and Laird1994), and a retinal topography study in the epaulette shark, H. ocellatum, and the shovelnose ray, A. rostrata (Litherland, Reference Litherland2001). The elongation of the area along the horizontal axis in adult C. plumbeus, as compared to young of the year, may permit adults to sample a broader region of the visual field with higher resolution. A previous analysis of ontogenetic changes in retinal topography in the epaulette shark, H. ocellatum, similarly found that the spatial distribution of retinal neurons formed more distinct areae in the juvenile retina compared to the adult retina (Litherland, Reference Litherland2001). The minor shifts in the spatial distributions of neurons in C. plumbeus and S. mitsukurii may occur as a result of low and differential cell addition, disproportionate amount of cell death, and/or retinal stretching during growth (Shand et al., Reference Shand, Chin, Harman, Moore and Collin2000b).
The increase in predicted SRP with eye size shown in C. plumbeus and S. mitsukurii (Table 1) can be attributed to the increase in the lens size and axial focal length that occurs with ontogenetic growth in these species (Litherland, Reference Litherland2009). A longer focal length confers a higher retinal magnification factor and also affords higher spatial resolution vision (Easter et al., Reference Easter, Johns and Baumann1977). An increase in SRP, by approximately 0.5–0.6 cycles/deg, is shown in a study of a narrow developmental sequence in the epaulette shark, H. ocellatum, and the shovelnose ray, A. rostrata (Litherland, Reference Litherland2001). The SRP doubles between young-of-the-year and adult C. plumbeus (Table 1). This large increase in SRP could provide a predatory advantage to adult C. plumbeus, which prey upon larger, more agile, and reef-associated prey items than smaller individuals (McElroy et al., Reference McElroy, Wetherbee, Mostello, Lowe, Crow and Wass2006; Ellis & Musick, Reference Ellis and Musick2007). The ability to visualize objects at greater distances, by virtue of improved resolution, would conceivably improve the detection and capture of large mobile prey.
The maximum predicted SRP calculated for C. plumbeus (8.9 cycles/deg) and S. mitsukurii (7.2 cycles/deg) falls at the higher end of the continuum recorded for elasmobranchs thus far, which range between 2 and 11 cycles/deg (Peterson & Rowe, Reference Peterson and Rowe1980; Hueter, Reference Hueter1991; Bozzano & Collin, Reference Bozzano and Collin2000; Bozzano, Reference Bozzano2004; Theiss et al., Reference Theiss, Lisney, Collin and Hart2007; Lisney & Collin, Reference Lisney and Collin2008; Litherland & Collin, Reference Litherland and Collin2008). The two elasmobranchs investigated here show similar values of predicted SRP to aquatic visual predators, such as the blue marlin, Makaira nigricans (Fritsches et al., Reference Fritsches, Marshall and Warrant2003), two species of tuna Euthynnus affinis (McPherson, Reference McPherson2004) and Thunnus maccoyii (K.A. Fritsches, unpublished), and marine mammals (Murayama et al., Reference Murayama, Somiya, Aoki and Ishii1995; Mass & Supin, Reference Mass and Supin2000). Values of predicted spatial resolution reported for elasmobranchs are, however, moderate to low compared to those of other vertebrate predators, that is, 4–27 cycles/deg in teleost fish (Collin & Pettigrew, Reference Collin and Pettigrew1989; Fritsches et al., Reference Fritsches, Marshall and Warrant2003), 70–150 cycles/deg in raptorial birds (Reymond, Reference Reymond1985, Reference Reymond1987), and 8–60 cycles/deg in mammals (Hughes, Reference Hughes and Crescitelli1977; Calderone et al., Reference Calderone, Reese and Jacobs2003). This is attributed to the high degree of spatial summation occurring within the elasmobranch retina and may reflect a shorter ecologically meaningful viewing distance underwater.
Large ganglion cells
In C. plumbeus, large-sized ganglion cells show a different spatial distribution across the retina than ordinary-sized ganglion cells (Fig. 6). Populations of morphologically different ganglion cells have been described in other elasmobranchs (Stell & Witkovsky, Reference Stell and Witkovsky1973a; Peterson & Rowe, Reference Peterson and Rowe1980; Collin, Reference Collin1988; Bozzano, Reference Bozzano2004). Different subpopulations of ganglion cells may preferentially receive input from different classes of photoreceptor cells, that is, the rod and cone cells in elasmobranchs. Subsequently, each type of ganglion cell may have a particular function. For example, one type may process color signals, while others may process shape, pattern, or movement signals (Rodieck, Reference Rodieck1973). The subpopulations of ganglion cells in C. plumbeus have similar densities and spatial arrangement to the dogfish, C. coelolepis, where large ganglion cells form a horizontal streak dorsal to the optic nerve head and ordinary-sized ganglion cells form a centro-temporal peak (Bozzano, Reference Bozzano2004). The large-sized ganglion cells in elasmobranchs show similarities to the large ganglion cells identified in teleost fish (Collin et al., Reference Collin, Hoskins and Partridge1998; Uemura et al., Reference Uemura, Somiya, Moku and Kawaguchi2000), and these cells have comparable attributes to vertebrate α-cells, which mediate motion sensitivity (Wässle et al., Reference Wässle, Peichl and Boycott1981; Collin et al., Reference Collin, Hoskins and Partridge1998; Uemura et al., Reference Uemura, Somiya, Moku and Kawaguchi2000). The topographical distribution of large ganglion cells preferentially sampling the lateral visual field of C. plumbeus may indicate increased motion sensitivity parallel to the shark’s body, which may improve the detection of visual events at the horizon.
Conclusions
The goals of the present study were to investigate the retinal specializations in C. plumbeus and S. mitsukurii and to test if any ontogenetic variation in retinal specialization occurs. We found that, although the SRP of the eye increased with eye growth, the spatial distribution of retinal neurons differed only marginally with ontogeny in both species. In addition, by comparing three populations of C. plumbeus, we have concluded that the visual specializations shown here are not specific to a population of C. plumbeus inhabiting a specific (and different visual) habitat. The different retinal topographies found in the two species reflect pronounced differences in foraging strategies and behaviors. The diversity in retinal specializations among sharks highlights that the visual demands of feeding strategies and behaviors, in addition to the symmetry of a species visual environment, influence retinal specializations in sharks just as habitat complexity, habitat illumination, and feeding strategies are the driving forces in the evolution of other vertebrate visual systems (Collin & Shand, Reference Collin, Shand, Collin and Marshall2003).
Acknowledgments
Thanks go to R.W. Brill, P. Bushnell, T. S. Daly-Engel, D. Grubbs, P. Kingsley-Smith, C. Magel, L. Pace, and captains and crew of SilverSea and PameLa J (Northern NSW, Australia) for their assistance in the field. K. Holland and R.W. Brill kindly provided laboratory facilities and logistical support at HIMB Coconut Island Research Facility and VIMS Eastern Shore Laboratory, respectively. This project was funded by a University Research Grant (School of Biomedical Sciences, The University of Queensland) in conjunction with an Australian Postgraduate Award and a Australia’s Commonwealth Scientific and Industrial Research Organisation (CSIRO) postgraduate scholarship awarded to L.L.