


1. Introduction
In the Antarctic region, precipitation is often associated with dynamic atmospheric features and processes, e.g. fronts, cyclones or mechanical uplift of moist air (Bromwich, 1988). Radiative cooling of air is probably important for condensing atmospheric water in the interior of the Antarctic ice sheet, but moisture often becomes available for precipitation in significant amounts when air flow is of a particular intensity and direction. For instance, Krinner and Genthon (1997) describe a modeled synoptic situation off the coast of East Antarctica which efficiently channels moist marine air to the remote East Antarctic interior, producing significant precipitation events at Dome c and then Vostok further inland. Precipitation observations, all hough often unreliable, do not show maxima during the warmest part of the year. Therefore, the thermodynamic, or “moisture-holding capacity”, argument (according to which warmer air holds more moisture and thus can release more precipitation) is probably not verified over the Antarctic ice sheet and surrounds on seasonal time-scales. Rather, maxima are often observed in the other seasons when the effect of large-scale atmospheric dynamics surrounding Antarctica is strongest due to maximum meridional temperature gradients (Bromwich, 1988). On the other hand, ice-core studies suggest that precipitation was lower during ice ages than today, a fact which is used to predict that Antarctic precipitation will increase in a warmer climate.
Model studies so far tend to confirm this assumption, but the dynamics and hydrology of climate models are not always well verified in the polar regions. Over Antarctica, model precipitation is generally verified against observations of annual mean mass balance with little exploration of its variability. of course, scarcity of observations and lack of confidence in existing measurements (Bromwich, 1988) is a major limitation to examining more than just the annual means. However, characterizing the variability of precipitation might help provide a better indication of the ability of climate models to resolve and reproduce the atmospheric dynamics responsible for moisture advection and deposition on Antarctica.
In this paper, we study the intra-annual variability of precipitation (more specifically, the annual mean seasonality and statistical distribution of daily precipitation) over the Antarctic region as predicted by the European Centre for Medium-range Weather Forecasts (ECMWF) short-term forecasts and as simulated by two atmospheric general circulation models (GCMs) with high spatial resolution (about 100 km) over the region of interest. The mass-balance distribution of the Antarctic ice sheet is affected by topography, which is better handled at higher resolution. in addition, high resolution can better resolve atmospheric features (e.g. cyclones) of interest for precipitation variability, To assess the impact of high resolution, we also show results from a medium-resolution version (about 300 km) of one of the GCMs. The ECMWF forecasts might be considered a Substitute for missing or unreliable observations of precipitation since, unlike climate model results, they are constrained by analyzed observations of wind, temperature and moisture in the atmosphere. This should limit the con-sequences of any ECMWF model biases and help identify real aspects of the precipitation regime. Yet it is well known that precipitation is one of the most difficult meteorological parameters to simulate and to predict, even in regions with a dense network of weather observa) ions. Il is certainly even more difficult in Antarctica.
2. Forecasts and Climate Simulations
Short-term precipitation forecasts are available from the ECMWF 15 year (1979-93) T106 (about 125 km physical resolution) re-analysis (ERA) project (Reference Gibson, Kåliberg and UppalaGibson and others, 1996). Forecasts at lead times up to 24 hours were produced twice daily. in order to benefit as much as possible from the analysis step, one is tempted to use only the 6 hour forecast. However, the model is relaxed towards analyzed values, and this constrain! is known to affect precipitation in some regions in the first few hours after forecasts start. Therefore, we discard the first 6 hours and use precipitation forecasted between hour 6 and hour 12 to obtain daily mean precipita-lion (Genthon and Krinner, in press).The re-analyses probably represent the best possible use of the archived observations and therefore the best constraint on the fort-casts. However, the resultant surface mass balance of central Antarctica is found to be low (Genthon and Krinner, in press), whereas the previous forecasts based on the operational analyses (i.e. the regular real-time ECMWF product, not the re-analyses) over 1985 91 proved to be fairly accurate (Genthon and Braun, 1995). The steady evolution of the ECMWF climate model and assimilation tools improves the forecasts globally, but may occasionally be detrimental to the analyses and predictions in certain regions. This appears to be the case for Antarctica in the re-analyscs. We thus also study the operational forecasts over thejuly 1985 June 1991 period, which are available only once a day. in addition, we analyze the precipitation simulated by two atmospheric GCMs, the Météo-France ARPÈGE model developed by the Centre National de Recherches Météorologiques (CNRM,Tiulouse), and the Centre National de la Recherche Scientifique LMD-Zoom (LMDZ) model designed by the Laboratoire de Météorologie Dynamique LMD), Paris).
ARPÈGE (version 1), a spectral model, was run by CNRM over the atmospheric model intercomparison project (AMIP) period (1979-88) at T106 resolution with a reduced grid providing approximately 125 km isotropic resolution over the polar regions (Reference Déqué and PiedelieùreDéqué and Picdelièvre, 1995). The model was also run at T42 truncation (about 300 km), a standard resolution nowadays. A previous version of the ARPÈGE model (version 0) was run at T21,T42 and T79 truncations, and Genthon and others (1994) showed flow increasing resolution dramatically improves the resultant distribution of surface mass balance over Greenland and Antarctica. ARPÈGE (version 1) actually somewhat overestimates precipitation in the polar regions, but the impact of resolut ion is nevertheless clear when comparing the results atT42 andT106 resolution.
The gridpoint LMDZ GCM was run to simulate the September 1986-August 1991 period. A variable resolution grid was used, decreasing to about 100 km over the Antarctic region (taking into account numerical filters) at the expense of the gridpoints elsewhere. This “zoom” function of the model was adapted For Antarctica and checked by Krinner and others (1997). A first study of Antarctic hydrology was performed by Krinner and Genthon (1997) who found that model performance was relatively good. Both the ARPÈGE and the LMDZ GCMs were run with prescribed (and hence non-intcractivc) observed sea-surface temperatures, sca-icc extent, and sea-ice coverage.
Time series of forecast and simulated precipitation on a common regular longitude latitude grid were extracted and processed. The test points are shown in Figure 1. The lest grid extends from the South Pole to 65°S in 5° steps, and zonally in 45° steps. The different sampling is adopted because less spatial variability is expected in the zonal direction and because the zonal spatial resolution increases as the meridians converge to the pole. Thus, we obtain 41 time series from each model, a number which we think is adequate to sample the spatial distribution of precipitation variability, while being small enough to display on one page.
Location of the 41 Antarctic sites where precipitation time series are extracted and processed. The 70° and 80° S parallels are drawn.

3. Seasonal Variability
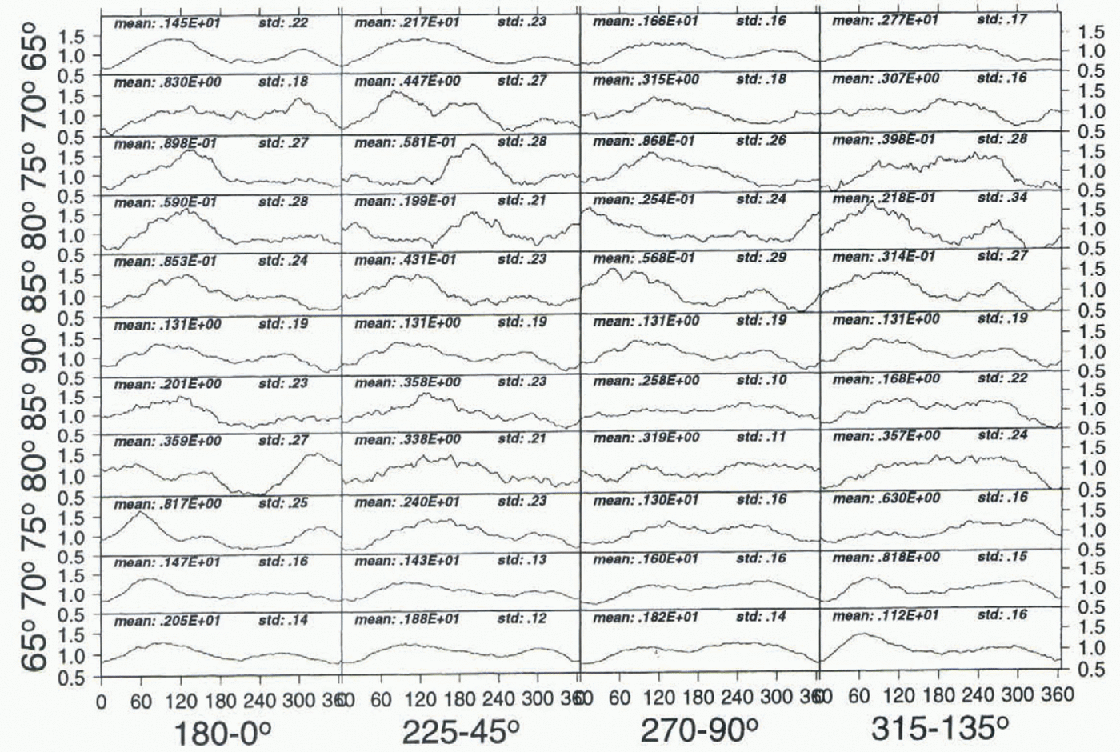
10 illustrate the spatial variability of precipitation, Figure 2 shows all 41 15 year mean seasonal cycles (smoothed with a 60day running mean) from the ERA forecasts (ERAFs). Seasonality is rather weak everywhere since maxima (minima) never reach twice (half) the annual mean precipitation. Over the oceans, whether the Atlantic, Pacific or Indian Ocean, the seasonal cycle clearly has maxima in the two equinoctial seasons, with a generally higher maximum in local fall (March). Reference Dolgin and PetrovDolgin and Petrov (1977) report data which indicate similar cycles in Antarctic stations located on the Ross and Filchncr Ice Shelves and along the Antarctic Peninsula. Reference Turner, Colwell and HarangozoTurner and others (1997) also report that the frequency of precipitation events is greatest near the equinoxes on the west coast of the Peninsula, and they anticorrelate this with the semi-annual cycle of sea-level pressure. Consequently, they associate periods of increased precipitation with times of higher frequency of synoptic-scale depressions in the area, that is, during the equinoxes. The semi-annual cycle of sea-level pressure is well known and it affects many coastal stations all around Antarctica (Reference Van LoonVan Loon, 1967). A semi-annual cycle of precipitation with maxima in equinoctial seasons may thus be expected on much of the Antarctic coast. Tn fact, the ERAFdata suggest that equinoctial maxima appear over a large fraction of Antarctica, including areas Car inland (e.g. the South Pole). This result differs from that found by Bromwich (1988) who, on the basis of the data compiled by Dolgin and Petrov (1977), suggests that over most of East Antarctica the cycle-has a broad winter maximum.
Mean 1979-93 ERAF seasonal cycle at all 41 study sites. The mean daily precipitation is smoothed with a 60 day running-mean filter. Each vertical slack of plots is a transectfrom 65° S to 65° S through the pole, e.g. the first stack is from the date-line to the Greenwich meridian (the seasonal cycle at the pole is thus repeated four times). The x axis is in days (1-1 January). The amplitude is normalized to the local annual mean precipitation. The annual mean precipitation in kgm −2 d−1 (mean) and normalized standard deviation (std) are printed for each site.
Raw observations must be corrected to account for wind-blown snow and other spurious effects, and examination of the tables presented by Dolgin and Petrov (1977) shows that the correction is sometimes much larger than the raw measurement itself. For instance, at Wilkes Station (66°15' S, 110°31'E), the annual mean corrected precipitation is 50% larger than the uncorrected precipitation, the correction contributing largely to a strong winter maximum. This is shown in Figure 3, along with the ERAF monthly precipitation at the two nearest model test sites (90° and 135° E, at 65° S). in both the corrected and uncorrected data, the observed precipitation shows peaks in spring and fall. ERAF precipitation also shows a fall peak at both test sites, but the spring peak is much weaker or non-existent. in fact, at test sites with equinoctial maxima, the fall peak often dominates the precipitation series (Fig. 2). Cyclones in the vicinity of the Antarctic coast are more intense in spring than in fall (Reference Jones and SimmondsJones and Simmonds, 1993), and sea-level pressure is consequently deeper (e.g. Krinner and others, 1997). However, the distance to the free ocean is also larger, because sea-ice break-up is much faster than sea-ice build-up and so the seasonality of precipitation may reflect the seasonality of the distance of sites from the sources of moisture.
Obtained with a different meteorological model, the 1985-91 operational analyses-based forecasts (OPAFs) also suggest that precipitation is semi-annual over a large part of the ice sheet, although marked winter maxima are somewhat more frequent than in ERAF (no figure shown). Partial disagreement between ERAFand OPAF shows that the forecasts do not provide a very reliable picture of the seasonality of Antarctic precipitation, and that their divergence from some observations is certainly not proof that these are wrong. However, both ERAFand OPAF show that the details, and in some cases even the main features, of the seasonal cycle appear to vary significantly in space. For instance, along the 80° S parallel around the pole, the timing of the absolute maximum changes from winter to spring to fall and even, at one of the eight sites, to summer (Fig. 2).
Corrected (short dashes) and uncorrected (long dashes) monthly mean precipitation at Wilkes Station, from Dolgin and Petrov (1977), and ERAF monthly mean precipitation at the two nearest sampling sites.

The forecast and simulated seasonal cycle of precipitation at ten selected sites: ERAF (a), LMDZ (b), A42 (c) and A106 (d). See Figure 2 caption for details.

Figure 4 compares precipitation at ten selected test sites from the ERAF data, the ARPÈGE (T106 and T42, henceforth A42 and A106) and LMDZ models. The models agree with the forecasts, as they all indicate weak seasonal cycle amplitudes. in general, spatial variability is as large in the climate models as in the meteorological forecasts, but the details are not well reproduced and there are sites where all three simulations strongly disagree with the forecasts and with each other. If the forecasts are broadly correct, then the ARPÈGE models do fairly well over the oceans, whereas the LMDZ model appears to fare better further south. The results at some points are sensitive to spatial resolution: A106 reveals a weak and poorly defined seasonal cycle at 75° and 85° S on the Greenwich meridian compared to A42. Occurrences of cycles with an absolute maximum in summer are very scarce in the models and the forecasts, at high latitudes (80° S and more), and, rather disturbingly, they do not show up in the same specific sector of Antarctica.
4. Statistics of Daily Precipitation
Antarctic precipitation is a mixture of episodic events and tenuous but quasi-continuous deposition, with large spatial variations in the relative contribution of the two processes. The latter process is insignificant in the coastal regions, whereas, according to Bromwich (1988), it is an important contributor to precipitation over the high Antarctic plateau. The statistics of daily precipitation should therefore vary in different regions, and they are analyzed here using data from the forecasts and the climate-model simulations. For each dataset, the daily mean precipitation p(n) is sorted into 25 bins according to the quantity of water deposited, so that the cumulated precipitation within bin i (i = 1—25) is:
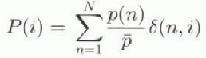
with

otherwise

N is the number of days sampled (e.g. 5479 for ERAF) and  is the annual mean daily precipitation. If the number of bins is large enough to sort all daily precipitation, including the largest events in the whole time series (which is often not the case with only 25 bins), then
 With only 25 bins, some distributions with long tails are only partially sampled, but no important information (e.g. multi-modality) is missed.
Figure 5 presents P(i) as a function of i for the ERAF data. Spatial signature is strong. Over the ocean, a large Traction of the total annual precipitation falls with a daily mean close to (from 1/2 to 4 times) the annual mean daily precipitation. in other words, precipitation tends to occur regularly every day or every few days. Precipitation tends to become more occasional inland, and there are sites where it is either insignificant or at least 4-5 times the annual mean daily mean. This picture is reasonable if precipitation is mainly associated with atmospheric dynamic processes: dynamic features (fronts, cyclones, air flows channeled toward Antarctica by synoptic systems) are scarcer inland because of the topographic barrier the ice sheet exerts. Figure 5 is thus a mixed dynamic-hydrological diagnostic, indicating where moist air masses find it more difficult to go.
Mean 1979-93 ERAF distribution of daily precipitation at all 41 study sites. Plot stacks as described in the Figure 2 capiton. There are 25 bins on the x axis. Bin 1 contains the relative cumulated precipitation which fell ai a rale of up to 0.5p, where p is the annual mean daily precipitation, bin 2, the precipitation whichfell at a rate of0.5p to p... see text in section 4. They axis is the fraction of total annual precipitation within each bin.
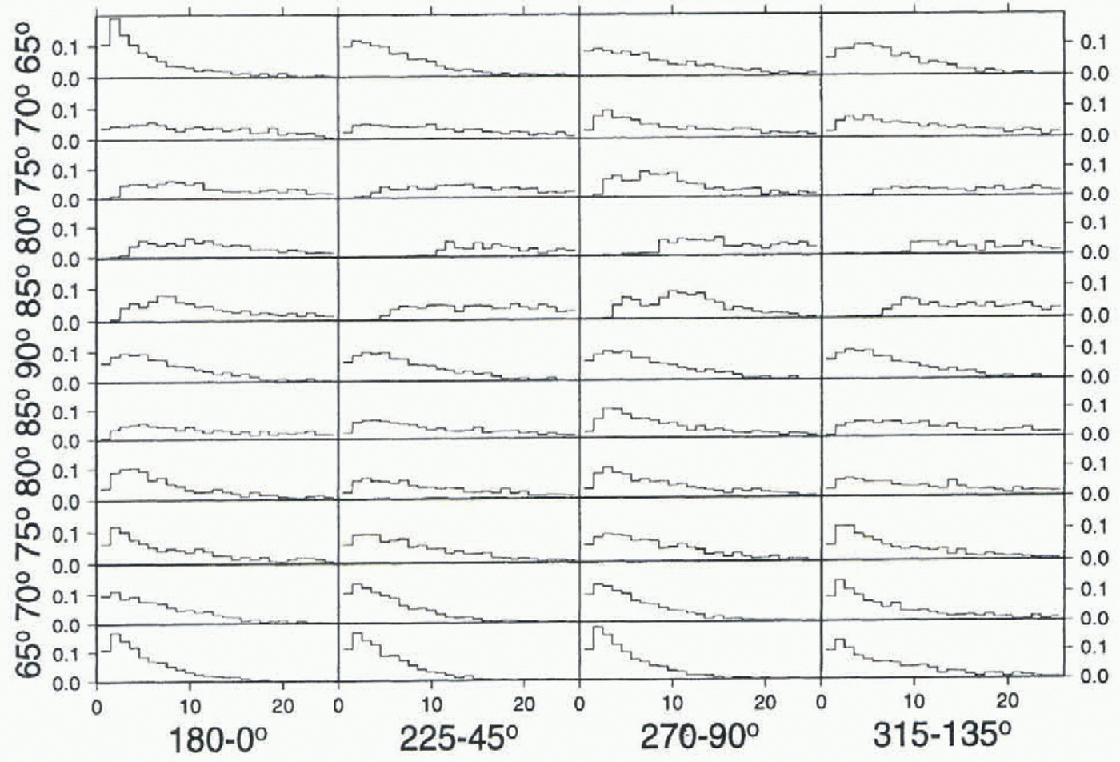
Indeed, Bromwich (1988) reports that snowfall is associated with clouds, and thus moist air, only 2% of the time at Plateau and Vostok stations on the high plateau. On the other hand, clear-sky (comparatively dry air) precipitation is very frequent and may well account for a major part of the total precipitation in some areas. The ERAFdata, while more or less properly representing the dynamic precipitation, may fail to reproduce the clear-sky one. The annual mean forecasted precipitation appears correct in the coastal regions, but it is clearly low on the East Antarctic plateau (Genthon and Krinner, in press). Also, the ECMWF meteorological model used for the re-analyses overestimates the surface temperature inversions, a bias which might affect some of the relatively slow air dynamics behind clear-sky precipitation (e.g. the sinking of free troposphere air in the cold surface layer and consequent condensation).
Again, the OPAF data over the period 1985 91 better reproduce the annual mean precipitation in the Antarctic interior (Genthon and Braun, 1995). Figure 6 shows the daily precipitation statistics on a reduced ten-site grid for the ERAFand the OPAFdata and for the A106 and LMDZ
The forecast and simulated statistics of daily precipitation at ten selected sites: ERAF (a), OPAF (b), A106 (c) and LMDZ (d)- See Figure 5 caption for details.
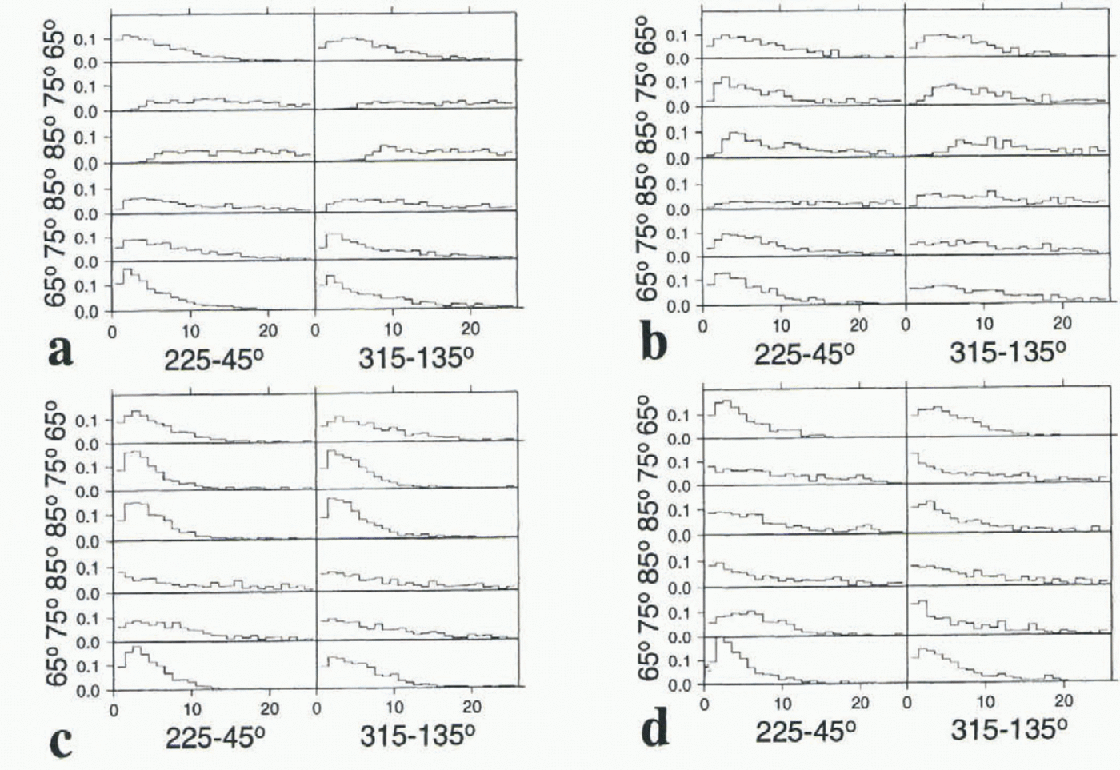
model simulations. The OPAF indeed tends to predict more frequent low-precipitation events than ERAF over the East Antarctic plateau. This is also the case for the A106 and LMDZ simulations, quite dramatically for the former model. in fact, for A106, the East Antarctic plateau is where precipitation is most frequent. Annual mean precipitation is also overestimated. Archived diagnostics are insufficient to thoroughly characterize the surface temperature inversion, but the mean surface temperature is clearly too warm, a feature likely associated with a weak inversion. Therefore, A106 and ERAF have opposite climate biases, and the precipitation characteristics they show may be oppositely wrong, with too little continuous precipitation inland for the former and too much for the latter. The OPAF and LMDZ model yield a comparatively better Antarctic climate, including mean precipitation. The daily statistics of precipitation they produce, broadly midway between those of ERAF and A106, may be closest to reality.
Dolgin and Petrov (1977) report the number of days per year with precipitation larger than 0.1mm (dpy> 0.1) at several Antarctic stations. Again, such low daily rates are hard to measure in Antarctica, and the reliability of the results presented by Dolgin and Petrov (1977) may be ques-tionable. The dpy> 0.1 ranges from 54 to 265 around the coast of Antarctica, e.g. 135 at Wilkes station. Climate simulations and forecasts suggest much higher numbers over the ocean: at 65°S near Wilkes, about 260 (ERAF), 200 (OPAF), 340 (LMDZ), 270 (A106) and 260 (A42). The modeled annual mean daily precipitation is similar to or slightly higher than the observed 1.6 mm (itself much higher than the 0.1mm threshold of dpy > 0.1), and over the ocean the spatial variations of dpy>0.1 are clearly not correlated with the spatial variations of annual mean precipitation. Thus, over the ocean and near the coast, if annual mean precipitation is sufficiently high, the dpy > 0.1 provides information on precipitation intermittence rather than quantity. The modeled dpy > 0.1 drops significantly 5° further inland (except for A42 which has the least resolved coastal geography and Antarctic topography): the ERAF and OPAF at 70 S near Wilkes have dpy > 0.1 of the order of the 135 observed. However, the modeled annual mean accumulation is much lower than at the station itself. Similar discrepancies between the models and Dolgin and Petrov's (1977) data are found elsewhere around Antarctica, so that cither the observations reported at Antarctic coastal stations are incorrect or all the models, including those which produce the forecasts, reproduce similarly poorly the coastal atmospheric dynamics associated with precipitation.
Dolgin and Petrov (1977) report dpy > 0.1 at only one interior station, Vostok at 78°27' S, 106°52' E. The count amounts to 54. Examination of the four test sites closest to Vostok station, at longitudes 90 and 135° E and latitudes 75° and 80° S, reveals that on the plateau, unlike over the ocean and the coast, dpy > 0.1 is clearly correlated with annual mean precipitation. This is not surprising since the annual mean daily precipitation at Vostok (about 0.08 mm) is below the threshold 0.1 mm. The modeled dpy > 0.1 is 96 for ERA, 102 for OPAFand 62 for LMDZ al the test site with mean precipitation closest to the observed (precipitation in A106 and A42 models is too large in the vicinity ofVostok for a meaningful analysis). For the forecasts, this is almost twice as large as reported by Dolgin and Petrov (1977). LMDZ fares fairly well. Krinner and Genthon (1997, fig. 6a) show a full series of daily precipitation for 1990 as simulated by LMDZ at Dome C (74°39'S, 124°1'E), not far from Vostok, which illustrates very well the intermittence of precipitation. Actually, the model barely simulates any day with no snow fall at all, yet about 95% of the total precipitation within a year corresponds to discrete events lasting of the order of lday. Krinner and Genthon (1997) provide a synoptic description and interpretation of one of the summer ev ents at Dome c, and they mention that Vostok is similarly affected.
5. Conclusion
Both the climate models and meteorological forecasts simulate a seasonal cycle of Antarctic precipitation that is rather weak and very variable in space. They disagree on the characteristics of the spatial distribution of seasonality. They confirm that, generally, precipitation does not peak in summer. However, precipitation does not consistently reach a maximum in winter over most of East Antarctica, and this conflicts with observation-based but somewhat unreliable estimates (Dolgin and Petrov, 1977) as presented and discussed by Bromwich (1988). Maxima at equinoxes rather than in full winter are not inconsistent with the seasonality of the atmospheric dynamics (Van Loon, 1967) potentially responsible for bringing moisture into the Antarctic region. The statistical distribution of daily precipitation is also largely spatially variable, and the simulations and forecasts again disagree as to the features of this variability. Altogether, the simulations and forecasts seem to agree on few points, other than the fact that the intra-annual variability of precipitation in Antarctica is complex and spatially v ariable. This complexity and variability, which is not necessarily larger than over regions of the same size elsewhere in the world, is somewhat unexpected given the apparent homogeneity of some parts of the Antarctic continent. The coastal-to-interior contrast is generally marked, but there are equally strong gradients in the zonal direction, even within a single quadrant of Antarctica. The rather systematic disagreement between different simulations and different forecasts as to the detailed characteristics of Antarctic precipitation variability is not very encouraging: these features are clearly hard to reproduce, and correspondingly constitute a difficult challenge for models. However, it is apparent that the sensitivity of Antarctic precipitation to climate change is not simply related to atmospheric temperature and moisture-holding-capacity changes. If changes of the atmospheric dynamics and of boundary conditions for atmospheric moisture (e.g. sea-ice cover) are also important, then the ability of models which do not simulate present intra-annual variability may be questioned if used to predict inlerannual variability and long-term trends.
The scarcity and unreliability of observations required to check the models is specific to Antarctica because of the difficulties in measuring solid, and often tenuous, precipitation in the adverse polar environment. A limited attempt has been made here to provide evidence of precipitation variability beyond the data reported by Dolgin and Petrov (1977) and Bromwich (1988). in fact, observational progress since the 10 year old compilation by Bromwich (1988) appears limited. It will be useful to compare future observations with the model results presented. Other modelers may also wish to compare their results with these. in other words, we wish to trigger some interest in the intra-annual variability of Antarctic precipitation which, if sufficiently good observations are obtained, may provide a good test of the models tentatively used to predict future climate and mass-balance changes over Antarctica.
Acknowledgements
We acknowledge support from the French Programme National d'Étude de la Dynamique du Climat, and from the European Commission (DG XII, contracts ENV4-CT95-0184 and ENV4-CT95-0124). The ERA project, which led to the ECMWF rc-analysis archive used here, is managed by R. Gibson, p. Kallbcrg and S. Uppalla at ECMWF.



