Ballot-order effects – the relationship between each candidate’s position and description on the ballot paper and the number of votes received – have been investigated extensively. They affect candidates in different ways, and have led some countries to introduce measures to remove them. The identification of alphabetic bias, the tendency for candidates to gain an advantage in votes solely by virtue of being placed at or near the top of the ballot paper, prompted the randomization of ballot orders in Australia and some American states, for example.Footnote 1 This removes alphabetic bias, but sometimes replaces it with positional bias – the candidate placed at the top of the ballot may obtain an advantage over competitors.Footnote 2 The growing practice of including candidates’ photographs on the ballot paper can lead to an association between attractiveness and vote, giving some candidates an advantage over others.Footnote 3 A third category of ballot effect stems from voters’ reactions to names on the ballot paper as information cues about the candidate’s gender, ethnic identity and/or religious affiliation.Footnote 4 How voters react to name characteristics is a more complex problem to address than alphabetic bias, and finding a workable solution is considerably more difficult to achieve.
Prior research examining aggregate local election data in Britain demonstrates alphabetic bias to the extent that there is a tendency for elected councillors to have surnames beginning with letters located towards the beginning of the alphabet.Footnote 5 Other signs of bias among locally elected representatives in Britain include the under-representation of women and people from ethnic minority groups. Analysis of the voting data demonstrates that women’s under-representation lies more with recruitment and selection processes rather than voters’ reluctance to support female candidates,Footnote 6 but it is unclear whether the under-representation of minority ethnic candidates is caused by supply-side issues or if some voters are reacting negatively towards such candidates.
Therefore, this article examines voting patterns for local authorities in Britain and tests for evidence of name sensitivity that effectively leads to discrimination among candidates. It is an over-simplification to maintain that evidence of name discrimination is equivalent to identifying discrimination per se. In the context of local council elections, it may be that some voters prefer to choose candidates that best fit the dominant demographic characteristics of the area – a case of voting for ‘people like me’. However in the broadest sense, it is entirely valid to address concerns in the wider society about the reaction of some voters to candidates based on their ethnic identity, because this affects the nature of representative democracy. Policy makers seeking greater social equality, political parties addressing problems of under-representation and citizens wishing to engage in public life should be made aware that the electorate may respond to such initiatives in different ways. Moreover, given some of the problems of measuring levels of discrimination using either survey data or experimental methods, the opportunity to develop alternative measures for exploring discriminatory behaviour should be embraced.
The article is divided into four sections. First, we examine the methods and typical problems encountered when measuring discrimination before considering more specifically the recruitment and electoral success of ethnic minority election candidates in Britain. Next, we describe the local electoral data that permit an examination of votes for more than 400,000 candidates whose names are classified into three distinct ethnic origin categories. The substantive analysis is presented in the third and fourth sections. The third section presents evidence of name discrimination in multi-member electoral districts, while the fourth section focuses on single-member electoral districts. Finally, we consider the consequences of these findings for the electoral process itself, policy makers, party selection processes and the continuing under-representation of ethnic minorities in Britain.
Measuring Discrimination
Measuring racial discrimination is problematic, either among individual subjects and their attitudes towards minorities or at the broadest societal level in terms of the causes of inequalities in the distribution of resources. Individuals may disguise their real attitudes when asked about matters pertaining to race because they are aware that some of these attitudes may be socially unacceptable. Equally, some racially defined groups in society may be disadvantaged relative to others, but the explanations for such differences are complex rather than a simple function of race. Such problems led the authors of one of the most thorough reviews of the literature on racial discrimination to conclude that, ‘[E]xamples of studies using methods that persuasively measure the presence or absence of discrimination are rare, and appropriate data for measurement are often unobtainable’.Footnote 7
Since most people do not openly admit to being prejudiced, more subtle methods have been devised to measure prejudice.Footnote 8 These measures demonstrate that prejudice may operate in ways that the person holding such views may not be conscious of them. However, there are problems in interpreting these measures. For example, two recent meta-analyses of research publications that employ the widely used Implicit Association Test (IAT) arrive at starkly different conclusions. Although one report concludes that IAT measures are superior to those that expressly ask subjects about their views on race,Footnote 9 a second arrives at a diametrically opposite view and states that the IAT provides little insight into who will discriminate against whom, and provides no more insight than explicit measures of bias.Footnote 10 Despite such disagreement, similar approaches are used for examining political attitudes and behaviour,Footnote 11 although the findings have been challenged.Footnote 12
The strength of the association between vote choice and candidate ethnic identity is another area in which disagreements are found. While some authors find little or no evidence of voter bias,Footnote 13 others identify a clear association between vote choice and attitudes towards race,Footnote 14 although it is fair to say that the mechanisms that produce those feelings of antipathy towards non-majority candidates remain far from clear.
Other studies have focused on how social norms towards racism evolve over time. Some people may hold views about race but are reluctant to voice these openly for fear of transgressing certain social norms.Footnote 15 It is suspected that the growth of right-wing parties has not always followed increasing anxiety about immigration in some European populations because of the existence of an anti-racism norm.Footnote 16 However, levels of prejudice may alter as the context changes; for example, attitudes towards certain groups may ‘harden’ if that group becomes associated with anti-social behaviour.Footnote 17 Nevertheless, Robert Ford contends that the level of discrimination in Britain is lower in the 1990s than it was in the 1980s, and that generational effects contribute to this reduction.Footnote 18
Concerns about discrimination towards ethnic minority election candidates are voiced when the under-representation of such groups is discussed. The 2011 census found that 13 per cent of the population is ‘non-white’ compared to approximately 9 per cent in 2001 and 6 per cent in 1991. Despite this growth in the population generally, only twenty-seven (4.2 per cent) members of the House of Commons elected in 2010 are of ethnic minority origin.Footnote 19 Ethnic minority candidates standing in the 2010 UK general election comprise a slightly larger proportion of candidates selected by the three largest parties: combined, the Conservative, Labour and Liberal Democrats selected 136 minority candidates from a total of 1,893 candidates (7.2 per cent), although this still represents a degree of under-selection compared to the overall population.Footnote 20 Similar levels of under-representation are encountered in other institutions. Following the 2011 elections, just two members of the 129-member Scottish parliament and two of the forty-member Assembly for Wales are of minority ethnic origin. The Greater London Assembly has four ethnic minority members out of twenty-five, but this percentage is about half the level within the capital’s general population.
The evidence regarding local government representation is similar. The 2010 census of local authority councillors in England reports that only 4 per cent of councillors are of non-white ethnic origin.Footnote 21 Estimates of the proportion of minority candidates contesting local council elections ranges from 1.7–9.4 per cent; the lower figure applies to the English shire county elections, while the upper figure refers to the London-dominated elections held in 2010.Footnote 22 There is no question, therefore, that ethnic minorities are under-represented both as candidates and among those elected to a range of political institutions.Footnote 23
While under-representation undoubtedly exists, it remains unclear what precise role voters play in this process. Non-white candidates appear to perform worse than others in parliamentary elections, although the conclusions are necessarily tentative for elections in which only a small number of such candidates stood.Footnote 24 However, as more candidates are selected the possibilities for aggregate data analysis expand. A recent examination of constituency-level data in 2010, for example, noted that in areas with relatively few non-white electors, ethnic minority candidates remain less successful in winning votes.Footnote 25 Of course, it is also possible that in the small number of constituencies containing relatively high proportions of non-white electors that support for ethnic candidates is higher than expected.Footnote 26
Two recent studies have shed a little more light on possible discrimination at the parliamentary level. One study of the 2010 general election notes that political incumbents could expect a gain of 2 percentage points in vote share when an ethnic minority candidate challenged them.Footnote 27 This advantage doubles when two minority ethnic challengers are listed on the ballot. After taking party competition into account, the authors conclude that in some close contests, an ethnic minority challenger could spell the difference between victory and defeat for an incumbent.Footnote 28 A second study of the same election examines the relationship between votes and candidates’ ethnic origins.Footnote 29 Although the study’s original survey design does not permit a comprehensive analysis of the 100+ constituencies in which a minority ethnic candidate stood in 2010, the authors conclude that white British voters are less likely to vote for Muslim candidates, although they are unable to state that this amounts to a penalty for such candidates at the ballot box.
Inevitably, exploring the impact on voting when minority ethnic candidates contest elections in Britain is hampered by the fact that relatively small numbers of candidates are contesting a limited range of elections. Moreover, the existing research focuses almost exclusively on parliamentary elections, where certain factors may come into play – not least of which is that these contests are more high profile than others, and voters may have more information about candidates than would otherwise be the case. By contrast, local elections in Britain are less visible contests in which many voters will only encounter candidates when examining the ballot paper.Footnote 30 In the context of this article, however, this lack of prior information is of no concern. It is not the candidate’s actual ethnic origin that interests us, but rather voters’ perceptions of candidate ethnicity and the effect this has on how they vote. A variety of field experiments have been used to detect discrimination,Footnote 31 but while these provide insights into the level and direction of prejudice, they are not a substitute for examining the effects in actual election data. Of course, inferring evidence of discrimination from ecological data also has risks: the fact that some classes of persons (ethnic minorities) comprise a smaller-than-expected fraction of a target group (candidates, the elected) may be explained by factors other than discrimination. Nevertheless, if aggregate data analysis demonstrates that candidates across different ethnic categories experience variable levels of electoral support, then it is important to at least measure the nature and size of that effect.
Data
A previous articleFootnote 32 highlighted the presence of alphabetic bias in local voting in Britain where candidates are listed in order of family name on the ballot paper. This article extends that analysis and considers whether voters also show preferences towards candidates according to their ethnic origin. Election candidates are not required to self-identify ethnic origin, and published sources are of little assistance in this regard. Instead, in common with research elsewhere,Footnote 33 we use computer software to identify ethnic origin, largely based on family names although first names are also used. The OriginsInfo software examines the distribution of names from published registers of electors and other sources and classifies them according to the most likely ethnic origins. The software distinguishes 200 Origins codes/categories that fall into thirteen principal groupings. Because a large majority of local election candidates are classified as having British origins, this analysis reduces the overall classification into just three categories – British (Anglo-Saxon/Celtic), European and non-European.Footnote 34 Comparing the results from this classification method with survey responses from local election candidates who self-identified ethnic origin demonstrates that the OriginsInfo software provides a reliable measure of ethnicity.Footnote 35
The software assesses the cultural origin of each candidate’s name after cross-referencing with two external files. The first of these contains 2.5 million family names and their corresponding Origins codes, while the second has 0.7 million forenames that are also classified according to ethnicity. Any conflict between the codes of the personal and family names is resolved on the basis of the confidence scores, which are held against each personal and family name on these reference files. Thus Manfred Mann would be coded as German (European in our classification) but William Mann would be coded as English (British). This is because Manfred and William are more culturally diagnostic personal names than is Mann as a family name. In order for names such as Manfred, William and Mann to be associated with a cultural grouping, a file was created containing the names of some 700 million individuals based on the names of residents of twenty different countries and sourced from a variety of different types of administrative records. The set of rules that causes a particular cultural grouping to be associated with each individual name are complex but include, for example, the relative frequency of different names in different countries (Manfred is more common in Germany than anywhere else). A further example is the close association between some forenames and surnames (people named Declan tend to have Irish surnames). The software can also parse text strings within particular names (for example, most surnames ending in -nejad are classified as of Iranian origin).
The voting data are those recorded by Plymouth University’s Elections Centre, which holds a comprehensive record of local government elections in Britain. The data examined here relate to the post-1973 reorganization of local government structure and include all elections for county/region/borough and district authorities (parish councils are not included) prior to and including the 2012 contests, with the exception of local elections in Scotland after 2003 when simple plurality voting was replaced by the single transferable vote. Over this forty-year period, some 690,047 candidates stood for election.
The number of cases is reduced for this analysis. All unopposed candidates (N=20,285) are naturally excluded. Also excluded are a relatively small number of candidates (N=3,297) where the software does not recognize and cannot classify the candidate’s name. A key step in case selection concerns district magnitude (the number of vacancies). In the case of elections in which district magnitude is greater than one (310,286 candidates involved), three further selection criteria are necessary. First, the analysis considers a subset of parties (Conservative, Labour, Liberal Democrat (including candidates that stood as Liberals and later Liberal/Social Democrat Alliance), Nationalists in Scotland and Wales, Greens, UKIP and BNP) because the dataset only lists many other smaller parties as ‘Others’. Secondly, because in these multi-member districts the main interest is in a candidate’s relative position within his/her own party’s slate of candidates, it follows that when we are unable to classify the ethnicity of a single candidate within the list we must also exclude all other candidates standing for the same party in that election. Thirdly, and for the same reason, we exclude all cases of incomplete party slates. For example, if a party fields fewer candidates than there are vacancies, this slate and these candidates are excluded from the analysis.Footnote 36 This selection process still leaves the ethnic origins and relative votes of 233,246 candidates available for analysis.
In wards that elected a single councillor (359,426 candidates contested this type of seat), case selection is contingent on the requirement to measure the change in party vote share across two consecutive elections. Here, a consecutive election takes account of the usual four-year election cycle, even in local authorities that hold more frequent elections. The requirement to compare across the electoral cycle means excluding election pairs if boundary changes were implemented, if the number of vacancies temporarily increased because a casual vacancy was filled or if a party fielded a candidate for one rather than both contests. Application of these selection criteria leaves 175,921 candidates available for analysis.
The structure of the data analysis is determined by the number of vacancies to be filled in each ward election, beginning with multi-member wards (district magnitudes are mostly two or three, but extend to twelve in some examples) before considering single-member wards. In the case of wards with multiple vacancies we consider candidates’ relative performance within their own party’s slate. After taking into consideration each candidate’s position within the party slate of candidates (located on the actual ballot paper according to alphabetical order of surnames first, second or third within a party slate of three candidates, for example), the two main variables of interest are (1) each candidate’s finishing position within the party slate after the votes are counted and (2) each candidate’s personal vote expressed as a percentage of the best vote for his/her particular party in that ward. For example, in a three-member ward featuring three Labour candidates who received 1,000, 750 and 500 votes, respectively, those candidates would have personal votes of 100 per cent, 75 per cent and 50 per cent.
In the case of single-member wards, the analysis instead compares the party change in vote share for each ward relative to the party’s mean change in vote share across all contested wards for any given election year. For example, for the Conservative Party we measure the mean change in vote share across all wards that held elections in say, both 2008 and 2012 (allowing for the four-year cycle) and then observe for each separate ward whether the change in share for the party is above, equal to or below the mean change. For each ward and for each comparable election pair we note the candidate’s ethnic origin as determined by the OriginsInfo software. In effect this equates to two sets of three-way categories (for each election a party may have a candidate who is classified as ‘British’, ‘European’ or ‘non-European’), resulting in nine possible permutations. Three of these permutations, or ‘transitions’ as we term them, would be in cases in which a British candidate at the first election is succeeded again by a British candidate (possibly the incumbent seeking re-election, of course) or a European or non-European candidate. Six similar permutations follow when a European/non-European stands in the first election. Since any alphabetic bias is likely to be rather small (although evidence shows that even in single-member ward elections contested by just two candidates there is a very slight bias towards the candidate placed at the top of the ballot),Footnote 37 the analysis considers whether relative change in vote is associated with candidates’ ethnic origin.
The research literature suggests that the nature and level of discrimination may vary over time. Accordingly, for both the multi-member and single-member analyses, the data are subsequently divided into four separate time periods. For this article these periods are largely determined by the nature of the electoral cycle and by the frequency of elections, but future research may seek to fine-tune this selection process in order to establish more precisely how voters’ behaviour in local elections is connected to changes in attitudes within the broader society.
Patterns of Voting in Multi-Member Wards
Focusing initially on complete party slates in two- and three-member wards, we consider the association between a candidate’s vote and their relative ballot position (relative to candidates standing for the same party) after controlling for ethnicity. If the performance of candidates from the same party is unaffected by such conditions, then each candidate in two-member wards has a 50 per cent chance of winning the most votes, and each candidate in three-member wards has a one-in-three chance of finishing first. We test these hypotheses using Chi-square and Student’s t statistics.
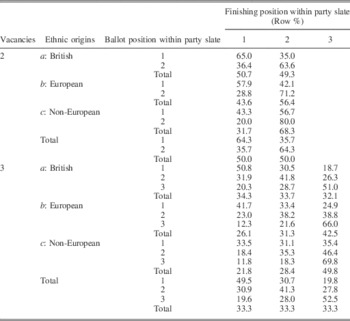
Table 1 describes both two- and three-member wards in terms of a candidate’s ballot position on the party slate, controlling for ethnic category and their finishing position within the party slate. In two-member wards, instead of a 50/50 split, we find that 64 per cent of candidates listed first finished at the top of the party’s slate. The picture changes, however, when we also control for different ethnic categories. For the most numerous category, British, 65 per cent of those listed first also finished first. For European candidates the comparable figure is 58 per cent, while for non-Europeans it is just 43 per cent. When a British candidate is listed second in party order, then in 36 per cent of cases he or she performs the best out of his or her party. However, just 29 per cent of European candidates and 20 per cent of non-Europeans finish in top position when they are listed second in party order. Three-member wards reveal a similar story. British candidates perform better than their party colleagues in the other ethnic categories, with all candidates benefitting from being listed in the top position (relatively speaking) on the ballot paper. For example, non-European candidates listed third on their party slate were the best-performing candidate in just 12 per cent of cases. All differences are statistically significant using chi-square tests.Footnote 38
Candidate Finishing Position by Ballot Position within Party Slate, Controlling for Ethnic Origin in Two- and Three-member Wards

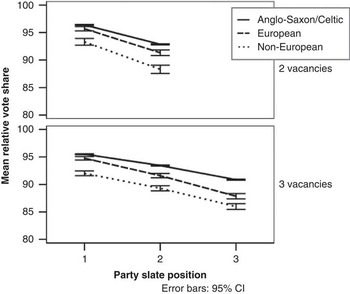
This preliminary examination of the data shows an association between finishing position and ethnic origin, but it does not fully examine the extent of that association. One method for calibrating this is to calculate each candidate’s within-party share, where each party’s top-placed candidate’s vote represents 100 per cent and other votes are some proportion of that figure – the relative vote share (Figure 1). In two-member vacancies the mean relative vote share for British candidates listed first is 96.4 per cent; for Europeans it is 95.7 per cent and for non-Europeans it is 93.3 per cent. There is more than a 3-point difference between the British and non-European candidates. In three-member wards the difference is roughly the same (95.5 per cent versus 92.0 per cent). When listed second on the party slate in two-member wards, white British candidates receive a mean relative vote share of 92.9 per cent of the maximum and Europeans obtain 91.3 per cent, while the mean value for non-European candidates falls to 88.3 per cent. This is almost a 5-percentage-point difference between British and non-European candidates from the same party when listed in the same position on the party slate. In three-member wards, British candidates listed third on their party’s slate perform better than non-European candidates in an equivalent position (93.4 per cent compared to 89.3 per cent). The slopes of these lines are roughly similar (incidentally, indicating the same degree of alphabetical bias for each of the ethnic categories, and the error bars are not overlapping), which indicates a significant differenceFootnote 39 in the vote performance among the ethnic categories.
Mean relative vote share by ballot position within party slate Note: along the horizontal axis is the ballot position within the party slate (1, 2 or 3 according to the number of vacancies). The vertical axis shows the mean relative vote share. Each line represents one of three ethnic categories, and error bars show the 95 per cent confidence interval.

Of course, this analysis does not include all of the factors that impact the level of electoral support, including incumbency, characteristics of the local authority and the level of party competition within each ward. But the advantage of such a large number of cases is that it is possible to construct interesting analyses based on particular configurations of candidate competition.
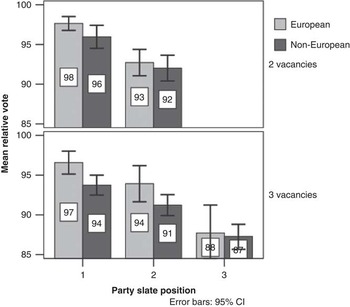
The first such example considers a subset of 690 party slates (1,743 candidates) in two- and three-member wards in which parties selected only candidates from the ‘European’ and ‘non-European’ categories. When voters can only choose between candidates with these ethnic characteristics, non-European candidates still do not perform as well as their party colleagues in terms of relative vote share (Figure 2). For example, in a three-member ward a European candidate might expect to obtain 97 per cent of relative vote share, but for a non-European that falls to 94 per cent.
Mean relative vote share by ballot position within party slate when only European and non-European candidates contest

An even stricter condition may be applied to this subset by stipulating that each party slate must contain at least one candidate from each of the two respective ethnic categories – that is, the slate cannot comprise all European or all non-European candidates. This condition reduces the number of party slates to 394 candidates, and consequently the 95 per cent confidence intervals become wider. Despite this, the pattern continues: relative vote shares reduce as we move down the party list, with non-European candidates more disadvantaged than their European colleagues.
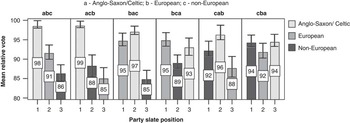
Finally, we select three-member vacancies where parties fielded a full slate of candidates drawn from all three ethnic categories. There are 1,446 candidates in 482 slates (mostly drawn from the London borough elections) in this particular subset. Figure 3 has six configurations of party list order, with British candidates labelled ‘a’, European ‘b’ and non-European ‘c’. For example, if the pattern in a ward ballot paper for a given party is a British candidate, followed by European and then a non-European candidate in the third position, then the candidate structure is ‘abc’. The first two configurations, ‘abc’ and ‘acb’, are those in which the British candidate is listed first in the party ballot order. Their mean relative vote shares are 98 and 99 per cent. When such candidates are listed in the second place (configurations 3 and 5) the mean relative vote shares are 97 and 96 per cent, and in the third place the mean values are 93 and 94 per cent. When non-Europeans appear in the first party slate position (cab, cba) their mean relative vote share is approximately 93.2 per cent – worse than British candidates appearing in the third position. When non-European candidates are in the third position on the slate (abc, bac) their mean relative shares are 86 and 85 per cent. The performance of European candidates lies somewhere between that of British and non-European candidates.
Mean relative vote share, controlling for candidate ethnic origin in three-member wards

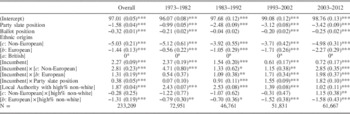
It is clear, therefore, that in addition to relative ballot position, a candidate’s vote may also be affected positively or negatively by perceived ethnic origin. An important question is whether these conditions (ballot position on party’s slate and ethnicity) are of equal importance. A linear regression model tests for this (Table 2, overall model, which examines data relating to the entire period, 1973–2012) using relative vote share as the dependent variable. The variable, ballot position on the party slate, has a significant negative impact on the dependent variable: relative vote share is expected to be lower for candidates placed lower down the party slate. Other things being equal, one position lower on the party list for a candidate results in a decline in relative vote share of 1.6 percentage points.
Linear Regression Model for Relative Vote Shares in Multi-member Wards

Note: dependent variable=relative vote share. Table entries are parameter estimates with robust standard errors in brackets. Dummy variables are named by their indicator category and shown enclosed in square brackets. ***p<0.001; **p<0.01; *p<0.05.
a Set to zero because this parameter is redundant.
Ballot position generally also has a negative impact; each step down the ballot paper corresponds to a decrease of 0.3 percentage points on the dependent variable. The ‘European’ and ‘non-European’ dummy variables provide the contrast with British candidates. European candidates should expect a 1.4-point lower relative vote than their British counterparts (equivalent to moving one position lower on the party slate), but for non-Europeans their expected relative share is fully 5 percentage points lower (almost three times the effect of party list position!).
Incumbents seeking re-election should expect an additional 2.3-point advantage to their relative vote position. There are a number of statistically significant interactions across variables within the model. For example, the interaction between incumbency and ethnic origins shows that European and non-European councillors each gain an additional 1.3 and 2.8 percentage points, respectively, in their anticipated relative vote share (perhaps once elected they become better known to local electors). Also worth noting is that the interaction of incumbency with ballot position on the party slate suggests that the negative effects of appearing lower down the ballot are to some degree overcome for incumbents.
The inclusion in the model of local authority-level information about the concentration of non-white populations from the Reference Wood, Badawood, Dykes and Slingsby2011 census is designed to test whether such areas might vote differently in respect of candidates’ ethnic origins – local authorities with relatively high non-white populations may be less likely to demonstrate name discrimination towards non-Europeans. The variable separates the top 10 per cent of local authorities with non-white populations from all other authorities.Footnote 40 The model suggests that the overall level of relative vote is higher (that is, closer to 100 for all party candidates) in authorities included in the top 10 per cent, but it does not show any further impact for non-European candidates standing in these areas. There is, however, a clear additional disadvantage for European candidates.
Of course, the general model considers electoral data over forty years, a period in which Britain has undergone a great deal of social change and experienced periodic shifts of opinion towards people of non-native ethnic origin. There is insufficient space here to examine in any great detail how such changes might have affected local election results, and therefore we only briefly consider the effects of time on voters’ responses to names on the ballot.Footnote 41 Accordingly, we sub-divide the data into four equal time periods (see Table 2).
The results of this procedure are rather promising. For example, in the 1970s the impact of a candidate having a non-European name is more than 5 percentage points. This effect reduces in size by more than 1 percentage point over the next two decades only to revert to its former size after the events of 2001 and the subsequent ‘war on terror’. This is not yet a statement about cause and effect, but it certainly suggests that the relationship should be investigated further. In the case of candidates with European names, it appears that the level of name discrimination has steadily risen over time from half of 1 percentage point to four times that in the most recent decade. In local authorities with relatively high levels of non-white residents, this name discrimination has become twice as strong over the last two decades compared to the 1973–92 period. There are also interesting differences in the effect of incumbency on European and non-European councillors. Incumbency is growing in importance for local council members with European names but for non-Europeans it is more changeable.
Finally, it appears that the effects of alphabetic bias within the party slate are becoming stronger over time, while ballot position itself remains more or less constant. There are a number of possible explanations for why position on the party slate is becoming more critical. First, it may be that a growing number of voters are unaware that they have multiple votes and are not using their full quota, which would disadvantage candidates placed lower in the order.Footnote 42 Second, in some areas the social characteristics of the electorate are changing; areas with higher ethnic populations favour non-British candidates placed towards the top of the party slate, which operates in the opposite direction to the broader tendency to favour British candidates over non-European ones. Third, given the relatively high incidence of split-ticket voting, the alphabetic ordering of candidates may play a more critical role among voters willing to spread their votes across candidates from different parties.Footnote 43
The implications of the overall model on support for candidates may be best illustrated by two hypothetical examples involving a four-member ward. In the first example the ward is located in a local authority area that has a largely white population. The candidate is a non-incumbent who is in fourth place on her party’s slate and in seventh position on the ballot paper. If the candidate is of British origin she can expect to obtain an average relative vote share of 89 per cent – 7 points lower than her colleague placed at the top of the party slate by virtue of alphabetic ordering. If her ethnic origin is European, however, she would receive a relative vote share of 87 per cent, and just 83 per cent if she is non-European. To reach parity with British candidates in this example we would need to move European candidates one position higher on the party slate and on the ballot paper (that is, third rather than fourth position on the party slate and sixth on the ballot paper). For non-Europeans, parity with British candidates is only reached when the candidate is elevated to first position on the party slate and fourth on the ballot paper.
The second example addresses the impact of both incumbency and the ethnic characteristics of the local authority population. The hypothetical ward is located within a local authority that contains a relatively high proportion of non-white residents. The incumbent appears on the seventh line of the ballot paper and his party colleagues are all listed before him. In this situation, a British incumbent might expect to receive an average 94 per cent of relative vote share. The mean relative vote share of an incumbent of European origin is lower at 93 per cent (non-European incumbents might expect 92 per cent), which is still a penalty but not as great as in the previous example. European incumbents should be placed one position closer to the top of the party’s list to reach parity: third on the slate and sixth on the ballot paper. However, the equivalent position for non-European incumbents would mean being placed second on the party’s list and fifth on the ballot paper.
Can we also estimate the effects identified here in terms of actual electoral outcomes? For the data included in the analysis (that is, only those cases/candidates for which our selection criteria were met), the mean party vote share is 34 per cent. In effect, this means that the model estimate of a 5-percentage-point difference in relative vote converts into an average 1.7-percentage-point difference in vote shares between British and non-European candidates. Within the aggregate data, the gap between the ‘lowest’ winner (for example, in a three-member ward the person who captured the third seat) and the ‘closest’ loser (the candidate finishing fourth in this example) was smaller than 1.7 percentage points in 6,872 wards. Although it is a small difference in expected vote share, the outcome in a considerable number of wards may have been affected.
Here (when considering the difference between winners and losers), we do not control for party (a winner and a loser may be from the same or different parties), and we use average figures for party shares. To make more robust estimates, we consider only the particular cases of ‘split’ wards where a party has both winners and losers, for example, two Conservative candidates stood but only one was elected. The vote-share difference between winners and losers from the same party in these split wards can be recalculated in terms of relative vote share (the difference in vote shares divided by the maximum of the party’s share). There are 3,307 party slates in 2,894 split wards where the difference in relative vote share between a loser and a winner is less than 5.03 percentage points and where, theoretically at least, the candidate selection could have impacted on the outcome. Thus, we have two methods of estimating the effect of name discrimination in multi-member wards. They suggest that some seats in 2,894–6,872 wards could have been won by a different person had the configurations of candidate ethnicity been different. Since this part of the analysis considered 123,115 seats in 47,782 wards, this means that between 6.1 per cent and 14.4 per cent of election results may have been affected by name discrimination.
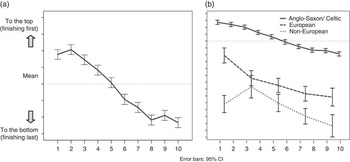
Having established that a person’s position on the ballot paper (both on the party slate and on the entire list of candidates) and their perceived ethnic origin affect the likely vote, we return to a puzzle that we first encountered when investigating alphabetic bias.Footnote 44 Although the link between a candidate’s relative success and alphabetic ordering appeared linear – the higher the position on the ballot paper, the higher the success – some deviation from linearity was evident. In particular, support for candidates with surnames in the first decile of surname ordering was less than those in the second decile. At the time, we speculated that this departure from strict linearity might be related either to the ‘second-best’ phenomenon (people’s tendency to select second- rather than first-listed choices) or might be explained by some ethnic characteristics of surnames. Figure 4a, which mostly reproduces Figure 1 from an earlier articleFootnote 45 but reverses the vertical axis used there, shows some non-linearity of association between surname deciles and candidates’ mean finishing position. However, when we consider candidate surname deciles (quintiles in the case of European and non-European candidates) separately in Figure 4b (which uses the same metric on the vertical axis as Figure 4a but shows a broader range of values), the line relating to British is now smoothed and clearly confirms that these candidates do better than their fellow European and non-European candidates. The mean finishing position of European candidates (where the linear position between finishing position and surname quintiles is also apparent) is generally better than that for non-European candidates across all surname categories. This evidence suggests that the explanation for the curve in Figure 4a relates to candidate ethnicity, and by implication to variations in the pattern of the ethnic composition across surname deciles.
Mean finishing position by surname deciles/quintiles

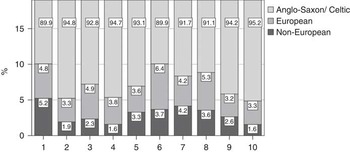
The ethnic composition for each surname decile (Figure 5) reveals that the first decile contains the lowest percentage of British candidates (89.9 per cent), a relatively high percentage of Europeans (4.8 per cent) and the highest percentage of non-Europeans (5.2 per cent). The ethnic mix of surnames lying within this first decile probably explains the presence of the non-linearity observed in Figure 4a. By contrast, the second decile has 94.8 per cent British, 3.3 per cent European and just 1.9 per cent non-Europeans. A chi square test shows that these variations in ethnic composition across surname deciles are statistically significant and the puzzle appears to have been solved. Thus far, in the case of multi-member electoral districts it appears that a candidate’s finishing position is not only related to his/her relative position within the party slate but also the ethnic characteristics of their surname. Arguably, the greater likelihood of non-European candidates appearing higher on the ballot might be mitigating some of the disadvantages associated with name discrimination.
Percentage of candidates in ethnic category by surname decile

Patterns of Voting in Single-Member Wards
In contrast with the multi-member ward cases, single-member electoral wards are now examined in terms of change in party vote share between each pair of elections after controlling for the succession of candidates (or not) according to ethnic origin name characteristics. Each ‘status’ is labelled in the same way as in the previous analysis: a=‘British’, b=‘European’ and c=‘non-European’. Accordingly, if a British councillor elected in the first election seeks re-election (or retires and is succeeded by another candidate with a name suggesting British ethnic origin) the transition is labelled ‘aa’. Should a party contest the first election with a non-European candidate but at the second election choose a ‘European’ candidate, then the transition would be labelled ‘cb’ and so on. This procedure produces nine variants of two-letter combinations.
Of course, votes for local election candidates are a function of both local and national factors. In order to eliminate the effect of this ‘national’ trend we consider relative change in vote shares, that is, the difference in each party’s ward vote share change compared to the national changeFootnote 46 in vote share for the same party. Thus, if a party’s ward vote share declines by 5 percentage points but the national vote share change for that party is −10 points, then its relative decline is +5 since it performed 5 points better (−5 minus –10 equals +5) than the national party did.
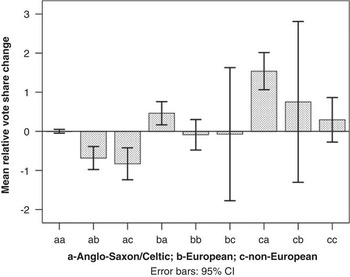
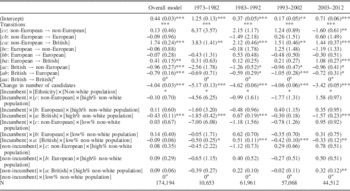
Figure 6 shows the mean of relative change in vote share for the nine possible conditions (‘aa’, ‘ab’, …, ‘cc’) in single-member wards for the period 1973–2012 (N=174,530). When British candidates participate in both elections (case ‘aa’; n=159,108) there is no difference in the ward performance compared to the national performance; this is unsurprising since the national average is calculated using mostly these types of wards. In the two other examples, a British candidate in the first election is not followed by another British candidate; thus the party’s relative vote share change declines. When ‘European’ candidates instead contest the second election (‘ab’, n=4,027), the mean relative decline is 0.7 percentage points and for non-European candidates (‘ac’, n=2,374) it is 0.8 points; both findings are statistically significant. In addition to the ‘aa’ category there are two other categories in which a party selects a British candidate to contest the second election (‘ba’, n=3,871 and ‘ca’, n=1,589). In the former there is an increase in the party’s relative vote share of 0.5 percentage points and a much larger increment of 1.5 points when a British candidate replaces a non-European candidate. For the remaining four combinations (bb, bc, cb and cc, total number of cases here is 3,561), however, mean relative change does not reach statistical significance, possibly because the number of cases is rather small.
Mean relative change in vote share controlling for candidate successions

To investigate the association between candidates’ relative success and the pattern of candidate succession in single-member wards alongside other factors, including incumbency, the number of candidates and local authority-level information about the concentration of non-white populations, we use a linear regression model with relative change in vote share as the dependent variable.
Similar to the previous analysis of multi-member cases (shown in Table 2), there is a general model for the period 1973–2012 for single-seat contests as well as four separate models that use the same time periods as before (see Table 3). The overall model clearly shows that the variable Transitions, the pattern of succession between elections, has a significant impact on the dependent variable. Two of these transitions, ‘ab’ and ‘ac’ (British to European and British to non-European) have negative impacts on vote change (approximately 1 percentage point lower) when compared to the reference category, ‘aa’. By contrast, the other two transitions, ‘ba’ and ‘ca’ (the reverse of the two transitions resulting in a negative impact on the dependent) have a positive impact on vote change: less than 1 point in the case of a European to British transition but almost 2 points if a non-European is succeeded. Other transitions, for example ‘cc’, a non-European in both elections, do not reach statistical significance. As expected, the change in the number of candidates contesting has a significant negative impact on the dependent variable. The model also shows that for incumbent British councillors seeking re-election in local authorities with a high concentration of non-whites, there is a significant negative influence on change in vote share.
Linear Regression Model for Relative Change in Vote Shares in Single-member Wards

Note: dependent variable=relative vote share. Table entries are parameter estimates with robust standard errors in brackets. Dummy variables are named by their indicator categories and shown enclosed in square brackets. ***p<0.001; **p<0.01; *p<0.05.
a Set to zero because this parameter is redundant.
The remaining four models, which focus on different time periods, contain some noteworthy features. Although the set of independent variables described as ‘transitions’ continues to be significant across the different periods, the details of this influence alter to some extent. Looking at the four transitions that are significant in the overall model (ab, ac, ba, ca), we do not see much change in the direction of influence within the four time periods. Although the size of the effect of a non-European to British transition (ca) appears to decrease over time, the size of the standard error in the 1973–82 model is very large, reflecting the rather small number of cases in that category. However, the ‘cc’ transition, not significant in the overall model, makes a significant negative impact on the dependent variable in the last decade. It also appears from the interaction term, Incumbent x British x High non-white, that councillors with British-sounding surnames in local authorities with relatively large non-white populations are incurring a 2-percentage-point penalty in terms of change in relative vote shares.
The general model in Table 3 shows that in single-member wards there is clear evidence of name discrimination. Short examples illustrate the implications of these findings. In the case of a local authority containing a relatively small proportion of non-white residents, and where the election candidates are non-incumbents, the model suggests that the consequence of a British candidate being succeeded by a non-European candidate is that the party performs half of 1 percentage point lower (−0.5) than expected. By contrast, if a European candidate is succeeded by a British one, a party will experience a boost of almost 1 percentage point (+0.9) on its expected vote share. When areas containing relatively large non-white populations are considered, the consequences of a European candidate succeeding a British one on the party’s performance is lower than average (−0.3), but replacing a European with a non-European actually improves the party’s performance (+0.7). However, the succession pattern with the largest impact remains situations in which a non-European is replaced by a British candidate. In such cases a party might expect a more than 2-percentage-point improvement (+2.3) on its expected vote. These examples demonstrate that different candidate successions for single-member wards may result in changes of more than 2 percentage points in the expected relative change of vote share.
How might these differences in candidate succession have affected actual election outcomes? For the data included in the modelling (174,194 candidates contesting 70,007 seats), we estimate that up to 3,996 seats (5.7 per cent of the total) were won/lost by parties where the gap between the winner and second-placed candidate was small enough that a different pattern of ethnic transition may have reversed the positions of these candidates.
Conclusions
The evidence clearly points to name discrimination among some voters participating in local elections in Britain. As a rough estimate, if around 4,000 to 5,000 local council seats are contested annually, then the outcomes in about 200 of these are being decided, in part, by name recognition. Some of these seats will be important for determining the balance of power on the council itself. Although the general pattern shows that candidates with names suggesting a non-European ethnic origin perform least well compared to candidates with surnames indicating a British origin, there is also evidence that other factors, including local context and time, are relevant. Indeed, in local authorities with a high proportion of non-Europeans it is candidates with European names that appear at a disadvantage. It is perhaps understandable that local election voters want ‘people like us’ to run their local council services. The initial analysis of time effects provides clues that voter choices are sensitive to external events that temporarily affect attitudes towards particular groups in society. Future research should focus on identifying the dynamics between voter responses to names on the ballot paper and local, national (and even global) events.
Local parties, particularly those selecting candidates to fight council seats, are almost certainly conscious of name recognition effects, and may even be able to calibrate them on a ward-by-ward basis. Accordingly, they will be at least considering measures that place certain types of candidates in some wards but not in others. The outcome may lead to a covert ‘zoning’ of seats that influences the types of candidates selected. Of course, local voters are free to support candidates who seem to be appropriate choices to represent their area, but should local party selection processes effectively condone name recognition effects by simply trying to mitigate them? Research involving interviews with local party members to assess how the selection processes are impacted by name recognition effects and what measures, if any, to take to accommodate them, should be undertaken to establish whether parties are affected equally.
Although it has explored ballot effects, the article has also produced a more accurate description of the impact of alphabetic order. The earlier conclusion that the relationship was almost linear should now be replaced with one that states that for British candidates, at least, the relationship is entirely linear: in local elections, candidates listed towards the top of the ballot paper perform better than those located towards the bottom. The effect increases with district magnitude and the number of candidates contesting. In light of this overwhelming evidence, it is difficult to see why Britain should not randomize ballot order for local elections. At the very least, pilot programmes – similar to those that led to the expansion of postal voting, for example – could be tested in some localities. However, changes in electoral administration are unlikely to address the issue of name discrimination.
At a broader level, these findings build on research that investigates levels of discrimination across diverse settings within British society.Footnote 47 This apparent discrimination at the ballot box reveals a preference for certain types of candidates over others based largely on names on the ballot paper. Identifying and measuring discrimination has proved to be a challenge for survey and experimental-based methods, but this application of name recognition software to local election voting has demonstrated the clear potential of aggregate data analysis.