Implications
Dairy husbandry considerably contributes to environmental pollution by producing methane (CH4) during enteric fermentation and slurry storage. The latter is also a source of nitrogen emissions. Nutritional measures are most promising in mitigating environmentally hazardous emissions, but lack of fundamental knowledge prevents their successful implementation. This study demonstrated that feeding mixed forage-concentrate diets instead of forage-only diets is not generally useful to mitigate CH4 formation, in case diets are nutritionally balanced. In addition, the type of dietary non-structural carbohydrates influences emissions from the animal and their slurry, whereas storage temperature and duration are decisive for the effect of diet on CH4.
Introduction
The most important source of anthropogenic methane (CH4), which significantly contributes to climate change, is ruminant husbandry (Steinfeld et al., Reference Steinfeld, Gerber, Wassenaar, Castel, Rosales and de Haan2006). Besides the environmental issue, enteric CH4 formation represents an energy loss to the ruminant of up to 12% of the feed energy ingested (Harper et al., Reference Harper, Denmead, Freney and Byers1999). The magnitude of enteric CH4 formation in ruminants depends on type and dietary proportions of different carbohydrates, that is, cellulose, starch, oligo-, di- and monosaccharides (Hindrichsen et al., Reference Hindrichsen, Wettstein, Machmüller, Jörg and Kreuzer2005). It is often claimed that forage-based diets generally result in considerably higher enteric CH4 formation than mixed or concentrate-based diets (e.g. Holter and Young, Reference Holter and Young1992; Johnson and Johnson, Reference Johnson and Johnson1995; Boadi et al., Reference Boadi, Wittenberg, Scott, Burton, Buckley, Small and Ominski2004). However, the IPCC (2006) assumes lower enteric CH4 only when diets for dairy cows contain more than 90% concentrate and does not differentiate between diets with lower concentrate proportions. This is confirmed by early findings of Blaxter and Wainman (Reference Blaxter and Wainman1964) testing increasing proportions of dietary maize starch in sheep. Such high-concentrate diets support the formation of propionate, which might act competitively as a hydrogen sink in the rumen compared with CH4 (Moss et al., Reference Moss, Jouany and Newbold2000). Still, CH4 is also formed from non-structural carbohydrates with the amount of CH4 depending on ruminal degradability (starch) and carbohydrate type (starch v. sugars; Hindrichsen et al., Reference Hindrichsen, Wettstein, Machmüller, Jörg and Kreuzer2005; Hindrichsen and Kreuzer, Reference Hindrichsen and Kreuzer2009).
Ruminant husbandry is further responsible for substantial CH4 emission resulting from microbial degradation of undigested nutrients present in manure, especially when stored anaerobically, for example, as slurry (Külling et al., Reference Külling, Menzi, Sutter, Lischer and Kreuzer2003; Petersen et al., Reference Petersen, Amon and Gattinger2005). In 2004, global emissions of 3.08 Mt of CH4 arose from dairy cattle manure while being stored (Steinfeld et al., Reference Steinfeld, Gerber, Wassenaar, Castel, Rosales and de Haan2006). Important manure management factors affecting CH4 formation during storage are the dry matter (DM) content of manure and its storage duration, and also the ambient temperature (Steinfeld et al., Reference Steinfeld, Gerber, Wassenaar, Castel, Rosales and de Haan2006). Thus far, few studies have followed the effects of animal diet on manure-derived CH4. A diet-dependent increase of substrate excretion for microbial fermentation (especially fibre) may substantially contribute to total CH4 emission and even partly compensate mitigation achievements in the animal. Accordingly, an increase in CH4 emission from the slurry was observed when cows were fed mixed forage-concentrate diets instead of forage-only diets (Hindrichsen et al., Reference Hindrichsen, Wettstein, Machmüller and Kreuzer2006) or diets containing more than 900 g silage/kg feed (Hashimoto et al., Reference Hashimoto, Varel and Chen1981). CH4 emissions from the slurry were found to be largely increased when enteric CH4 formation had been suppressed by lipid supplementation (Külling et al., Reference Külling, Dohme, Menzi, Sutter, Lischer and Kreuzer2002). This resulted in an almost complete compensation of the CH4 mitigation achieved in the animal.
Besides CH4, nitrogen (N) emissions (e.g. ammonia, nitrous oxide and nitrate) contribute to environmental pollution caused by ruminant husbandry. Nutritional measures affect feed N excretion within faeces and, especially, within urine and thus influence N emissions from manure (Tamminga, Reference Tamminga1992; Dijkstra et al., Reference Dijkstra, Kebreab, Mills, Pellikaan, López, Bannink and France2007). The level of N emissions mainly depends on dietary crude protein (CP) content in relation to the animal’s N requirements (Külling et al., Reference Külling, Menzi, Kröber, Neftel, Sutter, Lischer and Kreuzer2001and Reference Külling, Menzi, Sutter, Lischer and Kreuzer2003). In this context, the ruminal N use efficiency is determined by the optimal ratio of degradable carbohydrates and CP. Therefore, dietary factors such as nutrient type and degradability influencing CH4 may also affect N emissions from manure. However, N emissions from manure storage also depend highly on the manure management system (reviewed by Rotz, Reference Rotz2004), but so far data on the effects of storage temperature are scarce.
In this study, the following hypotheses were tested: (i) there is no major difference between forage-only and mixed forage-concentrate diets regarding overall CH4 formation when diets tested are isoenergetic and isonitrogenous; (ii) the type of non-structural carbohydrate influences CH4 and N emissions from animal and manure, and (iii) the expression of diet effects on slurry-CH4 and N emissions depend on slurry storage temperature and duration.
Material and methods
Dairy cow experiment
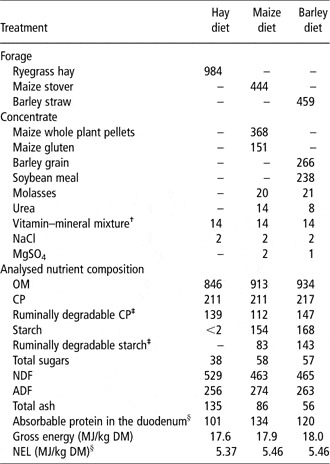
The three experimental diets (Table 1) were designed to be equivalent in terms of net energy for lactation and N. Diets were intended to be characterised, as much as possible, by one plant species each (ryegrass, maize and barley). They consisted either of forage alone (good-quality ryegrass hay; second cut, beginning of shooting) or a mixture of forage and concentrate (0.45 : 0.55; with the forage being represented by rather low-quality maize stover and barley straw). In the maize diet pellets, produced by hot air drying and made of the whole maize plant, which was harvested when being yellow ripe, were regarded as the concentrate. Maize stover was harvested when it was dead-ripe. In the barley diet, the concentrate part was composed of barley grain and soybean meal. For palatability reasons both mixed diets contained small amounts of molasses. With this diet formulation, variations in the dietary carbohydrate profile were achieved. First, easily degradable fibre or relatively undegradable fibre and starch were used. Second, within the two mixed forage-concentrate diets clear differences in starch (e.g. Yang et al., Reference Yang, Beauchemin, Farr and Rode1997) and CP (ALP, 2006) degradability in the rumen were targeted. On the basis of estimates from tabulated values (ALP, 2006), ruminal degradability of starch and CP from maize was much lower (54% and 53%, respectively) than that from the barley diet (85% and 68%; ruminal CP degradability of the ryegrass diet, 66%). However, to guarantee minimum requirements for the ruminal fibre-degrading microbes in terms of degradable protein, both diets were supplemented with urea. This diet formulation caused some differences in metabolically available protein (here shown as absorbable protein in the duodenum; ALP, 2006), but levels were always sufficiently high to avoid adverse effects on performance.
Ingredient and nutrient composition (g/kg DM) of the experimental diets as offered to the animals

OM = organic matter; DM = dry matter; NEL = net energy for lactation.
†Containing per kg: 120 g Ca, 60 g P, 50 g Mg, 45 g Na, 4 g Zn, 2 g Mn, 500 mg Cu, 20 mg I, 30 mg Se, 15 mg Co, 1.5 g vitamin E, 600 000 IU vitamin A, 60 000 IU vitamin D3.
‡Calculated from tabulated values (ALP, 2006).
§Calculated from nutrient composition as outlined in ALP (2006).
Eighteen dairy cows (11 Holstein–Friesian and seven Brown Swiss) were arranged in groups of six (three diets × two cows) in three consecutive experimental runs (n = 6 per diet). The initial body weight of the cows was 649 ± 53 kg (mean ± s.d.) and the average milk yield amounted to 16.9 ± 2.3 kg while being 215 ± 60 days in milk. The average lactation number of the dairy cows was 3.0 ± 1.9. For 1 week before the start of each experimental run the cows received hay at ad libitum access and 2 kg of crushed barley. After 6 days of gradually changing to the experimental diets, the animals were allowed to completely adapt to the diets for another 14 days. Then the 8-day sample collection period started. During the adaptation period, the cows were kept in groups and tied only for individual concentrate feeding. Furthermore, they had access to an outdoor yard with concrete floor for 1 h daily and free access to water during the entire experiment. During sampling, the cows were kept in individual tie stalls. Forage troughs were equipped with a digital electronic balance. Forage feeding started in the morning after milking at 0530 h and was provided at ad libitum access. Concentrate was given daily at 0730, 1000, 1400, 1600 and 1800 h in separate troughs. To maintain a constant forage : concentrate ratio, forage refusals were recorded and the concentrate amount offered was adapted accordingly for the following day.
The experimental procedures were the same as described in detail in Hindrichsen et al. (Reference Hindrichsen, Wettstein, Machmüller, Jörg and Kreuzer2005). Briefly, during the sampling period, urinals were attached to the vulva of the cows using Hook and Loop Fastener Tapes (IM Deutschland GmbH, Neuss, Germany) to enable quantitative collection of urine and faeces in separate containers. Urine was collected in 20-l containers with part of the urine being separately channelled into a 1-l container containing 5 M sulphuric acid to maintain a pH below 5 for later N content determination. Total amounts of urine and faeces excreted were recorded. Sub-samples were stored at −20°C, which included daily samples of faeces and urine for the subsequent manure storage experiment. For later analysis of carbon (C) and N contents, the excreta samples were pooled proportionately according to their excretion by the individual animal at the end of the sampling period. In addition, sub-samples of the pooled faeces were dried at 60°C for 72 h and ground to pass a 0.75 mm sieve for nutrient analysis. Milk yield was recorded daily and morning and evening milk samples were collected on 2 days during the sampling period. The samples were conserved with 2-bromo-2-nitroporpane-1,3-diol (Bronopol; D&F Inc., Dublin, CA, USA) and stored at 4°C for later gross nutrient compositional analysis. Additional milk samples were collected daily during the sampling period, pooled and stored at −20°C for later analysis of N content. Individual feeds were sampled always at the first day of the adaptation phase and again after 14 days, resulting in a total of 12 samples per dietary treatment. Amounts of feed refusals were recorded daily. No samples for nutrient analyses were taken, as forage and concentrate were fed separately and therefore refusals not different from the individual feed samples. Forage samples were dried at 60°C for 48 h. All feed samples were milled through a 0.75 mm sieve for later nutrient analysis.
On days 4 and 5 of each sampling period the cows were relocated into two open-circuit respiratory chambers in which airflow and concentrations of CH4 and carbon dioxide (CO2) (infrared analyzer, NGA 2000, Fisher-Rosemount, Ohio, USA) as well as oxygen (O2; Oxymat 6, Siemens AG, Karlsruhe, Germany) were continuously measured in the in- and outgoing air. Each chamber had a volume of 20 m3 and was kept at a constant temperature of 17°C. The airflow through the chambers was 34.7 m3/h and the average air pressure was 1119 hPa. The air volume leaving the chamber was continuously measured with inline electronic flow meters (Swingwirl DV 630, Flowtec AG, Reinach, Switzerland). Before the first 2-day measurement of each run the respiratory chambers were tested for their gas recoveries as described by Soliva and Hess (Reference Soliva and Hess2007). Thus, simulation measurements were done by burning propane gas and evaporating water. Recoveries found in this experiment ranged between 92% and 98%. Before starting the respiration gas analyses the gas analysers were calibrated with a reference gas (1.504% CO2, 19.50% O2, 3494 p.p.m. CH4; PanGas, Dagmersellen, Switzerland). The gaseous exchange measurements were done on two subsequent days for 22.5 h/day and animal. Urine and faeces containers were exchanged in between. The animal experiment was approved by the Cantonal Veterinary Office (ZG 46/06).
Slurry storage experiment
With regard to manure storage, two scenarios were simulated representing the average annual temperatures ‘cool’, that is, 14°C; and ‘warm’, that is, 27°C; as defined by IPCC (2006; realised: 14 ± 1.1°C and 27°C ± 0.6). A long storage duration of 15 weeks was applied as CH4 formation in slurry may continue for a number of weeks and does not evolute lineally (Külling et al., Reference Külling, Dohme, Menzi, Sutter, Lischer and Kreuzer2002; Hindrichsen et al., Reference Hindrichsen, Wettstein, Machmüller, Jörg and Kreuzer2005). In Europe, especially during winter time, slurry is actually stored over a long period of time as it may not be applied onto frozen soil. Following Hindrichsen et al. (Reference Hindrichsen, Wettstein, Machmüller, Jörg and Kreuzer2005), frozen urine and faeces samples aggregated during the dairy cow experiment were thawed and mixed according to the proportions excreted by each animal to produce 10 kg of slurry. The mixture was diluted with 5 kg water and stored in 60-l barrels. According to Hindrichsen et al. (Reference Hindrichsen, Wettstein, Machmüller, Jörg and Kreuzer2005), previously frozen excreta do not differ in CH4 formation during slurry storage from fresh excreta. Two barrels per cow were obtained for being stored at either 14°C or 27°C. This resulted in a total of 36 barrels and 12 barrels per diet. The barrels were equipped with lids (32.5 cm in diameter) to prevent drying-out of the slurry. As there was a hole in the centre of the lids (7.5 cm in diameter), a certain gas exchange with the ambient air was still possible. Weekly, each barrel was closed with a lid without a hole, linked via an air-tight connection to the open-circuit respiration chamber equipment, and gas exchange was measured for 9 h. Before and after storage, sub-samples of the slurry mixtures were taken and immediately frozen at −20°C for analysis of DM, ammonia (NH4)-N and C : N ratio after being defrosted. Part of the slurry sub-samples collected after storage were dried at 60°C for 72 h and ground to pass a 0.75 mm sieve for later fibre analysis.
Laboratory analyses
DM and total ash contents of feeds, faeces and slurry were analysed by an automatic furnace (TGA-500, Leco Corporation, St. Joseph, Michigan, USA), with organic matter (OM) being calculated as DM minus total ash. In feeds, faeces, urine, slurry and milk, N contents and in urine and slurry, C contents were determined with a C/N-analyser (Leco-Analysator Typ FP-2000, Leco Instrumente GmBH, Kircheim, Germany). Except for the milk samples, CP contents were calculated as 6.25 × N. Milk protein (calibrated as true protein, 6.38 × N), fat and lactose contents were analysed in the Bronopol-conserved milk samples via the infra-red technique (Milkosan 4000, Foss Electric, Hillerød, Denmark). Analyses of ash-corrected NDF and ADF in feeds, faeces and slurry were conducted with the Fibertec System M (Tecator, 1020 Hot Extraction, Höganäs, Sweden). For NDF, α-amylase but no sodium sulphite was added as suggested by Van Soest et al. (Reference Van Soest, Robertson and Lewis1991). The starch contents of the feeds were determined polarimetrically (VDLUFA, 1976; model 343, Perkin Elmer, Massachusetts, USA). Samples subjected to analysis of total sugar contents were first extracted with hot ethanol (80%), followed by filtration and colorimetric analysis using an orcin/sulphuric acid reagent and an autoanalyser (Cartridge Gesamtzucker Autoanalyzer II, Bran–Luebbe, Norderstedt, Germany). The energy contents of feeds and faeces were determined using a calorimeter (Calorimeter C7000, IKA®-Werke, IG Instrumenten-Gesellschaft AG, Zurich, Switzerland). The concentrations of NH4-N of thawed slurry samples were determined by MgO distillation (Distillation unit 323, Büchi, Flawil, Switzerland) as described by Amberger et al. (Reference Amberger, Vilsmeier and Guster1982).
Calculations and statistical evaluation
Energy turnover in the animal was calculated using the standard equations listed in Hindrichsen et al. (Reference Hindrichsen, Wettstein, Machmüller and Kreuzer2006) comprising the energy content of CH4 and urine (calculated from urine C and N contents), heat energy (from gas exchange; corrected for fermentation energy; Chwalibog et al., Reference Chwalibog, Jensen and Thorbeck1996) and milk energy (from its constituents). Digestion in the animal and degradation in the slurry during storage were calculated from the initial amounts (ingested or present) and those recovered in faeces or stored slurry. For the calculations of N and CH4 emitted from urine and faeces as excreted per cow and per day, it was assumed that the slurry was stored for the respective period stated (7 or 15 weeks). Amounts of CH4 emitted during the 9 h of measurements were extrapolated by calculating the emissions for the whole week.
Data were subjected to analysis of variance applying the Mixed procedure of SAS (version 9.1, SAS Institute Inc., Cary, NC, USA). Replicates (n = 6, but only five in the maize diet due to a lack of sufficient amounts of maize stover) were always represented by the individual cows in both the dairy experiment and the slurry storage experiment.
The model used to analyse the data set of the dairy cow experiment was as follows:

where Di = experimental run, Bj = breed, Rk = dietary treatment (all considered as fixed effects), With regard to milk yield and composition, the respective baseline data from the pre-experimental week were included as covariates in the model used, and least square means (LSmeans) are presented in the respective table.
Data sets of the slurry storage experiment, were conducted separately for each storage temperature using the following model:

where Rk = dietary treatment was considered as fixed effects. In the model Di = experimental run and Bj = breed in the dairy cow experiment were included as error controls.
In the slurry storage experiment, in addition, an analysis of variance across both runs was performed to evaluate storage temperature effects as follows:

where Rk = dietary treatment, Kl = storage temperature and (RK)kl = interaction between diet and storage temperature were considered as fixed effects, and Di = run in the dairy cow experiment and Bj = breed served as error controls. In addition, with regard to CH4 emissions, (RL)km = interactions between diet and Lm = storage period (either 7 or 15 weeks) as wells as (RKL)klm were tested in the model:

As the two runs were not carried out simultaneously, conclusions drawn from this comparison are limited.
Multiple comparisons among means were always carried out using Tukey’s method. As there were only few significant interactions, these are given in the text but not presented in the tables.
Results
Diet-type effects in dairy cows
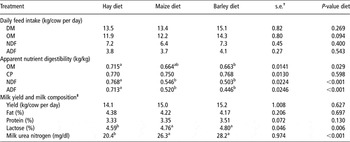
Daily DM and nutrient intake by the cows did not differ (P > 0.09) among the diets (Table 2). OM digestibility was higher (P < 0.05) with the hay diet than with the barley diet. The digestibility of NDF and ADF was higher (P < 0.05) in the forage-only diet than in both mixed diets, whereas the apparent CP digestibility did not differ (P > 0.1) among diets. No differences (P > 0.1) were observed between the treatments in daily milk yield and milk fat content and milk protein. Contents of milk lactose were lowest with the hay diet (P < 0.05).
Feed intake, digestibility and performance of the cows

DM = dry matter; OM = organic matter.
a,bMeans in the same row with different superscripts differ significantly (P < 0.05).
†Means by treatment (n = 6).
‡LSMeans; data from the pre-experimental week were included as covariates in the model for milk composition.
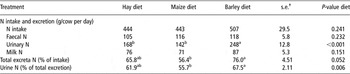
Daily N intake by the animals and N excretion with faeces and milk did not differ (P > 0.1) among the diets (Table 3). However, urinary N excretion was higher (P < 0.05) with the barley diet than with the maize (+43%) and the hay diets (+32%). Accordingly, total N losses with excreta and the proportion of urine N of total N excretion were increased with the barley diet (P < 0.05 compared with the maize diet).
Nitrogen excretion of the cows

a,bMeans in the same row with different superscripts differ significantly (P < 0.05).
†Means by treatment (n = 6).
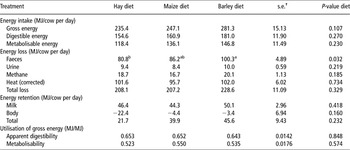
Intake of gross energy, digestible energy and metabolisable energy did not differ (P > 0.1) across the three diets (Table 4). Faecal energy losses were highest with the barley diet (P < 0.05 compared with the hay diet). No other form of energy loss was significantly affected by diet type. The differences found in faecal energy losses were only numerically recovered in total energy losses. Energy retention in milk and body, and gross energy utilisation did not differ (P > 0.1) between the treatments.
Energy balance of the cows

a,bMeans in the same row with different superscripts differ significantly (P < 0.05).
†Means by treatment (n = 6).
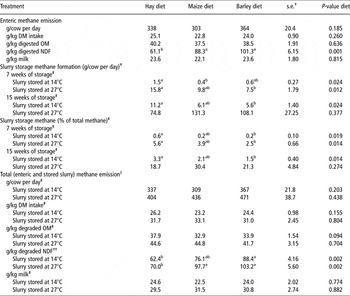
The average CH4 emission from the cows’ digestive tracts (enteric fermentation) was similar among diets and averaged at 330 g/cow per day, 24 g/kg DM intake, 39 g/kg digested OM and 23 g/kg milk (Table 5). However, the amount of CH4 emitted in relation to the digested NDF was lowest (P < 0.05) with the hay diet (−31% and −40% compared with the maize and the barley diet, respectively).
Methane formation from the animals’ enteric fermentation and their slurry when storage is performed for 7 and 15 weeks

DM = dry matter; OM = organic matter.
a,bMeans in the same row with different superscripts differ significantly (P < 0.05).
† Means by treatment (n = 6).
¥Amount of methane produced from the quantity of slurry produced daily by an individual dairy cow. Difference between storage duration is significant at P < 0.001.
§Slurries stored for 15 weeks.
‡Temperature difference is significant at P < 0.001.
††Temperature difference is significant at P < 0.05.
Diet type and storage temperature effects on slurry composition and emissions from slurry
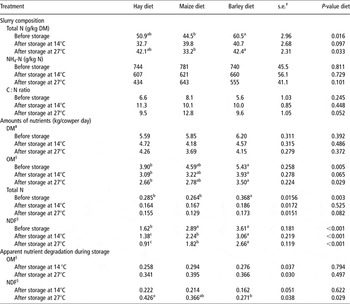
The composition of the different slurry types obtained from individual cows fed either with hay-only or with the two mixed forage-concentrate diets differed to some extent (Table 6). The N content in fresh slurry before being stored was lowest in the maize-based slurry (P < 0.05 relative to the barley-based slurry). After 15 weeks of storage at 14°C, no diet effects on slurry N content remained, but slurry N was still low in the maize-based slurry when stored at 27°C. No clear differences (P > 0.1) among treatments were found in NH4-N proportions of total slurry N and in C : N ratio. One exception was found for slurry stored at 27°C in which there was a trend (P = 0.05) to a higher ratio with the maize diet compared with other diets. The storage of slurry reduced N contents and NH4-N proportions, and increased the C : N ratio. However, these changes were not affected (P > 0.1) by storage temperature except for a trend towards a higher decrease in NH4-N at 27°C (P = 0.08). In relation to the amount of nutrients excreted daily by the cows the amounts of slurry DM were not different (P > 0.1). They averaged at 5.9 kg/cow per day, with a higher (P = 0.08) DM amount being recovered after storage when the temperature had been 14°C compared to 27°C. Slurry OM amounts per cow per day were low with the hay-based diet (P < 0.05 compared with the barley-based diet) both before and after storage. The OM amounts in the maize-based slurry were intermediate. This diet effect was found to be temperature-independent, but OM losses during storage were higher (P = 0.07) with increasing storage temperature across all diets. Before storage the amount of N in slurry per cow per day differed among diets (highest with the barley diet; P < 0.05). After storage this diet difference was less clear (P = 0.08 in the slurry stored at 27°C). The amount of NDF was lowest (P < 0.05) in the slurry from the hay-fed cows both before and after storage. The storage process generated differences (P < 0.05) between the maize and the barley diet with more NDF being present in the barley-based slurry, a difference not being apparent before storage. The residual amounts of NDF present in slurry per cow per day after storage was higher at 14°C compared to 27°C. There were no diet effects on apparent OM degradation during slurry storage, whereas at 27°C, NDF degradation was higher (P < 0.05) in the slurry from the hay diet than that from the barley diet. Values obtained with the maize-based slurry were intermediate. The degradation of both OM and NDF was promoted (P < 0.05) by a higher slurry storage temperature.
Composition of and nutrient amounts as well as their degradation in the slurries before and after storage for 15 weeks

DM = dry matter; OM = organic matter.
a,bMeans in the same row with different superscripts differ significantly (P < 0.05).
†Means by treatment (n = 6).
‡Temperature difference is significant at P = 0.08.
§Temperature difference is significant at P < 0.05.
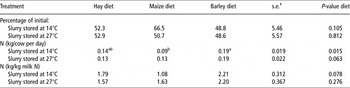
Neither proportionate N losses from the different slurry types nor the N losses related to milk N clearly differed (P > 0.05) between dietary treatments, except for the trend (P = 0.08) of particularly low N emissions per kg of milk N found with the maize diet at low storage temperature. An influence of diet type (P < 0.05) was found in the overall slurry N losses per cow per day after 15 weeks of storage at 14°C, which was only numerical at 27°C (P = 0.06). N loss from maize slurry was lower by 54% compared to barley slurry, with the N losses from the hay-based slurry being intermediate. There was no effect (P > 0.1) of storage temperature on N losses from slurry stored for 15 weeks.
With regard to slurry-CH4 formation per cow per day, a clear (P < 0.001) influence of storage temperature and duration of storage as well as a temperature × storage duration interaction became obvious. Emissions largely increased when slurry was stored for 15 weeks instead of 7 weeks (up to 15 times higher emissions; Table 5). After 7 weeks, slurry stored at 14°C emitted on average 94% less CH4 than slurry stored at 27°C. There were various diet effects on slurry-CH4 emissions, but these varied with storage conditions due to a diet × temperature interaction (P < 0.05) occurring at 7 weeks of storage. Emissions were highest (P < 0.05) with the hay diet after 7 weeks and 15 weeks of storage, the latter, however, only when stored at 14°C. This effect was reversed in slurry stored for 15 weeks at 27°C. Diet differences in slurry-CH4 were similar when expressed per cow and per day, or in relation to total CH4 emission (Table 7).
Nitrogen losses from the slurries during 15 weeks of storage

a,bMeans in the same row with different superscripts differ significantly (P < 0.05).
†Means by treatment (n = 6).
No diet effects (P > 0.1) were found with regard to the total amount of CH4 produced from both sources of enteric fermentation and slurry at either storage temperature with the exception of CH4 related to degraded NDF. The latter was lowest with the hay treatment (P < 0.05 for both 14°C and 27°C, except when comparing hay and maize diet at 14°C). Generally, more total CH4 was emitted at higher slurry storage temperature. The proportion of the slurry-CH4 in percentage of total CH4 produced per cow and per day, both from enteric fermentation and from slurry stored over 15 weeks, was low when slurry was stored at 14°C. At a storage temperature of 27°C about 30% of total CH4 was derived from slurry when the cows were fed with the maize diet. Slurry-CH4 accounted for 21% and for 19% of total CH4 when the cows were fed with the barley and the hay diets, respectively.
Discussion
In this study, emissions of CH4 (enteric and from slurry) and N (from slurry) were investigated in isoenergetic diets under varying forage : concentrate ratio and assumed degradability of starch and protein. This is an approach not yet followed as far as is known to the authors. Late-lactating cows with limited milk yield were used to enable the design of three equivalent diets.
Effect of diet type on performance, digestibility and metabolic energy utilisation of the cows
Few differences were expected in the animals’ performance and energy utilisation due to the isoenergetic design of the diets. This was actually the case although DM intake had not been totally equal between the cows. Absorbable protein in the duodenum, as a measure of metabolic protein supply, obviously was not limited, as levels differed among diets without consequence. Differences were, however, found in the digestibility of OM and fibre, though not in gross energy utilisation. The ryegrass hay diet was superior to the two mixed forage-concentrate diets, especially when regarding fibre digestibility. The reasons for this were that the forage part of the mixed diets consisted of stover or straw, which are in general characterised by high lignification and therefore lower digestibility. Energy balances of the cows were not significantly affected by diet type. However, energy losses with the faeces were highest with the barley diet. This was due to the numerical higher gross energy intake with this diet and the still unchanged energy digestibility, probably depending on the high degree of lignification in barley straw (cf. Susmel and Stefanon, Reference Susmel and Stefanon1993).
Effect of diet type on composition of, and nutrient degradation in, the corresponding slurries
An optimal C : N ratio is important for slurry microbes to efficiently degrade OM and is also an indicator for manure stability and N availability. The C : N ratios found in fresh slurry in this study were rather low compared with other studies (e.g. Külling et al., Reference Külling, Menzi, Kröber, Neftel, Sutter, Lischer and Kreuzer2001 and Reference Külling, Dohme, Menzi, Sutter, Lischer and Kreuzer2002; Hindrichsen et al., Reference Hindrichsen, Wettstein, Machmüller and Kreuzer2006) due to notably high slurry-N contents. However, similar C : N ratios were found in the study of Külling et al. (Reference Külling, Menzi, Sutter, Lischer and Kreuzer2003). The diet dependency of the C : N ratio of the slurry was demonstrated by Van der Stelt et al. (Reference Van der Stelt, Van Vliet, Reijs, Temminghoff and Van Riemsdijk2008) who found the ratio in the slurry of non-lactating dairy cows ranging from 5 to 6 when the diets had high CP but low energy contents. In contrast, low CP diets high in energy provoked C : N ratios from 7 to 8.3, similar to the ratios found with the maize diet in this study. This specific characteristic of manure N and C in this study was the result of the high dietary CP content in combination with the modest milk production of the animals. The relatively low milk yield contributed to a less efficient N retention in the body at a quite unchanged excretion of OM (carbon) in comparison with cows with a high milk yield. Generally, dairy cows with a moderate milk yield excrete the entire dietary N amount exceeding the animal’s requirements with the urine (Castillo et al., Reference Castillo, Kebreab, Beever, Barbi, Sutton, Kirby and France2001) resulting in a high slurry-N content. On the farm, the proportion of cows with a moderate rather than a high milk yield is assumed to be, as a result of the animals’ normal reproductive cycle, rather large than the annual average. Therefore, in combination with an improper dietary CP, a high excretion of urinary N and thus, a low C : N ratio in slurry occurs. Diet had no effect on the NH4-N proportion of total slurry-N. In addition to being diet-independent, slurry NH4-N was much higher in this study compared with other studies (Amberger et al., Reference Amberger, Vilsmeier and Guster1982; Hindrichsen et al., Reference Hindrichsen, Wettstein, Machmüller and Kreuzer2006), but again similar to Külling et al. (Reference Külling, Menzi, Sutter, Lischer and Kreuzer2003). Excessive N is excreted by the animal in the form of urea. In the slurry, urea is rapidly degraded to NH4 when it comes in contact with the enzyme urease produced by faecal microbes (Van der Stelt et al., Reference Van der Stelt, Van Vliet, Reijs, Temminghoff and Van Riemsdijk2008). These rather high slurry NH4-N concentrations, which followed the trend in total N, also resulted from the excretion of the excess amount of dietary CP.
The amount of nutrients present in the urine and faeces excreted daily by the animals are the result of intake, nutrient composition and digestibility of the individual diets. Accordingly, OM, NDF and total N amounts excreted were highest with the barley diet and therefore, in the barley-derived slurry, while being lowest with the hay diet (significant for NDF). It could have been expected that the fibre fraction leaving the animals’ digestive tract would be relatively hard to degrade by the microbes present in the slurry. This was obviously not the case with the hay diet as the degradability of the NDF in the slurry, although being present in rather small proportions, was still higher than in the other diets. The increase in nutrient degradation in slurry with higher storage temperature was expected as a storage temperature of 27°C compared with 14°C is closer to the optimal growth temperature for bacteria of about 37°C (Van der Stelt et al. Reference Van der Stelt, Temminghoff, Van Vlieta and Van Riemsdijka2007).
Diet type and temperature effects on N losses during slurry storage
Some of the diet-related differences in slurry-N losses can partly be explained by differences in N intake, although these were not significant. The small increase in DM intake also resulted in a numerically higher N intake with the barley diet. As is typical for ruminants (Castillo et al., Reference Castillo, Kebreab, Beever, Barbi, Sutton, Kirby and France2001), changes in N intake at unchanged N utilisation resulted in no concomitant variations in faecal N losses, thus influencing the urinary N proportion of total N excretion as described above. Still it seems that the major effect of the barley diet, in comparison with the maize diet, on urinary N loss has other reasons. Consistent with the present findings, Kebreab et al. (Reference Kebreab, France, Beever and Castillo2001) observed that diet supplementation with barley resulted in higher urinary N levels than with maize. This indicates that ruminal N utilisation by the microbes was affected by feeding barley instead of maize as there is a quantitative relationship between urinary N excretion and ruminal N losses (Van Vuuren et al., Reference Van Vuuren, Van Der Koelen, Valk and De Visser1993). The efficiency of N utilisation is high when ruminally available feed-N matches the N requirement of the ruminal microbes (Baker et al., Reference Baker, Ferguson and Chalupa1995). This is further determined by the amount of fermentable OM as the second substrate required by these microbes, which is a function of the degradability of the dietary energy sources (Kebreab et al., Reference Kebreab, France, Beever and Castillo2001). Considering all these factors, the higher urinary N losses with barley compared with maize can be explained by the higher N intake, the higher ruminal CP degradability and the likely lower OM digestibility of the barley straw v. the maize stover, which overrode the higher amount of fermentable OM provided by the higher rumen degradability of the barley starch. The hay diet was intermediate to the two mixed diets in case of the N losses, although the energy intake of the animals feeding on hay was numerically lower. However, OM (especially fibre) degradability was slightly higher with the hay than with the other diets, thus improving ruminal N utilisation.
Urinary N is converted to NH4 much more easily in the slurry than in faecal N, and thus subject to rapid emission (e.g. Van Horn et al., Reference Van Horn, Newton and Kunkle1996; Kröber et al., Reference Kröber, Külling, Menzi, Sutter and Kreuzer2000) either as ammonia or nitrous oxide volatilisation or nitrate leaching (Jarvis, Reference Jarvis1993). This relationship between urinary N, total NH4-N in slurry DM before storage and N losses from slurry during storage was also obvious from the present results (significant at the lower slurry storage temperature). The loss of N during slurry storage for 15 weeks in this study was higher than that found in other studies, in which slurry was stored for 14 weeks (Külling et al., Reference Külling, Dohme, Menzi, Sutter, Lischer and Kreuzer2002; Hindrichsen et al., Reference Hindrichsen, Wettstein, Machmüller and Kreuzer2006) or 7 weeks (Külling et al. (Reference Külling, Menzi, Sutter, Lischer and Kreuzer2003). However, in these studies, lesser N had been excreted by the animals and accordingly, the amount of N present in the slurry before storage was smaller than in this study. In agreement with these studies, slurry total N and proportion of NH4-N decreased over time. Concomitantly, the C : N ratio increased despite a substantial OM degradation taking place.
Unexpectedly, no storage temperature effect on N losses during 15 weeks of slurry storage was observed despite a much higher OM degradation that occurred at higher storage temperature. The trend to lower NH4-N at a storage temperature of 27°C instead of 14°C (temperature effect, P = 0.08) was not substantiated by corresponding differences in N losses, either. Sommer et al. (Reference Sommer, Petersen, Sørensen, Poulsen and Møller2007) stored cattle slurry at 10°C, 15°C and 20°C for 16, 20 and 31 weeks, respectively. The largest decrease in organic N was found at 20°C. Furthermore, they observed the largest reduction in organic slurry N during the initial phase of storage, independent of the temperature. The IPCC (2006) also assumes that the fraction of organic N, which is mineralised, is more dependent on time than on temperature. In this study, because of missing interactions between diet type and storage temperature with regard to N losses, a prediction of diet effects seems justified for any given storage temperature.
Diet type and manure management effects on enteric and slurry methanogenesis
The different diet types did not affect the total amount of enteric CH4 produced daily. The numerical differences in the amount of enteric CH4 produced might have partially resulted from the slight differences in daily DM intake. This is in disagreement with the lower CH4 emissions from concentrate-fed cattle, which were repeatedly reported. However, these studies have often investigated high-concentrate diets v. forage-based diets of different energetic value using rather high and not relatively low producing animals. Hindrichsen et al. (Reference Hindrichsen, Wettstein, Machmüller and Kreuzer2006) compared forage-only with mixed forage-concentrate (1 : 1) diets and found only a small difference in enteric methanogenesis, too. Nevertheless, in this study diet-type effects were found when relating enteric CH4 to NDF digested whereby the hay diet resulting in the lowest emissions. On a first glance, this might be unexpected as it is assumed that most of the CH4 is produced from the end-products of fibre fermentation. Obviously, the cows in this study produced similar amounts of CH4 when the carbohydrates consisted of well-digestible fibre or relatively poorly digestible fibre and non-structural carbohydrates. Higher proportions of concentrate in the diet are known to decrease ruminal pH and, as a consequence, lower ruminal CH4 formation. In this study, the use of mixed diets containing considerable proportions of poor quality forages (stover and straw) might have prevented this decline in ruminal pH, especially since the concentrate was fed to the animals in several portions over the day. It has been shown before that the expression of specific carbohydrate effects requires a drop in ruminal pH (Hindrichsen and Kreuzer, Reference Hindrichsen and Kreuzer2009). Further, it was shown that starch-based diets can indeed have a rather high methanogenic potential when related to DM intake (Hindrichsen et al., Reference Hindrichsen, Wettstein, Machmüller, Jörg and Kreuzer2005). The two mixed diets in this study did not differ in enteric CH4 per unit of feed intake and of digested OM. This suggests that the influence of the ruminal starch degradability was minor (Yang et al., Reference Yang, Beauchemin, Farr and Rode1997). However, it cannot be excluded that concomitant differences in fibre composition helped to compensate any such discrepancies. Beauchemin and McGinn (Reference Beauchemin and McGinn2005) observed a higher enteric CH4 formation with diets containing barley-based concentrate compared with maize-based concentrate, but this at a very high dietary concentrate proportion (800 g/kg DM).
Slurry-CH4 formation is assumed by the IPCC (2006) to depend on several factors such as the nutrient composition of the excreta, storage duration and temperature. The excreta nutrients accessible to the slurry microbes are determined by the enteric nutrient digestibility and often consist of poorly degradable residues. In this study, diet type apparently affected CH4 emission from slurry more clearly than enteric methanogenesis. However, these effects were not consistent across different storage durations and temperatures. In the case of a relatively short slurry storage duration at high temperature or at any storage duration under cold conditions, CH4 emission was higher from hay-based slurry than from that derived from the two mixed diets. Still, the amount of substrate (OM, fibre) was lower in the hay-based slurry. The low CH4 emissions from the hay-based slurry were more consistent with the apparent degradation recorded when stored for 15 weeks at 27°C. Anyway, these specific conditions were the only ones where CH4 emission from hay-based slurry was substantial. Differences in CH4 emission between the slurry types originating from the two mixed diets did not significantly differ under any storage condition. A compensatory increase in slurry-CH4 emissions consecutive to a decreased enteric methanogenesis, as described in other studies (Hashimoto et al., Reference Hashimoto, Varel and Chen1981; Külling et al., Reference Külling, Dohme, Menzi, Sutter, Lischer and Kreuzer2002; Hindrichsen et al., Reference Hindrichsen, Wettstein, Machmüller and Kreuzer2006), was not apparent in this study, maybe except for the maize diet when the slurry was stored at 27°C.
The IPCC (2006) assumes CH4 emission from liquid slurry to be three times higher at 27°C than at 14°C. In this study, this was different by a factor of about 10 across all diets. Over 15 weeks of storage, slurry-CH4 emissions found at a storage temperature of 27°C were higher in this study than those measured by Külling et al. (Reference Külling, Dohme, Menzi, Sutter, Lischer and Kreuzer2002) and Hindrichsen et al. (Reference Hindrichsen, Wettstein, Machmüller and Kreuzer2006). However, these researchers had stored the slurry for only 14 weeks at comparably lower ambient temperatures of 20°C and 23°C, respectively. Nevertheless, slurry methanogenesis was found to be in a similar range as observed by Hindrichsen et al. (Reference Hindrichsen, Wettstein, Machmüller, Jörg and Kreuzer2005), who stored slurry at 24°C. The high CH4 emissions found in this study at 27°C might have been at least partially the result of preventing the slurry from drying out. Different from Hindrichsen et al. (Reference Hindrichsen, Wettstein, Machmüller, Jörg and Kreuzer2005 and Reference Hindrichsen, Wettstein, Machmüller and Kreuzer2006), slurry was always covered with lids with a hole. Steed and Hashimoto (Reference Steed and Hashimoto1994) observed an increase in CH4 emissions from slurry when employing completely closed incubators. The set-up used in this study can be considered as a good reflection of the typically almost closed slurry containers in Western Europe.
Following the course of slurry methanogenesis, compared with Hindrichsen et al. (Reference Hindrichsen, Wettstein, Machmüller, Jörg and Kreuzer2005), no peak in CH4 emission occurred after about 8 weeks of storage in this experiment. In the hay-based slurry the highest emissions occurred after about 12 weeks of storage. For the slurry of the two concentrate-based diets no such CH4 peak was found at all (data not shown). Nevertheless, measuring slurry methanogenesis for an even longer period does not seem to be useful, as storage over more than 15 weeks is rarely applied in farm practice. The statement of Hindrichsen et al. (Reference Hindrichsen, Wettstein, Machmüller and Kreuzer2006) that variations among individual slurries in CH4 emissions are much higher than those found in enteric methanogenesis among individual cows was confirmed by this study.
It is generally assumed that CH4 from slurry management accounts only for a minor proportion of the entire animal slurry-CH4 budget. Accordingly, most studies dealing with mitigating CH4 from ruminant husbandry focus on enteric CH4 mitigation and less on manure-derived emissions. The present data confirm that under cold storage conditions slurry-CH4 emission is only of minor impact. The same is true for slurry stored under warm conditions for a rather limited period of time. In addition, other studies agree that slurry stored below 15°C does not constitute a significant CH4 source (Steed and Hashimoto, Reference Steed and Hashimoto1994; Clemens et al., Reference Clemens, Trimborn, Weiland and Amon2006; Sommer et al., Reference Sommer, Petersen, Sørensen, Poulsen and Møller2007). However, longer storage periods at warm storage conditions resulted in substantial proportions of 20% to 30% of total CH4 originating from slurry methanogenesis. The proportions found in other studies varied from small (7%) to also the quite substantial proportion of 22% (Hindrichsen et al., Reference Hindrichsen, Wettstein, Machmüller, Jörg and Kreuzer2005 and Reference Hindrichsen, Wettstein, Machmüller and Kreuzer2006) of total CH4. Külling et al. (Reference Külling, Dohme, Menzi, Sutter, Lischer and Kreuzer2002) measured about 27% of total CH4 deriving from slurry when enteric methanogenesis was decreased by adding lauric acid to the cows’ diet.
Conclusion
The widespread assumption that forage-only diets inevitably result in higher enteric CH4 formation than mixed forage-concentrate diets was disproved in this study. The role of carbohydrate type degraded (predominantly fibre v. predominantly starch) in methanogenesis was unexpectedly low, suggesting that CH4-inhibiting effects like a low ruminal pH, often associated with additional concentrate, had been prevented by the high proportion of straw and stover. Consistent with the lack of clear diet effects on enteric CH4 formation, there was no such effect on manure-derived CH4 as well. It has to be considered, however, that the diets were balanced in their contents of energy and N, which might have been the reason for the lack of an effect. Concerning N emissions from slurry, the importance of ruminal degradability of starch and protein was demonstrated. Our findings support the hypothesis that slurry methanogenesis strongly depends on storage temperature and duration, whereas there was no such temperature effect on N emissions. These aspects have to be considered in calculating greenhouse gas budgets and simulating system-wide ammonia emission scenarios.
Acknowledgements
The authors acknowledge the financial support of the Vontobel foundation, Switzerland and the project TUMSS (Towards an improved Understanding of Methane Sources and Sinks) of the ETH Zurich. In addition, the authors thank Dr H. Leuenberger and the employees of the ETH Research station for their great assistance and service during the dairy cow experiment as well as Dr H.R. Wettstein and B. Jörg for their technical efforts with the respiratory measurements.