1 Introduction
A plasma that contains macroscopic particles in addition to electrons, ions and neutral gas atoms is called a dusty plasma. In laboratory dusty plasma experiments, particles with diameters of some 100 nm up to
 $20~{\rm\mu}\text{m}$
are produced in or inserted into the plasma discharge. Micrometre-sized dust particles in a laboratory radio-frequency plasma attain a net negative charge
 $q_{d}$
and can be confined in the lower plasma sheath where gravity is compensated by the electric field. The negative potential
 ${\it\phi}_{fl}$
of a dust particle is given by the floating condition, which is defined by the equality of ion and electron fluxes to its surface. The dust particle with radius
 $r_{d}$
can be taken as a spherical capacitor (Whipple Reference Whipple1981):
 $$\begin{eqnarray}q_{d}=4{\rm\pi}{\it\varepsilon}_{0}r_{d}{\it\phi}_{fl}.\end{eqnarray}$$
Almost always when laboratory dusty plasmas are studied, the investigations rely on an accurate knowledge of the particle charge and/or its mass or size, e.g. an understanding of the charging processes of the particles, their electrostatic interaction, their arrangement and confinement or dust heating processes.
While particle size or mass can in principle be measured ex situ, there is no alternative to determining the particle charge in situ. In addition, even the particle size or mass
 $m_{d}$
have to be determined in situ for every single experimental situation if a high precision is needed. The dust particles which are typically used in laboratory experiments are made of melamine formaldehyde (MF), polymethyl methacrylate (PMMA) or silica (
 $\text{SiO}_{2}$
). They are supplied by the manufacturers with very narrow size distributions. Nevertheless, these small size differences of the almost monodisperse particles and in particular mass changing processes as the outgassing of water (Pavlu et al.
Reference Pavlu, Velyhan, Richterova, Nemecek, Safrankova, Cermak and Zilavy2004), reactive sputtering due to impurities (Zeuner, Meichsner & Poll Reference Zeuner, Meichsner and Poll1995), or sputtering by the accelerated ions in the sheath can make real-time in situ mass measurements indispensable (Carstensen et al.
Reference Carstensen, Jung, Greiner and Piel2011, Reference Carstensen, Haase, Jung, Tadsen, Groth, Greiner and Piel2013; Jung et al.
Reference Jung, Greiner, Asnaz, Carstensen and Piel2015; Killer, Mulsow & Melzer Reference Killer, Mulsow and Melzer2015; Schmidt & Piel Reference Schmidt and Piel2015).
The original resonance method was introduced over 20 years ago (Melzer, Trottenberg & Piel Reference Melzer, Trottenberg and Piel1994; Trottenberg, Melzer & Piel Reference Trottenberg, Melzer and Piel1995; Homann, Melzer & Piel Reference Homann, Melzer and Piel1999). One or a few particles are driven by an external sinusoidal force and their dynamics can be treated as a damped harmonic oscillator. The method makes it possible to measure the eigenfrequency
 ${\it\omega}_{0}$
of the vertical confinement well and the gas friction coefficient
 ${\it\gamma}$
. These quantities enable one to determine the charge-to-mass ratio and the size of the investigated particle. The improved version of the method, named the ‘phase-resolved resonance method’ (PRRM) (Carstensen et al.
Reference Carstensen, Jung, Greiner and Piel2011), provides an even higher accuracy with
 ${\it\sigma}({\it\omega}_{0})/{\it\omega}_{0}<10^{-3}$
and
 ${\it\sigma}({\it\gamma})/{\it\gamma}<10^{-2}$
;
 ${\it\sigma}$
is the standard deviation. The resonance method is not restricted to the investigation of a single grain, but can also be used to measure the interaction of two particles in the plasma sheath (Carstensen et al.
Reference Carstensen, Greiner, Block, Schablinski, Miloch and Piel2012).
2 Experimental set-up and measurement technique
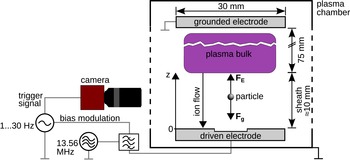
Figure 1 shows a sketch of a typical experimental set-up. The plasma chamber consists of a vacuum vessel with two asymmetrically capacitively coupled electrodes. The upper electrode and the vessel are grounded, the lower electrode is driven with a radio-frequency (r.f.) voltage. Argon or other noble gases are typically used at pressures of
 $p\approx 0.5\ldots 100~\text{Pa}$
. One or more particles can be brought into the plasma by using a dust dispenser, a tiny salt shaker. As mentioned above, a negatively charged dust particle (mass
 $m_{d}$
) can be levitated at the (vertical) position
 $z_{0}$
in the lower plasma sheath, where the gravitational force
 $F_{g}$
is compensated by the electrostatic force
 $F_{E}$
of the sheath electric field
 $E$
:
 $$\begin{eqnarray}m_{d}g=q_{d}(z_{0})E(z_{0}),\end{eqnarray}$$
where
 $g$
is the acceleration of gravity. The trapped particles are illuminated by an expanded laser beam and are observed by a high-speed camera from the side. The camera is equipped with an interference filter at the wavelength of the illumination laser to exclude the plasma glow. There needs to be a particle detection system which is able to determine the vertical position
 $z$
of the particles for single frames. Using a Gaussian filter for smoothing and a peak-finding algorithm is sufficient to determine the particle position with sub-pixel accuracy (Crocker & Grier Reference Crocker and Grier1996; Feng, Goree & Liu Reference Feng, Goree and Liu2007; Ivanov & Melzer Reference Ivanov and Melzer2007).
Sketch of the experimental set-up: the lower capacitively-coupled electrode is driven by an r.f. signal (typically
 $f=13.56~\text{MHz}$
,
 $P<40~\text{W}$
) to produce the plasma. One or more particles can be confined in the lower plasma sheath where the force of gravity
 $F_{g}$
is compensated by the electric field force
 $F_{E}$
. The horizontal particle confinement is realized by a cavity in the electrode (10 mm radius, 2 mm depth). The particles are illuminated by a laser beam (not pictured) and can be observed by a high-speed camera through a window. An l.f. signal is coupled to the driven electrode through a low-pass filter and induces vertical particle oscillations and triggers the camera.

2.1 The resonance method for a single dust particle
For a constant charge density
 ${\it\rho}$
in the considered region of the sheath there is a linear increase of the electric field towards the electrode. Hence, the confinement in the vicinity of the equilibrium position given by (2.1) is harmonic. The (vertical) equation of motion is then described by a harmonic oscillator with spring constant
 $D$
:
 $$\begin{eqnarray}m_{d}\ddot{{\it\xi}}=-F_{r}({\it\xi})=-q_{d}E({\it\xi})=-D{\it\xi}=-m_{d}{\it\omega}_{0}^{2}{\it\xi},\end{eqnarray}$$
restoring force
 $F_{r}$
and
 ${\it\xi}=z-z_{0}$
. The eigenfrequency
 ${\it\omega}_{0}$
is a measure of the stiffness of the particle confinement. The particle motion is damped by the ambient neutral gas. Thus, a friction force with the gas friction coefficient
 ${\it\gamma}$
(Epstein Reference Epstein1924) has to be added to (2.2):
 $$\begin{eqnarray}m_{d}\ddot{{\it\xi}}=-2{\it\gamma}m_{d}\dot{{\it\xi}}-m_{d}{\it\omega}_{0}^{2}{\it\xi}.\end{eqnarray}$$
The essential element of the resonance method is a low-frequency (l.f.) signal of a function generator with frequency
 ${\it\omega}$
(
 $U<5~\text{V}$
), which is coupled to the driven electrode through a low-pass filter. This modulation of the electrode bias leads to a vertical oscillation of the particle in the plasma sheath. The external periodical excitation force can be added to the equation of motion (2.3):
 $$\begin{eqnarray}\ddot{{\it\xi}}+2{\it\gamma}\dot{{\it\xi}}+{\it\omega}_{0}^{2}{\it\xi}=H({\it\omega})K\text{exp}(\text{i}{\it\omega}t),\end{eqnarray}$$
where
 $H({\it\omega})$
is the transfer function of the filter and
 $K$
the amplitude of the excitation force normalized to the particle mass. Using
 $$\begin{eqnarray}{\it\xi}(t)=A\,\text{exp}(\text{i}{\it\omega}t)\end{eqnarray}$$
leads to a steady-state response
 $A({\it\omega})$
given by
 $$\begin{eqnarray}A({\it\omega})\cdot ({\it\omega}_{0}^{2}+2\text{i}{\it\gamma}{\it\omega}-{\it\omega}^{2})=H({\it\omega})K.\end{eqnarray}$$
When the complex amplitude of the particle oscillation is split into the real and the imaginary part,
 $A({\it\omega})=a({\it\omega})+\text{i}\,b({\it\omega})$
, we obtain:
 $$\begin{eqnarray}\displaystyle & \displaystyle a({\it\omega})=\text{Re}\{H({\it\omega})\}\frac{K\,({\it\omega}_{0}^{2}-{\it\omega}^{2})}{({\it\omega}_{0}^{2}-{\it\omega}^{2})^{2}+(2{\it\gamma}{\it\omega})^{2}}, & \displaystyle\end{eqnarray}$$
 $$\begin{eqnarray}\displaystyle & \displaystyle b({\it\omega})=-\text{Im}\{H({\it\omega})\}\frac{K2{\it\gamma}{\it\omega}}{({\it\omega}_{0}^{2}-{\it\omega}^{2})^{2}+(2{\it\gamma}{\it\omega})^{2}}. & \displaystyle\end{eqnarray}$$
The absolute value of the oscillation amplitude is
 $$\begin{eqnarray}|A({\it\omega})|=H({\it\omega})\frac{K}{\sqrt{({\it\omega}_{0}^{2}-{\it\omega}^{2})^{2}+(2{\it\gamma}{\it\omega})^{2}}}.\end{eqnarray}$$
There is a fundamental difference between the original resonance method (Melzer et al.
Reference Melzer, Trottenberg and Piel1994; Trottenberg et al.
Reference Trottenberg, Melzer and Piel1995; Homann et al.
Reference Homann, Melzer and Piel1999) and its improved version, the PRRM (Carstensen et al.
Reference Carstensen, Jung, Greiner and Piel2011). Primarily, the oscillation amplitude of a particle at different excitation frequencies
 ${\it\omega}$
had been measured whereas the PRRM is based on a measurement of the real part
 $a$
and imaginary part
 $b$
of the complex amplitude. The benefits will be discussed below.
Whereas the amplitude can be measured directly by observing the particle motion, it is a little more complicated to determine
 $a$
and
 $b$
: the mathematical relationship of the phase
 ${\it\varphi}={\it\omega}t$
and the excursion
 ${\it\xi}$
of the particle from its equilibrium position (
 ${\it\xi}=0$
) corresponds to (2.5)
 $$\begin{eqnarray}\displaystyle {\it\xi}({\it\varphi}) & = & \displaystyle A\,\text{exp}(\text{i}{\it\varphi})\nonumber\\ \displaystyle & = & \displaystyle (a+\text{i}b)\,(\cos {\it\varphi}+\text{i}\sin {\it\varphi})\nonumber\\ \displaystyle & = & \displaystyle a\cos {\it\varphi}+\text{i}a\sin {\it\varphi}-b\sin {\it\varphi}+\text{i}b\cos {\it\varphi}.\end{eqnarray}$$
Furthermore, the relationship of
 $z$
, which is the vertical particle position, and the complex displacement
 ${\it\xi}$
from the equilibrium position is
 $$\begin{eqnarray}z({\it\varphi})=z_{0}+\text{Re}\{{\it\xi}({\it\varphi})\}.\end{eqnarray}$$
With (2.10) and (2.11) it is easy to see that
 $$\begin{eqnarray}\displaystyle & \displaystyle a={\textstyle \frac{1}{2}}[z({\it\varphi}=0^{\circ })-z({\it\varphi}=180^{\circ })], & \displaystyle\end{eqnarray}$$
 $$\begin{eqnarray}\displaystyle & \displaystyle b={\textstyle \frac{1}{2}}[z({\it\varphi}=270^{\circ })-z({\it\varphi}=90^{\circ })]. & \displaystyle\end{eqnarray}$$
This is how
 $a$
and
 $b$
can be determined.
 ${\it\varphi}$
is the phase shift between the excitation signal and the instant when the particle position
 $z$
is observed. However, it is not equal to the phase angle between the particle trajectory
 ${\it\xi}$
and the excitation signal, which is given by the inertial response of the particle and the additional phase shift of the filter
 $H({\it\omega})$
(see (2.7) and (2.8)).
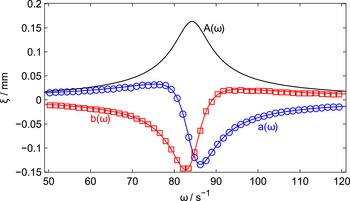
Exemplary resonance curve (PMMA particle with
 $r_{d}=8~{\rm\mu}\text{m}$
,
 $p=6~\text{Pa}$
,
 $P_{rf}=12~\text{W}$
). The solid lines are fits of (2.7) and (2.8); the calculated amplitude
 $A({\it\omega})$
(2.9), which has been measured in the primary version, is shown for comparison. Due to the higher gradients at the eigenfrequency (
 ${\it\omega}_{0}\approx 84\,\text{s}^{-1}$
) the measurement of
 $a$
and
 $b$
yields a higher precision of the fit parameters than the measurement of
 $A$
.

The recording of the camera is triggered by the l.f. signal of the function generator. By choosing an adequate trigger delay time
 ${\rm\Delta}t={\it\varphi}/{\it\omega}$
it is possible to measure the position of the particle at the four needed phase shifts
 $0^{\circ }$
,
 $90^{\circ }$
,
 $180^{\circ }$
and
 $270^{\circ }$
between the excitation signal and the measurement of the particle position.
The excitation frequency
 ${\it\omega}$
can be changed stepwise and
 $a({\it\omega})$
and
 $b({\it\omega})$
are determined. The obtained resonance curves can be fitted with (2.7) and (2.8) to obtain
 ${\it\omega}_{0}$
and
 ${\it\gamma}$
.
Figure 2 exemplarily shows the resonance curve of a single particle. The maximum of the amplitude
 $|A({\it\omega})|$
is given by the resonance frequency
 ${\it\omega}_{r}=\sqrt{{\it\omega}_{0}^{2}-2{\it\gamma}^{2}}=84.11\,\text{s}^{-1}$
, which is slightly shifted from the eigenfrequency
 ${\it\omega}_{0}=84.33\,\text{s}^{-1}$
. The advantage of the PRRM compared to the original version is that the strong gradients of
 $a$
(and
 $b$
) at
 ${\it\omega}_{0}$
result in a higher accuracy in determining the fit parameters (especially
 ${\it\omega}_{0}$
).
2.2 Measuring resonance curves of a particle pair
The PRRM is not only restricted to one particle but can also be used to investigate two vertically aligned particles. Two particles of the same size and mass usually levitate at the same height. Different masses as well as wake effects due to streaming ions (Melandsø & Goree Reference Melandsø and Goree1995; Nambu, Vladimirov & Shukla Reference Nambu, Vladimirov and Shukla1995; Melzer et al.
Reference Melzer, Schweigert, Schweigert, Homann, Peters and Piel1996) can lead to a vertical arrangement. For small oscillation amplitudes compared to the interparticle distance
 $d_{0}$
, the particle interaction force can be linearized. It can be described by the stiffness parameter
 $f_{jk}$
that describes the strength of the interaction force that the particle
 $k$
exerts on particle
 $j$
(Carstensen et al.
Reference Carstensen, Greiner, Block, Schablinski, Miloch and Piel2012; Jung et al.
Reference Jung, Greiner, Asnaz, Carstensen and Piel2015). The interaction term has to be considered in the equations of motion (2.4) as well:
 $$\begin{eqnarray}\displaystyle & \displaystyle \ddot{{\it\xi}}_{u}+2{\it\gamma}_{u}\dot{{\it\xi}}_{u}+{\it\omega}_{u}^{2}{\it\xi}_{u}+\frac{f_{\mathit{ud}}}{m_{u}}({\it\xi}_{u}-{\it\xi}_{d})=H({\it\omega})K_{u}\text{exp}(\text{i}{\it\omega}t), & \displaystyle\end{eqnarray}$$
 $$\begin{eqnarray}\displaystyle & \displaystyle \ddot{{\it\xi}}_{d}+2{\it\gamma}_{d}\dot{{\it\xi}}_{d}+{\it\omega}_{d}^{2}{\it\xi}_{d}+\frac{f_{\mathit{du}}}{m_{d}}({\it\xi}_{d}-{\it\xi}_{u})=H({\it\omega})K_{d}\text{exp}(\text{i}{\it\omega}t). & \displaystyle\end{eqnarray}$$
Here and in the following, the index
 $j=\text{u, d}$
is used to identify the different dust particles:
 $u=\text{up}$
for the higher and
 $d=\text{down}$
for the lower particle. These differential equations can again be solved with a complex ansatz that leads to the amplitudes
 $$\begin{eqnarray}\displaystyle & \displaystyle A_{u}({\it\omega})=H({\it\omega})\frac{K_{u}({\it\Omega}_{du}+{\it\Lambda}_{d})+K_{d}{\it\Omega}_{ud}}{{\it\Lambda}_{u}{\it\Lambda}_{d}+{\it\Lambda}_{u}{\it\Omega}_{du}+{\it\Lambda}_{d}{\it\Omega}_{ud}}, & \displaystyle\end{eqnarray}$$
 $$\begin{eqnarray}\displaystyle & \displaystyle A_{d}({\it\omega})=H({\it\omega})\frac{K_{d}({\it\Omega}_{ud}+{\it\Lambda}_{u})+K_{u}{\it\Omega}_{du}}{{\it\Lambda}_{u}{\it\Lambda}_{d}+{\it\Lambda}_{u}{\it\Omega}_{du}+{\it\Lambda}_{d}{\it\Omega}_{ud}}, & \displaystyle\end{eqnarray}$$
with
 ${\it\Lambda}_{j}={\it\omega}_{j}^{2}-{\it\omega}^{2}+2\text{i}{\it\gamma}_{j}{\it\omega}$
and
 ${\it\Omega}_{jk}=f_{jk}/m_{j}$
. The real and the imaginary part of the amplitudes can be determined analogously as described above. The fit of
 $a$
and
 $b$
to the resonance curves provides not only the eigenfrequencies
 ${\it\omega}_{j}$
and the gas friction coefficients
 ${\it\gamma}_{j}$
of the particles, but also their stiffness parameters divided by mass
 $f_{jk}/m_{j}$
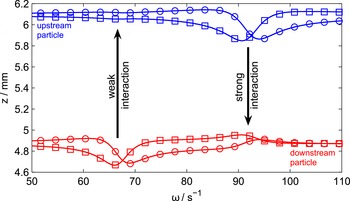
(see figure 3). The following section will show how these determined parameters can be used to derive properties of the particle(s) or the plasma-dust system. Practical applications will be presented in § 4.
Exemplary resonance curves of a particle pair confined in the sheath (MF particle with
 $r_{d}=5.8~{\rm\mu}\text{m}$
and a somewhat larger PMMA particle with
 $r_{d}=7.4~{\rm\mu}\text{m}$
,
 $p=6.25~\text{Pa}$
,
 $P_{rf}=15~\text{W}$
). The colour blue identifies the upstream (MF), red the downstream (PMMA) particle. The full lines are fits of the real (circles) and imaginary (squares) part of the complex amplitudes (2.16) and (2.17). The upper particle exerts a stronger force on the lower particle than vice versa (see § 4.3). This can be seen at the resonance of the upper particle, where the lower one shows a strong dynamical response, whereas the upper particle is nearly unaffected by the resonance of the lower grain.

2.3 Derivable quantities
Corresponding to (2.2) the eigenfrequency is
 $$\begin{eqnarray}{\it\omega}_{0}^{2}=\frac{D}{m_{d}}=\frac{1}{m_{d}}\frac{\partial }{\partial z}[E(z)q_{d}(z)].\end{eqnarray}$$
For small displacements from the stable position
 $z_{0}$
, the particle charge
 $q_{d}$
can be considered as constant:
 $$\begin{eqnarray}{\it\omega}_{0}^{2}=\frac{q_{d}}{m_{d}}\frac{\partial E(z)}{\partial z}=\frac{q_{d}}{m_{d}}\frac{{\it\rho}}{{\it\varepsilon}_{0}},\end{eqnarray}$$
where
 ${\it\varepsilon}_{0}$
is the vacuum permittivity and
 ${\it\rho}$
the charge density at the position of the particle in the plasma sheath. Hence,
 ${\it\omega}_{0}$
can be used to analyse the charge
 $q_{d}$
of a particle. The main problem is that
 ${\it\omega}_{0}$
also depends on the particle mass and the charge density in the plasma sheath. To overcome the problem of the unknown particle mass one can trust the manufacturer’s data for particle size and density and take it as constant, or one can use the measured gas friction coefficient to determine the exact mass (see below). To evaluate the charge density is a more challenging task since additional measurements of the ion density in the plasma and a model for the density distribution in the sheath are needed. Therefore, instead of determining absolute values, the eigenfrequency is most suitable to analyse relative changes like changes in the charge or the charge-to-mass ratio of a particle at a nearly constant sheath position (see § 4.1), or differences of particles which levitate at the same height in the sheath (see § 4.3).
The gas friction coefficient
 ${\it\gamma}$
is given by Epstein (Reference Epstein1924):
 $$\begin{eqnarray}{\it\gamma}={\it\delta}\frac{2}{3}{\rm\pi}r_{d}^{2}\frac{m_{n}}{m_{d}}n_{n}v_{th,n}={\it\delta}\frac{4}{{\rm\pi}}\frac{p}{r_{d}{\it\rho}_{d}v_{th,n}}.\end{eqnarray}$$
Here,
 $r_{d}$
,
 $m_{d}$
and
 ${\it\rho}_{d}$
are the radius, mass and mass density of the dust grain;
 $m_{n}$
,
 $n_{n}$
and
 $T_{n}$
are the mass, density and temperature of the neutrals; and
 $v_{th,n}=\sqrt{8k_{B}T_{n}/({\rm\pi}m_{n})}$
is the thermal velocity of the gas atoms, which are at room temperature.
 $k_{B}$
is the Boltzmann constant and
 $p$
is the gas pressure. The type of reflexion of the gas atoms on the particle surface is described by the parameter
 ${\it\delta}$
, which can have values between
 ${\it\delta}=1$
(perfect specular reflection) and
 ${\it\delta}=1.44$
(diffuse reflection). Note that any measurement of
 ${\it\gamma}$
only allows the determination of
 ${\it\delta}/({\it\rho}_{d}\,r_{d})$
. If
 ${\it\rho}_{d}$
and
 ${\it\delta}$
are well known,
 ${\it\gamma}$
can be used to calculate the particle size (see § 4.2).
The unit of the stiffness parameter is
 $[f]=\text{N}~\text{m}^{-1}$
. As already shown in figure 3, the strength and symmetry of the particle interaction can directly be observed from the resonance curves of a particle pair: the stronger the influence of a particle on another particle is, the more its dynamics is affected by the dynamics of the other grain (e.g. when it is in resonance and oscillates strongly). The stiffness parameters can be used to analyse the magnitude and the symmetry of the particle interaction forces (see § 4.3).
3 Parameter range and hardware requirements
This section will sum up the needed technical equipment and discuss the experimental limitations of the method.
3.1 Hardware requirements
In addition to the standard dusty plasma experiment components (plasma chamber, vacuum system, r.f. generator and matchbox, dust particles, illumination laser) the resonance method needs:
-
(i) A high-speed camera with interference filter, which can be triggered by an external signal.
-
(ii) An l.f. signal generator. It is comfortable if the generator allows phase shifts between two signal outputs or between an output and the trigger output. Otherwise the needed phase shifts (see § 2.1) have to be implemented by using software or by using two signal generators. Note that instead of using a periodical excitation signal, the dynamic response of the particles to single pulses can be analysed analogously (Kong et al. Reference Kong, Hyde, Harris, Qiao and Carmona-Reyes2009).
-
(iii) A low-pass filter network to modulate the driven electrode bias with the l.f. signal.
-
(iv) A computer system with software that is able to control the measurement process: setting and changing the frequency of the l.f. signal and the phase shift of the trigger signal, controlling the image acquisition, and performing the particle detection.
3.2 Parameter range
The resonance method can be used in all laboratory plasma systems, where one or a few dust particles can be levitated in a harmonic confinement and can be observed by a camera. Additional forces on the dust grains do not impede resonance measurements as long as they are constant over time and space, e.g. the purposeful utilization of a thermophoretic force (Havnes et al. Reference Havnes, Nitter, Tsytovich, Morfill and Hartquist1994). They only shift the stable particle position in the sheath and do not change the harmonic particle confinement given by the sheath.
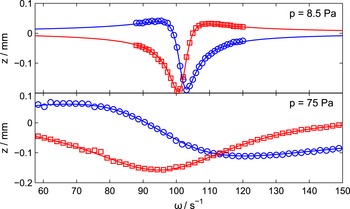
Influence of the damping by the ambient neutral exemplarily shown for two resonance curves at different gas pressures (MF particle with
 $r_{d}=5.8~{\rm\mu}\text{m}$
,
 $P_{rf}=12~\text{W}$
). An increase of the damping leads to a broadening of the curves. In addition, the amplitude of the external excitation signal has to be increased to compensate for the stronger damping.

The method is not limited by discharge power, gas pressure or the size of the dust grains. A change in power only affects the plasma density and hence leads to a shift of the resonance frequency. Since the gas pressure affects the damping of the particle oscillation (see figure 4), the amplitude of the excitation signal needs to be adjusted adequately to it. If the excitation is too strong, nonlinear effects will become significant (Zafiu, Melzer & Piel Reference Zafiu, Melzer and Piel2001) and/or the particle confinement may be broken. Gas pressures between 0.5 and 100 Pa work well for studies with the resonance method.
The method is not limited to one particle or a vertically aligned particle pair. In fact, the particles of an entire horizontal dust monolayer can be excited and their resonance response can be analysed (Melzer et al. Reference Melzer, Trottenberg and Piel1994; Trottenberg et al. Reference Trottenberg, Melzer and Piel1995). If only a single particle of a dust cloud should be excited, the external bias modulation as driver method can be replaced by laser excitation (Homann et al. Reference Homann, Melzer and Piel1999). A strong, periodically modulated laser beam can be focused on a single particle and can be used to set it into vertical oscillations. Nevertheless, the resonance method is an invasive measurement technique which does always include an external perturbation of the particle dynamics. Hence, it cannot be used when dust kinetics should be studied simultaneously, e.g. for dust temperature measurements, particle arrangement and interaction as crystal formation, or waves. Measurements of the resonance can then be performed using Brownian motion. The spectrum of velocity fluctuations in the confinement can be analysed to determine the resonance frequency (Schmidt & Piel Reference Schmidt and Piel2015). However, in many cases it may be sufficient to perform these studies consecutively (Melzer et al. Reference Melzer, Trottenberg and Piel1994; Trottenberg et al. Reference Trottenberg, Melzer and Piel1995).
The resonance method can only resolve temporal processes with a resolution that corresponds to the time it takes to record a single resonance curve. Depending on the needed precision (number of data points) and the investigated frequency regime (at high damping rates the resonance curves are broad and larger frequency intervals have to be covered for a single resonance curve, see figure 4) the performance of a resonance curve measurement takes from a few minutes up to 10 minutes, which limits the rate at which processes in the system, e.g. mass changes of particles, can be investigated.
4 Applications
This section gives an overview of investigations that have been done and results that have been achieved with the resonance method.
4.1 The eigenfrequency: charge measurements and investigation of mass changes
After its development in the 1990s at the beginning of dusty plasma physics, a great merit of the resonance method was that it allows one to measure the charge of particles. By measuring the eigenfrequency, it has been shown (Melzer et al.
Reference Melzer, Trottenberg and Piel1994; Trottenberg et al.
Reference Trottenberg, Melzer and Piel1995; Homann et al.
Reference Homann, Melzer and Piel1999) that micrometre-sized particles gain charges of the order of
 $-10\,000~e$
. The measurement of the particle charge allows a further understanding of dust charging processes and the interaction of the particles. Nevertheless, due to the needed additional determination of the plasma density and the position of the sheath edge as well as a model for the density structure in the sheath, the errors of these values are of the order of 50 % (Trottenberg et al.
Reference Trottenberg, Melzer and Piel1995).
The PRRM made it possible to study slight temporal changes of the eigenfrequency of a single MF particle in a constant plasma environment (Carstensen et al.
Reference Carstensen, Jung, Greiner and Piel2011). An increase in the eigenfrequency of 5 % at a small discharge power had been attributed to the outgassing of water out of the particle material. Since
 ${\it\omega}\propto 1/({\it\rho}_{d}^{1/2}\,r_{d})$
, this can result in either a 5 % decrease of the particle size, a 10 % decrease of the mass density or a combination of both (see (2.19) and (1.1)).
This was the first time that an in situ measurement technique was precise enough to measure these small effects and to show that taking the properties of the dust-plasma system as temporally constant may be wrong when accurate values are needed. The fact that the eigenfrequency (2.19) only provides the charge-to-mass ratio of the particle (and also depends on the charge density) impedes the exclusion of an increasing particle charge due to a change of the particle surface properties as cause for the increasing eigenfrequency.
4.2 Verification of Epstein’s law of friction and mass measurements
Carstensen et al. (Reference Carstensen, Haase, Jung, Tadsen, Groth, Greiner and Piel2013) have shown that the measured gas friction coefficient
 ${\it\gamma}$
has a linear dependence on the neutral gas pressure
 $p$
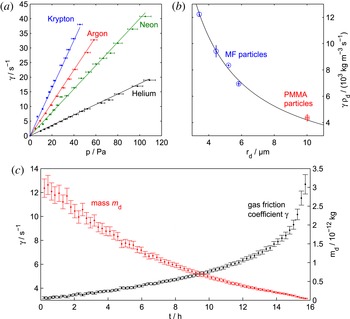
as is predicted by the Epstein formula (2.20). The PRRM measurements have been done with MF particles in helium, neon, argon and krypton for pressures between 1 and 100 Pa (see figure 5
a). This covers the whole usual parameter regime of laboratory dusty plasmas. In addition, Jung et al. (Reference Jung, Greiner, Asnaz, Carstensen and Piel2015) have performed more than 100 PRRM measurements with single particles of different known sizes and different materials (MF and PMMA). Hence the validity of
 ${\it\gamma}\propto r_{d}^{-1}$
has been checked (see figure 5
b).
Furthermore, the thorough measurements allow for good statistics. If the mass density and particle sizes given by the manufacturer are assumed, a value of
 ${\it\delta}=1.64\pm 0.05$
is gained, which is 14 % higher than the theoretical upper limit of
 ${\it\delta}=1.44$
. Since
 ${\it\gamma}\propto 1/({\it\rho}_{d}\,r_{d})$
, this points to at least a 14 % decrease of either the mass density or particle size or a combination of both. We can conclude that this result as well as the result discussed in the previous section shows that the manufacturer’s data for the particle properties cannot be used under plasma conditions if high accuracy is needed. The results indicate a change in mass density but a change in radius cannot be dismissed conclusively. With the discussed reserves, which have to be further investigated in future, the checked validity of Epstein’s law of friction can be used to calculate the mass of the particles from their measured gas friction coefficients. In particular temporal changes of the particle mass, e.g. by plasma inherent etching processes, can be observed as it is shown in figure 5(c). If the consistency of the particle properties is important, the outgassing of water during a measurement can be avoided by drying at high temperatures before filling them in the dust dispenser.
(a) Gas friction coefficient
 ${\it\gamma}$
versus gas pressure
 $p$
. For each measurement sequence (noble gas), the measurements were performed with the same MF particle (
 $r_{d}=6.0~{\rm\mu}\text{m}$
). The lines represent Epstein’s law of friction (with
 ${\it\delta}=1.44$
) and show the linear dependence of
 ${\it\gamma}$
and
 $p$
(Carstensen et al.
Reference Carstensen, Haase, Jung, Tadsen, Groth, Greiner and Piel2013). (b) Gas friction coefficient versus particle radius
 $r_{d}$
. Each data point belongs to more than 20 PRRM measurements with individual particles of the same size and material. The large amount of measurements allows good statistics, which results in a high accuracy for the measurement of the reflexion coefficient
 ${\it\delta}=1.44\pm 0.05$
. The mass density
 ${\it\rho}_{d}$
of the particles has to be taken into account due to the different particle materials used. The full line again corresponds to Epstein’s law (
 ${\it\gamma}\propto r_{d}^{-1}$
). (c) A PMMA particle in the plasma has a relatively high mass loss rate due to plasma inherent etching processes. Continuous PRRM measurements can be used to measure changes of the gas friction coefficient and to calculate the time-dependent particle mass (Jung et al.
Reference Jung, Greiner, Asnaz, Carstensen and Piel2015).

4.3 Investigation of wake-induced particle interaction
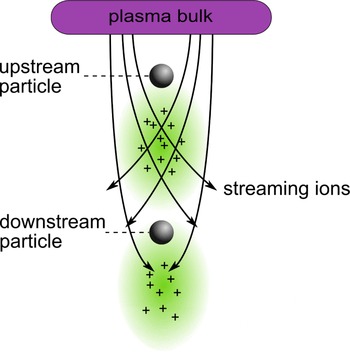
The wake is a positive space charge area that forms downstream of a particle in a flowing plasma environment (Melandsø & Goree Reference Melandsø and Goree1995; Nambu et al. Reference Nambu, Vladimirov and Shukla1995; Melzer et al. Reference Melzer, Schweigert, Schweigert, Homann, Peters and Piel1996; Lampe, Joyce & Ganguli Reference Lampe, Joyce and Ganguli2005). A negatively charged particle acts as a kind of electrostatic lens. It attracts the positive streaming ions and focuses them in the downstream direction. Wakes are most pronounced in the plasma sheath where the ions are accelerated towards the electrode by the sheath electric field (Schweigert et al. Reference Schweigert, Schweigert, Melzer, Homann and Piel1996; Takahashi et al. Reference Takahashi, Oishi, Shimomai, Hayashi and Nishino1998; Melzer, Schweigert & Piel Reference Melzer, Schweigert and Piel1999). Figure 6 shows a sketch of the formation of ion wakes behind two particles in the plasma sheath. The positive wake potential can induce attractive, non-reciprocal forces between negatively charged particles and the enhanced ion flow can lead to a charge reduction of a particle in the wake of another particle (Takahashi et al. Reference Takahashi, Oishi, Shimomai, Hayashi and Nishino1998; Melzer et al. Reference Melzer, Schweigert and Piel1999; Melzer, Schweigert & Piel Reference Melzer, Schweigert and Piel2000; Prior, Mitchell & Samarian Reference Prior, Mitchell and Samarian2003; Carstensen et al. Reference Carstensen, Greiner, Block, Schablinski, Miloch and Piel2012).
Sketch of the formation of ion wakes behind particles. The streaming ions in the plasma sheath are attracted by the negatively charged particles. The ions are focused in the downstream direction which leads to the formation of net positive space charge areas – the ion wakes. The wakes lead to attractive forces between negatively charged particles. Due to the much shorter distance between the lower particle and the wake of the upper one than the other way around, the wake-induced particle interaction is quite non-reciprocal.

Both the decharging effect and the asymmetric attractive particle interaction have been investigated using the PRRM. The charge reduction of a particle in the wake of another particle has been shown by comparing the eigenfrequency of the lower particle in a two-particle system with the eigenfrequency of another single (same sized) particle at the same levitation height (Carstensen et al. Reference Carstensen, Greiner, Block, Schablinski, Miloch and Piel2012). Due to the two compared particles having the same position in the sheath and their identical masses, differences in their eigenfrequencies can be directly related to different particle charges (see (2.19)):
 $$\begin{eqnarray}\frac{q_{down}}{q_{single}}=\left(\frac{{\it\omega}_{down}}{{\it\omega}_{single}}\right)^{2}.\end{eqnarray}$$
The only difference between the two particles is the asymmetrical particle interaction. The high precision of the PRRM made it possible for Carstensen et al. (Reference Carstensen, Greiner, Block, Schablinski, Miloch and Piel2012) to show that the wake leads to a charge reduction of approximately
 $20\,\%$
, which is in good accordance with earlier measurements based on laser-induced resonances (Prior et al.
Reference Prior, Mitchell and Samarian2003) and with results from simulations (Miloch, Kroll & Block Reference Miloch, Kroll and Block2010).
The non-reciprocity of the wake-induced attractive interaction forces in a vertically aligned particle pair is a result of the asymmetric structure of the system: the distance between the lower particle and the wake of the upper one is naturally much shorter than the other way around (see figure 6). This leads to a much stronger attractive force of the higher particle on the lower one than vice versa, as seen in figure 3. The asymmetry can be directly determined by comparing the measured stiffness parameters
 $f_{jk}$
of both particles. For a pair of two (nearly) same-sized particles, Carstensen et al. (Reference Carstensen, Greiner, Block, Schablinski, Miloch and Piel2012) have shown that the degree of asymmetry of the interaction forces is larger than a factor of 5:
 $$\begin{eqnarray}\frac{f_{down,up}}{f_{up,down}}=\frac{\text{force of upper particle on downstream particle}}{\text{force of lower particle on upstream particle}}=5.5.\end{eqnarray}$$
By using a particle pair with two particles of different material, the whole bandwidth of the parameters that are determinable with the PRRM and the high precision of the method have been used to explore the spatial structure and the characteristics of the wake of a single dust particle by using the second one as a probe (Jung et al. Reference Jung, Greiner, Asnaz, Carstensen and Piel2015). The lower PMMA particle has a much stronger mass loss rate due to plasma-inherent etching processes than the upper MF particle. Hence, the lower particle approaches the upper one over time and moves through its wake. Continuous PRRM measurements during this process make it possible to measure all needed quantities: the temporal evolution of the particle masses can be calculated using the friction coefficients; the wake-induced charge reduction of the lower particle as a function of the distance to the upper particle can be determined by the eigenfrequency; and the degree of the wake-induced non-reciprocal particle interaction directly results from the stiffness parameters.
5 Summary
We have shown that the resonance method is a powerful tool to determine particle properties in a dusty plasma. The method rarely requires further hardware than the standard technical equipment for dusty plasma experiments. An external driver can be used to set the particles in oscillation and their dynamic response has to be investigated.
The resonance method allows measurement of the gas friction coefficient and the eigenfrequency of one or more particles with high accuracy. We have presented some applications which show that these parameters can be used in many ways. The gas friction constant has been used to proof the validity of Epstein’s law of friction for laboratory plasma experiments in the medium vacuum regime. Furthermore, the friction coefficient provides the possibility for in situ mass or size measurements. Particle charges can be determined from the eigenfrequency. The resonance method is particularly suited for the analysis of relative charge changes. In addition, by evaluating the resonances of vertically aligned particles, their interaction can be analysed.
Acknowledgement
This work was financially supported by Deutsche Forschungsgemeinschaft (DFG) within the Transregional Collaborative Research Center SFB-TR 24, Project A2.