Implications
The issue of loss of animal genetic diversity, worldwide, has become crucial and needs an immediate attention to conserve the available animal genetic resources. Genetic diversity has tremendous economic and environmental benefits, allowing for undertaking genetic improvement of animals for economically important traits and facilitating adaptation to changing production systems. Conservation of animal genetic resources requires investigation of trends and major causes of loss of diversity. Guernsey population in the three countries studied here showed continued loss of genetic diversity, random genetic drift being the major cause of the loss.
Introduction
Monitoring of the trends in genetic diversity within and among breeds is an essential first step for developing successful genetic conservation strategies for livestock species. This study focused on within-breed genetic diversity. Genetic variation in dairy breeds is required to allow sustained genetic improvement of economically important traits, and to facilitate rapid adaptation to changing breeding objectives, and environmental conditions (Notter, Reference Notter1999; Reist-Marti et al., Reference Reist-Marti, Simianer, Gibson, Hanotte and Rege2003). Previous studies, however, have demonstrated that rates of increase in inbreeding and estimates of effective population size in dairy cattle populations are alarming (Kearney et al., Reference Kearney, Wall, Villanueva and Coffey2004). In particular, Weigel (Reference Weigel2001) and Maiwashe et al. (Reference Maiwashe, Nephawe, van der Westhuizen, Mostert and Theron2006) reported that the American (GUS) and South African Guernsey (GSA) populations had effective population sizes of 65 and 165, respectively.
In addition, a recent study had demonstrated that the Canadian dairy breeds have been losing genetic diversity over the past decades (Stachowicz et al., Reference Stachowicz, Sargolzaei, Miglior and Schenkel2011). Nevertheless, there has been no comprehensive analysis and comparison of the trends in the genetic diversity of GCN, GSA and GUS populations. Continuous monitoring of genetic diversity is especially important in dairy breeds because the use of assisted reproductive techniques, such as artificial insemination and embryo transfer, can potentially rapidly increase rates of inbreeding and reduce the genetic diversity of even geographically distantly located dairy breeds. For example, high additive genetic relationship between Tunisian and Luxembourg Holstein was reported (Hammami et al., Reference Hammami, Croquet, Stoll, Rekik and Gengler2007). Inbreeding increases as a result of intensive selection and the use of few sires in dairy breeds. Thus, alleles of only those selected parents will be represented in the next generation, which leads to loss of diversity that could have been contributed by the unselected individuals. Such a decline in genetic diversity has been associated with various adverse incidents, mainly inbreeding depression in fitness-related traits and an increased fluctuation in selection response (Falconer and Mackay, Reference Falconer and Mackay1996). Hence, minimizing inbreeding and maximizing genetic diversity are the two main objectives of any conservation program, which requires a detailed knowledge of population structures within breeds to set conservation priorities (Caballero and Toro, Reference Caballero and Toro2000; Fernández et al., Reference Fernández, Toro and Caballero2001). It will, therefore, be appropriate to assess the genetic diversity within geographically distinct Guernsey populations, which would be useful for designing appropriate conservation strategies in the future.
Monitoring genetic diversity within population based on parameters derived from the probabilities of gene origin, such as effective number of founders, ancestors and founder genomes were demonstrated (Lacy, Reference Lacy1989; Boichard et al., Reference Boichard, Maignel and Verrier1997; Honda et al., Reference Honda, Nomura, Yamaguchi and Mukai2004). The parameters derived from the probabilities of gene origin precisely describe genetic diversity of populations after a small number of generations, although inbreeding coefficient and effective population size are important in monitoring diversity over longer periods of time (Boichard et al., Reference Boichard, Maignel and Verrier1997; Honda et al., Reference Honda, Nomura, Yamaguchi and Mukai2004). Pedigree information has been commonly used in monitoring and evaluating the genetic diversity of various breeds based on effective population size and probabilities of gene origin (Lacy, Reference Lacy1989; Sørensen et al., Reference Sørensen, Sørensen and Berg2005).
Gene-dropping simulation, as proposed by MacCluer et al. (Reference MacCluer, Vandeberg, Read and Ryder1986), may also be used in order to compute the proportions of founder alleles lost and the probability of founder alleles being at high risk of extinction, which would be useful in monitoring the effect of bottlenecks on the genetic diversity of Guernsey populations. The objectives of this study were, therefore, to examine the trend of within-breed genetic diversity, and identify major causes of loss of genetic diversity in Canada (GCN), GSA and GUS based on pedigree records.
Methods
Characterization of the pedigree information
The genetic diversity of breed in GCN, GSA and GUS was investigated. Within-breed genetic diversity and the possible cause of loss of genetic diversity were the main focus of the investigation in the three countries. Parameters derived from the probabilities of gene origin were, in particular, used to identify the major causes of loss of genetic diversity. The Canadian Dairy Network (CDN, Guelph, Ontario) provided pedigree data for GCN. The Agricultural Research Council (ARC) of South Africa and the Animal Improvement Programs Laboratory (AIPL) of United States Department of Agriculture (USDA) kindly provided pedigree data from GSA and GUS, respectively. For each country, a reference population was defined as animals born from 2002 to 2007. This period was selected because the average generation interval of the populations was close to 6 years and, hence, it comprises the last generation of data evaluated in each country. The pedigrees from the three countries could not be analyzed together, because of differences in animal identification, which were difficult to reconcile without error. The pedigree completeness level of the reference populations was evaluated by using four parameters: (1) maximum number of generations traced back, (2) percentage of known ancestors per generation, (3) number of complete generation equivalents and (4) pedigree completeness index (PCI). The maximum number of generations traced was defined as the longest ancestral path in each breed. The PCI of each Guernsey population was computed for four ancestral generations using the following formula, as proposed by MacCluer et al. (Reference MacCluer, Boyce, Dyke, Weitkamp, Pfennig and Parsons1983):
 $$PCI\, = \,\frac{{2{{C}_{sire}}{{C}_{dam}}}}{{{{C}_{sire}}\, + \,{{C}_{dam}}}}$$
where Csire and Cdam are contributions from the paternal and maternal lines, respectively,
 $${{C}_i}\, = \,\frac{1}{g}\mathop{\sum}\limits_{i\, = \,1}^g {{{a}_i}} $$
where ai is the proportion of known ancestors in generation i; and g is the number of generations considered in this study (g = 4).
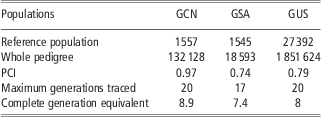
The number of animals analyzed in the entire pedigree and in the reference population of each breed is shown in Table 1.
Number of animals in the reference population (2002 to 2007) and whole population, PCI, maximum number of generation traced back and complete generation equivalent for the three populations
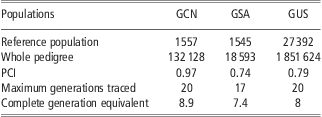
PCI = pedigree completeness index; GCN = Canadian Guernsey; GSA = South African Guernsey; GUS = American Guernsey.
Demographic parameters
Generation interval was computed for the four possible selection pathways (sire of sons (LSS), sire of daughters (LSD), dam of sons (LDS) and dam of daughters (LDD)) as the average age of parents when their offspring were born. The average generation interval for each breed was obtained as
 $$L\, = \,\frac{{{{L}_{SS}}\, + \,{{L}_{SD}}\, + \,{{L}_{DS}}\, + \,{{L}_{DD}}}}{4}$$
Parameters used to measure genetic diversity
Calculation of inbreeding coefficient and inbreeding rate, effective population size and parameters derived from the probability of gene origin (effective number of founders, non-founders, ancestors and founder genome equivalents) were used to describe the genetic diversity of the Guernsey breed in each of the three countries.
Inbreeding coefficient
In each population, the inbreeding coefficient of an individual was computed based on the indirect method proposed by Colleau (Reference Colleau2002), which was modified by Sargolzaei et al. (Reference Sargolzaei, Iwaisaki and Colleau2005) for faster calculation inbreeding in large populations with overlapping generations. In populations with incomplete pedigree, inbreeding coefficient would be underestimated (Lutaaya et al., Reference Lutaaya, Misztal, Bertrand and Mabry1999). Therefore, inbreeding coefficient accounting for missing pedigree records in each population were also computed using the method proposed by VanRaden (Reference VanRaden1992). Accordingly, estimates of inbreeding were derived by assuming that, for the same year, relationships between unknown parents are twice the average of the inbreeding of progeny of known parents.
Effective population size (Ne)
The effective population size was computed based on the rate of inbreeding per generation, which is the function of the annual rate of inbreeding (ΔF) and generation interval (L) of the respective population (Gutierrez et al., Reference Gutierrez, Altarriba, Diaz, Quintanilla, Canon and Piedrafita2003):
 $${{N}_e}\, = \,\frac{1}{{2{\rm{\rDelta }}F\,\times \,L}}$$
Effective number of founders (fe)
The fe is a measure of the contribution of founders to the population and it was calculated as the number of equally contributing founders that would be expected to generate the same level of genetic diversity as in the population under study (Honda et al., Reference Honda, Nomura, Yamaguchi and Mukai2004):
 $${{f}_e}\, = \,{{\left[ {\mathop{\sum}\limits_i^f {{{q}_i}^{2} } } \right]}^{{\rm{ - }}1}} $$
where qi is the genetic contribution of the ith founder to the reference population and f is the total number of founders. If all founders were to contribute equally, f would be the same as the fe. However, the fe is usually lower than f, indicating unequal contributions of founders due to selection. The fe alone may not be a useful parameter for assessing genetic diversity, because the genetic contributions of founders would converge to a constant value after a number of generations (Bijma and Woolliams, Reference Bijma and Woolliams1999), and hence, the fe would remain constant.
Effective number of ancestors (Na)
The Na estimates the minimum number of ancestors (founders or not) required to explain the complete genetic diversity in the reference population and is obtained by computing the marginal contributions of each ancestor. The marginal contribution is the genetic contribution from an individual after correcting for contributions of all other ancestors. The Na accounts for recent bottlenecks and, hence, partially accounts for the loss of allelic diversity in descendant population. The Na was calculated as
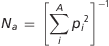 $${{N}_a}\, = \,{{\left[ {\mathop{\sum}\limits_i^A {{{p}_i}^{2} } } \right]}^{{\rm{ - }}1}} $$
where pi is the marginal genetic contribution of ancestor i, and A stands for total number of ancestors considered (Boichard et al., Reference Boichard, Maignel and Verrier1997), which was 1000 in this study. Accordingly, Na is a more useful measure of genetic diversity as compared with fe. Moreover, the Na/fe ratio reflects the role of bottlenecks in the development of the population.
Founder genome equivalent (fge)
The fge is defined as the number of equally contributing founders with no random loss of founder alleles that would be expected to give the same level of genetic diversity observed in the population under study, and it was computed as
 $${{f}_{ge}}\, = \,\frac{1}{{2{{f}_g}}}$$
where fg is the average co-ancestry for the group considered, as illustrated by (Lacy, Reference Lacy1995). The fge accounts for unequal contributions of founders, bottlenecks and random loss of alleles owing to genetic drift (Lacy, Reference Lacy1995; Honda et al., Reference Honda, Nomura, Yamaguchi and Mukai2004).
Effective number of non-founder (Nenf)
Accounts only for the effects of random genetic drift in the non-founder generations, and was computed from the following relationship (Lacy, Reference Lacy1995):
 $$\frac{1}{{{{f}_{ge}}}}\, = \,\frac{1}{{{{f}_e}}}\, + \,\frac{1}{{{{N}_{enf}}}}$$
A measure of the loss of genetic diversity can be derived from effective number of founder, effective number of founder genomes and effective number of non-founder. The amount of genetic diversity (GD) in the reference population accounting for loss of diversity due to genetic drift and unequal founder contribution is calculated as
 $$GD\, = \,1{\rm{ - }}\frac{{\rm{1}}}{{{\rm{2}}{{f}_{ge}}}}$$
When expressed as 1 − GD, the obtained value is the measure of genetic diversity lost in the population as founder generation due to bottlenecks and genetic drift.
The amount of genetic diversity in the reference population accounting for loss of diversity due to unequal founder contribution (GD*) was calculated as (Lacy, Reference Lacy1995):
 $$G{{D}^\ast} \, = \,1{\rm{ - }}\frac{{\rm{1}}}{{{\rm{2}}{{f}_e}}}$$
Similarly, the loss of genetic diversity due to unequal contributions of founders was represented by 1 − GD*. The difference between GD* and GD estimates the loss of diversity by genetic drift accumulated over non-founder generations and was calculated as the inverse of 2Nenf (Caballero and Toro, Reference Caballero and Toro2000).
Software
The parameters used to measure genetic diversity and the trends in genetic diversity in the Guernsey populations were computed using three software packages. Inbreeding coefficients, effective number of founder, non-founder and founder genome equivalents were calculated using CFC (Sargolzaei et al., Reference Sargolzaei, Iwaisaki and Colleau2006). Effective number of ancestors, percentage of known ancestors in each generation, the proportion of gene pool explained by certain number of ancestors and cumulated marginal contributions of ancestors were obtained using PEDIG (Boichard, Reference Boichard2002). The software EVA by Berg (Reference Berg2003) was used to compute PCIs, number of complete generation equivalents and average co-ancestry. The average observed inbreeding coefficients, expected inbreeding coefficients under random mating and the departure from randomness in actual matings were also obtained using the EVA software.
Gene-dropping simulations
The marginal genetic contributions of ancestors (founder or non-founder) can be computed based on pedigree information. However, the probabilities of allele extinction of founders can be only obtained using simulation. Therefore, gene-dropping simulation, as proposed by MacCluer et al. (Reference MacCluer, Vandeberg, Read and Ryder1986), was applied to the reference populations (animals born from 2002 to 2007). Accordingly, unique alleles were assigned to founders and the genotypes of all descendants were generated along the actual pedigree through Monte Carlo simulation following Mendelian segregation. In theory, the genetic contribution of a founder is in agreement with the expected value of the distribution of allele frequencies of the founders (Caballero and Toro, Reference Caballero and Toro2000). The distribution of frequencies of alleles from each founder of the Guernsey populations was estimated using 20 000 replicates of the simulation process. From the estimated distribution, the probability of alleles being at high risk of extinction, Pr(risk), was computed as the proportion of replicates in which allele frequency (q) was within the range of 0 < q < 0.01. Similarly, the probability of allele extinction, Pr(lost), in the reference populations was also obtained as the proportion of replicates in which both alleles originating from a founder did not exist in the respective reference populations.
Results
PCI
The GCN had the highest PCI (97.0%), computed for four ancestral generations, followed by GUS (79%) and GSA (74%) in 2007 (Figure 1). However, GUS had higher than 80% of PCI over the past three decades. The number of complete generation equivalents (Table 1) was comparable among the three populations. Generally, these results indicate that comparisons of the parameters used to measure genetic diversity among the populations would be possible.
Pedigree completeness index of the Canadian (GCN), South African (GSA) and American (GUS) Guernsey populations.

Demographic parameters
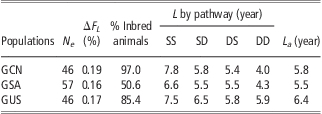
The longest and shortest generation intervals were observed in GUS and GSA, respectively (Table 2), with the average generation interval across countries being 5.9 years. Generation lengths were longer for the sire-offspring pathways than for the dam–offspring pathways in each population. Within dam, generation length was longer for sons than daughters in each population except GUS. Similarly, within sire, generation length was longer for sons than daughters across populations. The patterns of these generation intervals reflect relatively higher selection intensity applied to males than females in the breeding programs.
Effective population sizes and rate of inbreeding per year (ΔFL) in the reference population (2002 to 2007), and % inbred animals and generation intervals in the whole pedigree for the three populations
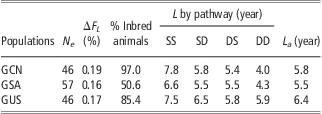
SS = sire of sons; SD = sire of daughters; DS = dam of sons; DD = dam of daughters; GCN = Canadian Guernsey; GSA = South African Guernsey; GUS = American Guernsey.
Probabilities of gene origin
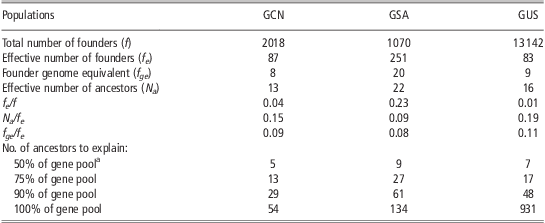
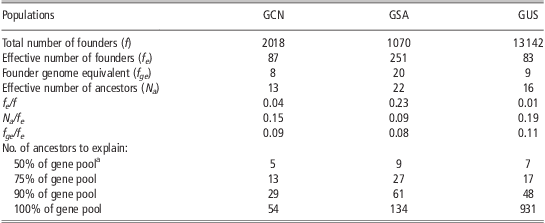
Results of the parameters derived from the probability of gene origin are shown in Table 3. In GCN and GSA, the total number of founders (2018 and 1070, respectively) was lower than in GUS (13 142). Nonetheless, GUS showed the lowest fe, which accounts for unequal contributions of the total number of founders, indicating, therefore, the presence of a relatively higher selection intensity in this population. On the contrary, GSA had the highest fe, indicating a relatively more balanced contributions from the founders of the population, which was also indicated by a higher fe/f ratio compared with GCN and GUS populations.
Parameters derived from the probability of gene origin in Guernsey populations
GCN = Canadian Guernsey; GSA = South African Guernsey; GUS = American Guernsey.
aGene pool of animals in the reference population (born from 2002 to 2007).
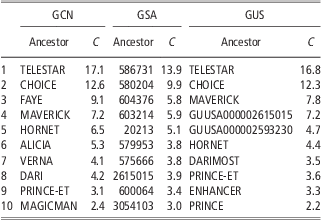
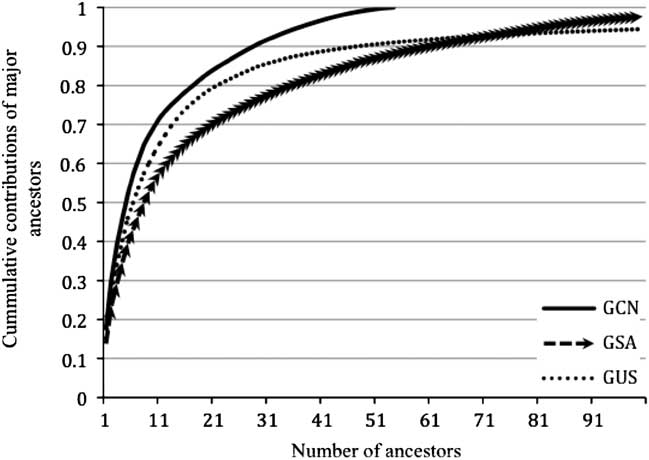
Furthermore, GCN showed the lowest Na (founders and not founders) followed by GUS and GSA. A considerable difference was also observed between effective number of ancestors and founders (Na/fe) in each population, with slightly lower values in GSA and GCN (0.087 and 0.092, respectively) than in GUS (0.108). This implies that each population may have passed through substantial bottlenecks with stronger bottleneck impact observed in GSA and GCN than in GUS. The genome of just 8, 9 and 20 non-related founders (fge) could explain the amount of genetic diversity observed in the reference population of GCN, GSA and GUS, respectively (Table 3). Similarly, the fge/fe ratio was slightly lower for GCN and GSA (0.09 and 0.08, respectively) than GUS (0.11), reflecting a higher impact of random genetic drift on the loss of genetic diversity in both populations than in GUS. In GCN and GUS, seven or less ancestors accounted for 50% of the current gene pool, whereas in GSA nine ancestors explained half of the current gene pool (Table 4).
Cumulative genetic contributions (C, %) of 10 major ancestors in Guernsey populations
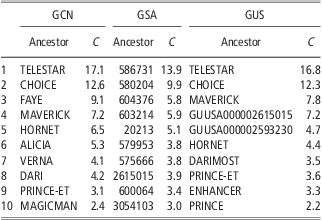
GCN = Canadian Guernsey; GSA = South African Guernsey; GUS = American Guernsey; C = cumulative contribution.
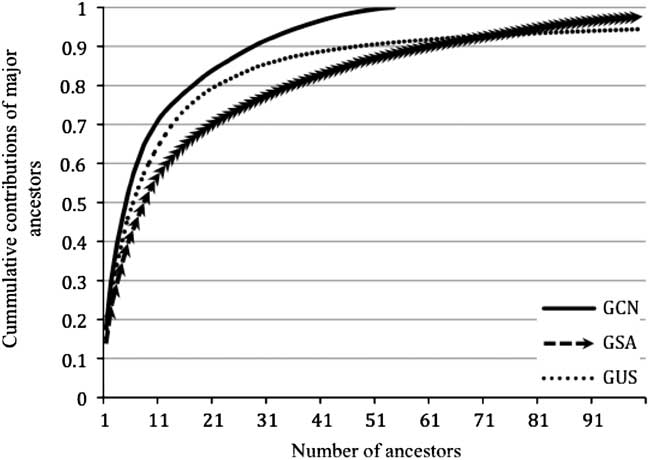
Fifty-four ancestors explained 100% of the gene pool in GCN (Table 3, Figure 2). However, in GSA and GUS, higher numbers of ancestors (134 and 931, respectively) were needed to explain 100% of the gene pool. This implies that a large number of ancestors contributed very little to the gene pool of GUS.
Cumulative contributions of major ancestors in the Canadian (GCN), South African (GSA) and American (GUS) Guernsey populations.
Inbreeding and genetic diversity
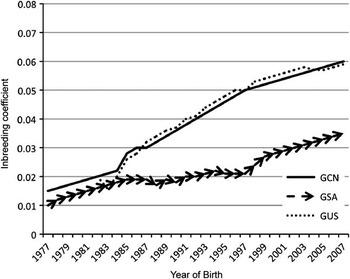
The rate of increase in inbreeding levels was comparable in each population, with a slightly higher value being observed in GCN, which might be attributed to its higher pedigree completeness compared with the other populations. The trend in inbreeding levels reflects that GSA has the lowest level of inbreeding over the past four decades, whereas GCN and GUS populations had comparable levels of regular inbreeding (Figure 3). The deviation of actual inbreeding coefficient from expected inbreeding under random mating was not substantial in each breed (data not shown).
Average inbreeding coefficient in the three Guernsey populations (GCN = Canadian Guernsey; GSA = South African Guernsey; and GUS = American Guernsey).

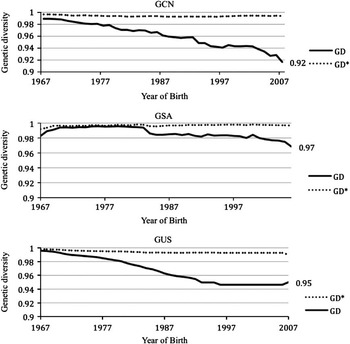
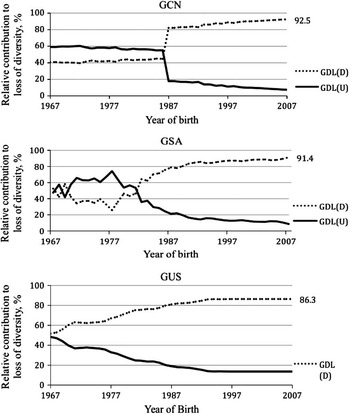
The overall trend in genetic diversity indicates that each population has been losing diversity over the last four decades. The amount of retained genetic diversity in the year 2007 is shown in Figure 4. Accordingly, GCN and GUS have lost ∼8% and 5% of their genetic diversity, whereas GSA lost just 3% of its diversity until 2007. In GUS, the trend in relative contribution to loss of genetic diversity indicates that random genetic drift had higher impact than unequal founder contribution since the year 1967, despite its relatively higher overall population size. However, in GCN and GSA the impact of drift was higher just over the last two decades (Figure 5). Overall, the proportion of genetic diversity lost due to random genetic drift was lower in GUS (86%) than GCN (93%) and GSA (91%).
Genetic diversity accounting for loss of diversity due to unequal founder contribution and random genetic drift (GD) and accounting only for the loss of diversity due to unequal founder contribution (GD*), in GCN = Canadian Guernsey; GSA = South African Guernsey; and GUS = American Guernsey populations over the last four decades. The values on the end of the solid line indicate the proportion of genetic diversity retained in each population in the most recent year (2007).

The trend in relative contribution to genetic diversity loss (GDL) by drift (D) and unequal contribution of founders (U), in GCN = Canadian Guernsey; GSA = South African Guernsey; and GUS = American Guernsey populations.

Gene-dropping simulations
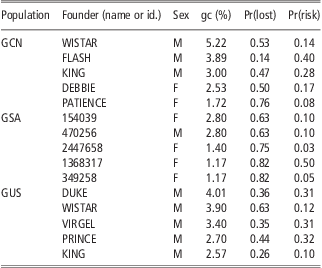
The probabilities of extinction of founder alleles for the five founders with the highest genetic contributions computed from pedigree, under the assumption that all the founders equally contribute to the respective reference population, are shown in Table 5. In genetic conservation programs, Pr(lost) is a useful information. For example, two founders, WISTAR and KING contributed up to 5.2% of the current gene pool in GCN and GUS populations. However, the Pr(lost) of WISTAR was higher in GUS than in GCN, but the Pr(lost) of KING was higher in GCN than in GUS. Similarly, KING has a much higher Pr(risk) in GCN (28) than in GUS (9.4). Although WISTAR showed higher Pr(lost) in GUS, its Pr(risk) was higher in GCN. This implies that the alleles of WISTAR had passed through a stronger bottleneck in the GCN population, resulting in a higher probability of extinction. On the other hand, the lower probability of loss of genome in KING reflects that his alleles have higher chance of being transmitted to the reference population in GCN than in GUS population.
gc, Pr(lost) and Pr(risk) in the Guernsey populations
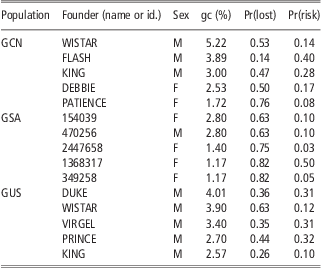
gc = genetic contributions; Pr(lost) = proportion of founder genomes lost; Pr(risk) = proportion of alleles being at high risk; GCN = Canadian Guernsey; GSA = South African Guernsey; GUS = American Guernsey.
Although the genetic contributions of the founders to the respective reference populations were low, several founders showed low probabilities of founder allele extinction, which implies that a fair proportion of the current population is connected to these founders without severe bottleneck. Moreover, the genetic contribution of founder PRINCE was 2.7% in GUS as a result of the gene-dropping simulation. However, this founder has the second highest risk of losing its genome (31.5%) in the GUS, after FLASH. Higher losses of founder genomes were found in GSA than GCN and GUS, which might indicate the higher impact of bottleneck in the GSA population. Nonetheless, the overall genetic contributions of the founders were smaller in GSA.
Discussion
The PCI of the GCN in this study was comparable to the values reported for Danish dairy cattle breeds, 94% on average (Sørensen et al., Reference Sørensen, Sørensen and Berg2005). The GSA and GUS showed relatively lower completeness. Moreover, the average generation interval for the breeds was about 6 years, which was similar to the report in other breeds, such as, the Canadian Jersey breed (Stachowicz et al., Reference Stachowicz, Sargolzaei, Miglior and Schenkel2011). However, GSA and Ayrshire breeds had longer (6.21 and 6.95, respectively) generation intervals reported (Maiwashe et al., Reference Maiwashe, Nephawe, van der Westhuizen, Mostert and Theron2006).
In conservation programs, the rate of inbreeding is the most important parameter in monitoring genetic diversity in terms of effective population size (Wiggans, Reference Wiggans and VanRaden1995). In this study, the rate of inbreeding per year between 2002 and 2007 ranged from 0.16% in GSA to 0.19% in GCN population. Similarly, an increase in inbreeding per year of 0.18% to 0.22% in Danish dairy breeds (Sørensen et al., Reference Sørensen, Sørensen and Berg2005) and of 0.23% and 0.15% in the Tunisian and Luxembourg Holstein populations were reported (Hammami et al., Reference Hammami, Croquet, Stoll, Rekik and Gengler2007), respectively. Moreover, comparable annual rates of inbreeding in US and UK Holsteins (0.20% and 0.17%, respectively) were reported (Wiggans, Reference Wiggans and VanRaden1995; Kearney et al., Reference Kearney, Wall, Villanueva and Coffey2004). On the other hand, a lower annual rate of inbreeding (0.05%) for the (GSA) population was reported (Maiwashe et al., Reference Maiwashe, Nephawe, van der Westhuizen, Mostert and Theron2006). The level of inbreeding in the Canadian dairy population has been increasing gradually and the trend would continue (Sewalem et al., Reference Sewalem, Kistemaker, Miglior and VanDoormaal2006).
In small populations, it is important to avoid inbreeding as much as possible, because increased inbreeding leads to inbreeding depression, lower genetic variance and a higher frequency of lethal genes (Falconer and Mackay, Reference Falconer and Mackay1996). For example, an increase in the levels of inbreeding was reported to have a negative impact on traits of economic importance in Jersey (Miglior et al., Reference Miglior, Szkotnicki and Burnside1992), American Holsteins (Wiggans, Reference Wiggans and VanRaden1995) and Spanish dairy breeds (González-Recio et al., Reference González-Recio, López, Maturana and Gutiérrez2007) due to inbreeding depression. The average co-ancestry of animals in a population predicts the average inbreeding coefficient in the subsequent generation (Falconer and Mackay, Reference Falconer and Mackay1996). Therefore, minimization of co-ancestry coefficient would be advisable to preserve the future genetic diversity of the breeds.
One of the most important parameters in monitoring conservation programs is the effective population size, which is inversely related to the rate of inbreeding and generation interval. Although there are several criteria to prioritize breeds for conservation programs (Bennewitz and Meuwissen, Reference Bennewitz and Meuwissen2005), the endangerment status of breeds is the most important criterion (Ruane, Reference Ruane2000), which can be expressed in terms of the effective population size. The Ne of GSA and GUS population was reported to be higher (165 and 65, respectively) in the past (Weigel, Reference Weigel2001; Maiwashe et al., Reference Maiwashe, Nephawe, van der Westhuizen, Mostert and Theron2006) than the results observed in this study. This implies a decline in the genetic diversity of the GSA and GUS populations. An effective population size of 50 is required in order for a population to withstand the effects of inbreeding, whereas a size of 500 is essential to sustain the genetic diversity and evolutionary potential of the population for several generations (Frankham et al., Reference Frankham, Ballou and Briscoe2002). However, in this study, GCN and GUS populations have already shown effective population size of <50. Similarly, an effective size of 47 in Canadian Jersey breed, in recent years (2003 to 2007) was reported (Stachowicz et al., Reference Stachowicz, Sargolzaei, Miglior and Schenkel2011). Moreover, the effective population sizes of three Danish dairy breeds were within or below the range of 50 to 100 (Sørensen et al., Reference Sørensen, Sørensen and Berg2005), which was mentioned to be the recommended size for livestock breeds. Small effective population size and an increasing inbreeding coefficient will lead to lower genetic diversity in the future.
Maintaining diversity within breeds depends very much on the effort to increase effective population size, and balancing the contribution of ancestors or avoiding mating of much-related animals and reducing genetic drift (Woolliams and Thompson, Reference Woolliams and Thompson1994). Therefore, concerted effort needs to be exerted so as to increase the effective population size of the Guernsey populations either by balancing the genetic contributions of parents or incorporating more animals into the gene pool. Moreover, lowering the rate of inbreeding in the short term, by mating less genetically related individuals within the populations would be helpful.
Genetic diversity within populations after a small number of generations can be measured using parameters derived from the probabilities of gene origin (Boichard et al., Reference Boichard, Maignel and Verrier1997). The fe was one of those parameters used to assess whether or not there is a balanced contribution of founders, and hence, it accounts for the loss of genetic diversity in each breed due to unequal contributions of founders (Lacy, Reference Lacy1989). The GSA population showed the largest fe despite the fact that it had a small overall population size. However, it has the lowest pedigree completeness (65.8% of PCI and 7.4 complete equivalent generations), what might have played a role in this result.
The observed disequilibrium in founder contributions in each population indicates the decline in genetic diversity, which could be caused by excessive use of some animals as parents of subsequent generations. The disequilibrium between expected contributions of the founders was higher in GUS and GCN, which also had larger overall population sizes compared with GSA. Therefore, selection of parents of next generation (Lacy, Reference Lacy1995; Fernández et al., Reference Fernández, Toro and Caballero2001) in such a way that parents would have lower additive genetic relationship would be more important in GUS and GCN populations so that the diversity of subsequent generations could be maintained.
The lower Na/fe ratio in GSA indicated that the population had passed through substantial recent bottlenecks. A similar impact of bottleneck on genetic diversity was reported in the Canadian Jersey breed (Stachowicz et al., Reference Stachowicz, Sargolzaei, Miglior and Schenkel2011). Interestingly, the lower Na in all populations illustrate that a very small number of ancestors accounted for the gene pool of the reference populations. In addition, GCN and GUS showed lower Na than GSA in this study, which was also reflected by smaller effective population sizes and lower level of genetic diversity in both populations. Therefore, in addition to the slightly lower rate of inbreeding per generation (Table 2), the contributions of ancestors also justify that the GSA population has higher level of genetic diversity compared with GCN and GUS.
The fge is also an important population parameter used to measure genetic diversity in the management of small populations (Lacy, Reference Lacy1995). The fge is a more accurate description of genetic variation of a population, as it accounts for the loss of genetic variability due to unequal founder contribution and also random genetic drift. The genetic loss of the reference population is expressed relative to the genetic diversity in the founder population. The fge/fe ratio measures the impact of genetic drift excluding the effect of founder contributions on genetic diversity, such that lower ratios are associated with higher impact of genetic drift. Accordingly, the effect of random genetic drift was higher in GCN than in GSA and GUS populations, which was also illustrated by a higher relative contribution of random genetic drift to loss of diversity in GCN than in GSA and GUS populations.
Although the impact of drift appears to be higher in GCN, genetic drift has been greatly affecting the diversity of all three populations. Therefore, there is a need to increase the Ne so as to prevent further effects of random genetic drift. The Canadian Jersey breed has also comparable fe and fge (Stachowicz et al., Reference Stachowicz, Sargolzaei, Miglior and Schenkel2011). The gene-dropping analysis indicated that, although the genetic contributions of founders were small, there is higher risk of loss of founder genomes in GCN and GUS populations than in GSA. This implies that if conservation programs are immediately implemented, considerable proportion of the founder genomes can still be recovered in the reference populations of Guernsey in the three countries. Moreover, GSA in the present study showed lower pedigree completeness, and therefore, estimates of genetic diversity might be overestimated in this population compared with that of the GCN and GUS populations. However, the present study illustrates very useful information for designing genetic conservation strategies and further investigation of genetic diversity especially based on molecular markers.
Overall, genetic diversity has been lost over the last four decades in the Guernsey breed in all the three countries. In this study, the proportion of genetic diversity lost due to random genetic drift was higher than that of unequal contribution of founders, which indicates that the loss of genetic diversity due to drift is higher than the loss due to selection in the populations. Various other studies also demonstrated genetic drift as the main cause of loss of genetic variation in small population (e.g. Rochambeau et al., Reference Rochambeau, Fournet-Hanocq, Tien and Khang2000).
Furthermore, several studies suggested that genetic diversity within breeds is mainly lost by genetic drift, which leads to an increase in homozygosity or fixation of alleles (e.g. Simianer, Reference Simianer2005). Therefore, it would be indispensable to apply breeding strategies such as optimum contribution selection (Jean-Jacques et al., Reference Jean-Jacques, Moureaux, Briend and Bechu2004; Hinrichs et al., Reference Hinrichs, Wetten and Meuwissen2006), minimizing inbreeding and maximizing genetic diversity (Sonesson and Meuwissen, Reference Sonesson and Meuwissen2001; Fernández et al., Reference Fernández, Toro and Caballero2003; Haile-Mariam et al., Reference Haile-Mariam, Bowman and Goddard2007) in each Guernsey population, with an urgent attention needed to maintain genetic diversity of the GCN and GUS populations.
Conclusions
This study demonstrated continued loss of genetic diversity in each of the Guernsey populations evaluated, being random genetic drift the major cause of the loss. The GSA population seems to have the highest genetic diversity despite having the lowest overall population size compared with the GCN and GUS. Interestingly, 5 out of 10 major ancestors explaining about 65% of the entire gene pool of animals born between 2002 and 2007 in Canada and the United States of America. were the same ancestors. This shows that GCN and GUS are highly related with regard to their gene pool. The results also showed that only 17, 13 and 27 ancestors explained 75% of the current gene pool of the GUS, GCN and GSA populations, respectively.
The very small effective number of ancestors observed in this study revealed the intensive use of few sires in all the populations. Hence, the number of offspring from these sires might be minimized to mitigate further loss of diversity. In addition, sires related to the ancestors, who have contributed very little to the current gene pool, might be included in the breeding program. The use of sires with higher genetic merit in GSA, but that did not have major genome representation to the GCN and GUS populations might also be considered for improving the genetic diversity in both populations. Moreover, the application of optimum contribution selection might help maintain the genetic diversity of GCN and GUS populations.
Acknowledgments
The Animal Improvement Programs Laboratory (AIPL) of USDA and the Agricultural Research Council (ARC) of South Africa and the Canadian Dairy Network (CDN) are highly acknowledged for providing us with the pedigree data.