I. INTRODUCTION
Organic solar cells (OSCs) offer great technological potential as renewable and alternative sources of electrical energy. Reference Yu, Gao, Hummelen, Wudl and Heeger1–Reference Chen, Dou, Gao, Chang, Li and Yang6 The possibility of using new organic semiconducting materials in place of silicon wafers in the fabrication of photovoltaic cells provides the prospect of lower manufacturing cost through the employment of various roll-to-roll techniques using solution-processable materials. In the field of organic photovoltaics, bulk heterojunction (BHJ) structures based on interpenetrating networks of conjugated polymers and fullerenes are the most intensely studied. Significant efforts have been applied toward improving the competitive power conversion efficiencies (PCEs) and the long-term air stability of OSCs. Reference Park, Roy, Beaupré, Cho, Coates, Moon, Moses, Leclerc, Lee and Heeger7–Reference Lu, Zheng, Wu, Schneider, Zhao and Yu9
The most efficient OSCs have been based on BHJ devices composed of a blend of an electron-donating low-band-gap conjugate polymer such as poly(3-hexylthiophene) (P3HT) and an electron acceptor such as fullerene or a fullerene derivative. Although both small molecules and polymeric materials with low-band-gap energies have been extensively investigated as p-type electron donor materials, not as many electron accepting fullerene derivatives have been actively studied because of difficulties associated with their synthesis. Thus, it is worthwhile to study new type of acceptor with good solubility and optimized energy levels. Reference Hoppe and Sariciftci10–Reference Zhou, Lin, Lou, Yu, Guo, Manley, Loser, Hartnett, Huang and Wasielewski12
Novel carbon-based structures, such as carbon nanotubes and graphene, have emerged in recent years as integrative materials for organic photovoltaic devices. The most recent fundamental block of intriguing actual scientific and technological interest is graphene, best described as a two-dimensional (2D) single atom-thick sheet of sp2 hybridized carbon atoms arranged in a honeycomb lattice with outstanding electronic, mechanical, thermal, and chemical properties. Various graphene materials have been used in OSC devices, especially for interfacial layers. Reference Wang, Tong, Xu, Özyilmaz and Loh13–Reference Liu, Liu, Zhang, Yang, Zhang, Pan, Yin, Chen and Wei19 However, seldom systematic study has been done on the application of BHJ materials for OSC, due to the poor oil solubility of graphene for the deposition and construction network active layer.
In this paper, a facile method that allows chemical functionalization of graphene sheets is described. These result in a solution processable graphene-based material, namely F-graphene, which can be integrated in organic photoelectronic devices, due to its unique structural and photophysical properties. F-graphene displays increased solubility in common organic solvents as compared to that of the untreated graphene. The synthesized F-graphene is blended with the conjugated polymer poly(3-hexylthiophene), P3HT, in different concentrations. The structure and morphology of the polythiophene–graphene composites are characterized by x-ray diffraction (XRD), scanning electron microscopy (SEM) and transmission electron microscopy (TEM), whereas their spectroscopic properties are investigated by ultraviolet (UV)/vis and Raman spectroscopies. It is demonstrated that utilization of F-graphene in photoelectronic devices exhibits significantly photovoltaic performance, indicating the potential of utilizing a new electron acceptor graphene material.
II. EXPERIMENTAL PROCEDURE
A. Material synthesis
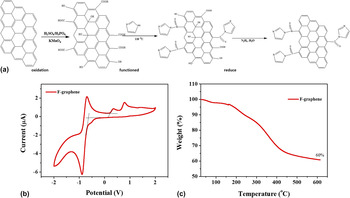
The Synthesis procedure is shown in Fig. 1(a). GO (graphene oxide) were prepared by Hummers' oxidation method, Reference Hummers and Offeman20 starting from a high-surface-area graphite, 325 mesh (purchased from Nanjing XFNANO Materials Tech). Little quantity (120 mL) of concentrated sulfuric acid and 2.5 g of sodium nitrate was introduced into a 2000 mL three-neck round bottomed flask immersed into an ice bath and 5 g of graphite was added, under nitrogen, with magnetic stirring. After obtaining a uniform dispersion of graphite powders, 15 g of potassium permanganate were added very slowly to minimize or avert possible of explosion. The reaction mixture was thus heated to 35 °C and stirred for 24 h. The resulting dark green slurry was first poured into a copious amount of deionized water, and then centrifuged at 10,000 rpm for 15 min. The isolated GO powder was first washed twice with 100 mL of a 5 wt% HCl aqueous solution and subsequently thoroughly washed with deionized water. It was dried in a vacuum refrigerant dryer for 24 h to obtain GO powder.
(a) Synthesis procedure for functionalization of graphene, which involves the imidazole, treatment of pristine graphene. (b) CV of functional graphene drop-cast on a Pt electrode in 0.1 mol/L Bu4NPF6 -acetonitrile solutions at a scan rate of 50 mV/s. (c) The TGA weight loss of the functional graphene.

1. Function of GO by imidazole
Little quantity (1 g) GO was loaded in a 250 mL round bottom flask and water (100 mL) was added, yielding an inhomogeneous yellow-brown dispersion. This dispersion was sonicated using an ultrasonic bath cleaner (150 W) until it became clear with no visible particulate matter. A mount of imidazole (5 g) was added in the bottom flask. The solution was heated in an oil bath at 118 °C under a water-cooled condenser for 24 h. This product was isolated by filtration over a medium fritted glass funnel, washed copiously with water (5 × 100 mL) and methanol (5 × 100 mL) to wash the residual imidazole, and dried in a vacuum refrigerant dryer for 24 h to obtain functioned-GO (F-GO) powder.
2. Reduction of F-GO by hydrazine hydrate
The reduction of F-GO by hydrazine hydrate is likely the function of GO. In a typical procedure, F-GO (100 mg) was loaded in a 250 mL round bottom flask and water (100 mL) was then added, yielding an inhomogeneous yellow-brown dispersion. This dispersion was sonicated using an ultrasonic bath cleaner (150 W) until it became clear with no visible particulate matter. Hydrazine hydrate (1.00 mL, 32.1 mmol) was then added and the solution heated in an oil bath at 100 °C under a water-cooled condenser for 24 h over which the reduced F-GO gradually precipitated out as a black solid. This product was isolated by filtration over a medium fritted glass funnel, washed copiously with water (5 × 100 mL) and methanol (5 × 100 mL), and dried in a vacuum refrigerant dryer for 24 h to yield reduced F-GO powder. Here we named the reduced F-GO as F-graphene.
B. Characterizations
TEM imaging was performed on a JEOL JEM-2100F (JEOL Ltd., Tokyo, Japan). SEM imaging was performed on FEI Quanta 200F (FEI Company, Hillsboro, Oregon). TEM samples were prepared in water solution. XRD measurements were performed with a Rigaku D/Max-B x-ray diffractometer (Rigaku Corporation, Tokyo, Japan) with Bragg-Brentano parafocusing geometry, a diffracted beam monochromator, and a conventional cobalt target x-ray tube set to 40 kV and 30 mA. The UV-visible spectra of the samples were recorded on a PerkinElmer Lambda 750 spectrophotometer (PerkinElmer Inc., Waltham, Massachusetts). X-ray photoelectron spectroscopy (XPS) studies were performed on a Thermo-VG Scientific ESCALAB 250 photoelectron spectrometer using a monochromated Al (Kα) (1486.6 eV) x-ray source (Thermo Fisher Scientific, Leicestershire, United Kingdom). The thermogravimetric analysis (TGA) was carried out in N2 on a TA instrument with a heating rate of 10 °C/min. The atomic force microscopy (AFM) images were recorded on a nanoscope III A scanning probe microscope (Digital Instruments Inc., Tonawanda, New York).
C. Photoelectronics device fabrication
ITO-coated glass substrates were first cleaned by ultrasonic agitation in acetone, detergent, deionized water, and isopropanol sequentially, followed by UV ozone treatment for 15 min. For the cathode buffer layer, ZnO precursor was prepared according to the sol–gel-derived method. Reference Sun, Seo, Takacs, Seifter and Heeger21 Typically, zinc acetate dihydrate (Zn(CH3COO)2·2H2O, Aldrich, 99.9%, 1 g) and ethanolamine (NH2CH2CH2OH, Aldrich, 99.5%, 0.28 g) were dissolved in 2-methoxyethanol (CH3OCH2CH2OH, Aldrich, 99.8%, 10 mL) under vigorous stirring for 12 h for the hydrolysis reaction in air. ZnO precursor solution was spin-coated at 4000 rpm for 60 s and then annealed at 200 °C for 1 h. The tetrahydrofuran (THF) solution of P3HT and F-graphene with different ratios was then spin-coated on top of ETL films at 600 rpm for 30 s and 1400 rpm 2 s. After drying for 2 h, the film was annealed at 150 °C for 10 min in N2-filled glove box. Finally, 7 nm thickness of MoO3 and Ag (100 nm) were thermally evaporated at a pressure of 4 × 10⁻⁴ Pa through a shadow mask to form an active area of ∼0.04 cm2.
III. RESULTS AND DISCUSSION
Data from TGA, are presented in Fig. 1(b). F-graphene displays improved thermal stability until 600 °C. Briefly, TGA curve of F-graphene shows a 3% weight loss before 150 °C, due to humidity and the evaporation of possible remaining solvent. In the range of 150–350 °C, a weight loss of approximately ∼20% occurred due to the decomposition of oxygen and isothiocyanate functional groups. From 350 to 600 °C, a weight loss of ∼40% was observed, which can be attributed to the removal of the imidazole group. The TGA analysis further confirms that graphene was successfully functionalized. Reference Kumar, Bardhan, Tongay, Wu, Belcher and Grossman22 The highest occupied molecular orbit/lowest unoccupied molecular orbital (HOMO/LUMO) energy levels of F-graphene were investigated by cyclic voltammetry (CV) as shown in Fig. 1(c). The HOMO energy level of the polymers was determined from the oxidation onset of the second scan from CV data. It is assumed that the redox potential of Fc/Fc+ has an absolute energy level of −4.40 eV to vacuum. The energies of the HOMO and LUMO levels were calculated according to the following equations:
 $${E_{{\rm{HOMO}}}} = - \left( {{\Phi _{{\rm{ox}}}} + 4.4} \right)\left( {{\rm{eV}}} \right)$$
 $${E_{{\rm{LUMO}}}} = - \left( {{\Phi _{{\rm{red}}}} + 4.4} \right)\left( {{\rm{eV}}} \right)\quad ,$$
where Φox and Φred are the onset oxidation potential and the onset reduction potential versus Ag/Ag+, respectively. Introducing oxygen-rich groups around the F-graphene impacts a significant effect on the band gap of the resultant F-graphene. From the value of Φox and Φred, the HOMO and LUMO energy levels F-graphene are about −5.0 and −4.3 eV, respectively. These results can also demonstrate the functionalization of graphene and suggest the use of F-graphene as an acceptor in BHJ devices. Reference Yu, Park, Durstock and Dai18
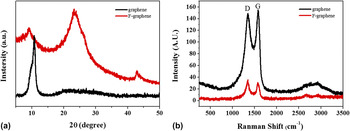
The as-prepared graphene and F-graphene samples were also characterized by XRD, Fig. 2(a). The diffraction peak at 2θ = 10.8° has been attributed to the (002) main reflection of stacks of graphene. The diffractogram of F-graphene does not exhibit the peak at 10.8°; instead peak is observed at 12.5° together with a more prominent one at 24.0°; the former should be attributed to the interplanar spacing of the disordered stacking of functionalized graphene. Reference Liu, Song, Xue and Zhang23,Reference Wang, Li, Tang, Lu and Li24 The peak at 24.0° may be due to a partial reduction of F-graphene during the functionalization reaction. To further investigate the F-graphene, graphene before and after functionalization exhibits two characteristic peaks at 1352 and 1595 cm−1 in Raman spectra [Fig. 2(b)]. These features can be attributed to the D and G peaks of F-graphene, respectively. Compared with pristine graphene, higher intensity of D peaks in F-graphene indicates its enhanced oxidation. The conversion of pristine to F-graphene were also obviously evidenced by the variation of 2D band at ∼2650 cm−1 from a sharp peak of F-graphene.
The (a) x-ray diffusion and (b) Raman spectrum of pristine graphene powders (black line) and functional graphene powders (red line).

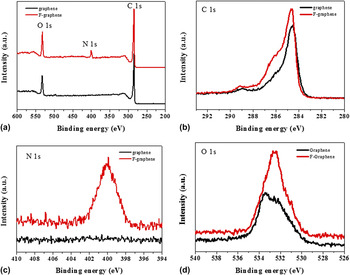
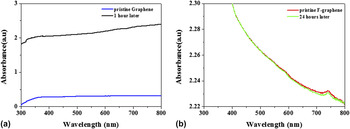
Figure 3 shows XPS spectra of graphene before and after functionalization. While Fig. 3(a) shows only the C and O peaks for graphene, the corresponding XPS spectrum for the F-graphene reveals the presence of carbon, oxygen, and nitrogen. Figures 3(b)–3(d) show the different element spectrum for C, N and O, respectively. It is clearly found the big improvement of the intensity of C, N, and O peak, especially the N1s peak. Moreover, it could be observed that the C peak change from binding energy of 284.5 eV to 285.4 eV and the O peak change from 533.3 eV to 532.4 eV. All above the XPS analysis could prove the functionalization of graphene and also verify the good solubility for F-graphene. Reference Yu, Yang, Durstock, Baek and Dai17,Reference Liu, Liu, Zhang, Yang, Zhang, Pan, Yin, Chen and Wei19 In addition, to give a more direct evidence of the good solubility for F-graphene, the UV-vis absorption studies of pristine graphene and functional graphene powders in THF solution was carried out (Fig. 4). The standing test for pristine graphene and functional graphene suspension after the ultrasonic treatment can exhibit the solubility. As expected, the UV-vis absorption spectra of pristine graphene suspension have a huge decrease after only 1 h standing, which means massive aggregation of graphene, as shown in Fig. 4(a). The dispersibility of the GO was measured to compare with F-graphene. As shown in Fig. S1, the UV-vis absorption spectra of GO suspension also have a huge decrease after only 1 h standing, attributing to the low dispersibility of GO in THF solution. However, the UV-vis absorption spectra of functional graphene suspension in Fig. 4(b) show a little difference even after difference after as long as 24 h standing.
(a) XPS survey spectra of pristine graphene powders (black line) and functional graphene powders (red line). (b) XPS carbon 1s spectra. (c) XPS nitrogen 1s spectra. (d) XPS oxygen 1s spectra.

The absorbance spectrum of standing test for (a) pristine graphene and (b) functional graphene dispersed in THF solution.

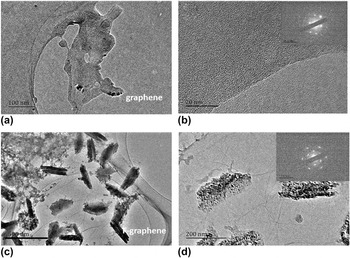
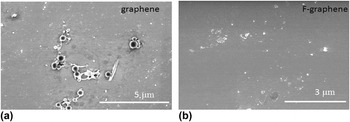
In order to investigate the morphology of F-graphene, the TEM and SEM were used and the images are shown in Figs. 5 and 6. The pristine graphene exhibits a wrinkled and crinkly structure of aggregation [Figs. 5(a) and 5(b)], with a rough surface [Fig. 6(a)]. It is mainly due to the π–π stacking between the individual graphene layers. However, the TEM images of F-graphene powders show the thin graphene sheets with few layers as shown in Figs. 5(c) and 5(d). From the selected area electron diffraction (SAED) patterns in Fig. 5(d). It can be inferred that F-graphene is fully exfoliation. Reference Huang, Ruiz-Vargas, van der Zande, Whitney, Levendorf, Kevek, Garg, Alden, Hustedt and Zhu25,Reference Peng, Somodi, Helveg, Kisielowski, Specht and Bell26 The TEM image of GO was shown in Fig. S2, the results indicated that the graphene was well oxidized. The SEM image of F-graphene [Fig. 6(b)] is much smoother than the former one and graphene oxide (Fig. S3). One should note that the exfoliation and functionalization of graphene can provide a completely contact with the donor in BHJ structure.
The TEM images and SAED of (a and b) pristine graphene powders and (c and d) functional graphene powders.

The SEM images of (a) pristine graphene film and (b) functional graphene film.

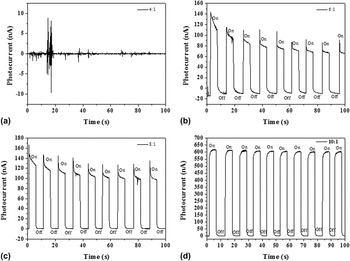
To demonstrate the potential application of the F-graphene in photovoltaic cells, we firstly carried out the P3HT:F-graphene BHJ blend in photodetector with a sandwich structure of ITO/P3HT:F-graphene/Ag at different ratios. The photoelectric response properties in more detail and detect potential application in photoelectronic detection field. We have performed further experiments of photodetector under illumination, shown in Fig. 7. In Fig. 7(a), only chaotic current response can be found that when the proportion of P3HT and F-graphene is 4:1. Moreover, as the ratio increases to 6:1 and 8:1 [Figs. 7(b) and 7(c)], the obvious phenomenon of photoelectric switch is to be found with the current relaxation. However, with the extension of testing time, the relaxation phenomenon could be more obvious, and there will be certain photocurrent attenuation. Gratifyingly, when the ratio grows up to 10:1, the BHJ device shows an outstanding photodetector performance while the photoresponse is steady, prompt, and reproducible during repeated on/off cycles of visible light illumination. On the other hand, the P3HT:F-graphene blend demonstrates an obvious photovoltaic effect, which means the F-graphene could play as an acceptor in BHJ. XRD was conducted to analyze the existence of F-graphene in BHJ. As shown in Fig. S3, the diffraction peak at 6.2 and 22.3° is assigned to the (100) diffraction of P3HT and characteristic peak of F-graphene, respectively. The result confirms the existence of F-graphene in BHJ.
Photoresponse of P3HT:F-graphene-based photodetectors with different ratios. The output signal of photocurrent under alternating light on and light off, where the entire device was illuminated by 150 W Xe lamp irradiation. (a) P3HT:F-graphene = 4:1, (b) P3HT:F-graphene = 6:1, (c) P3HT:F-graphene = 8:1, (d) P3HT:F-graphene = 10:1.

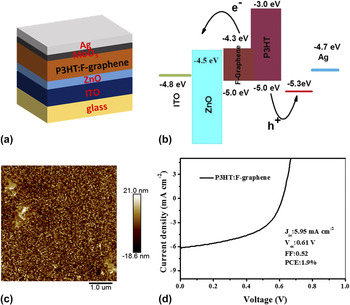
As schematically shown in Fig. 8(a), organic photovoltaic cells with the structure of ITO/ZnO/P3HT:F-graphene/MoO3/Ag were fabricated. A postfabrication annealing of the P3HT:F-graphene BHJ active layer was carried out at 150 °C for 10 min under N2, which does not only improve the morphology of the P3HT matrix but more importantly removes the residual functional groups in the graphene sheet to increase the conjugation length for enhancing the charge transport mobility. Figure 8(b) gives the energy level diagram for the P3HT:F-graphene device. The AFM was measured to investigate the morphology of BHJ layer. As shown in Fig. 8(c), the P3HT:F-graphene surface shows the homogeneous morphology, while the P3HT:GO (Fig. S5) presents an aggregation of GO attributing to the low dispersibility of GO in THF. To confirm existence of F-graphene in BHJ, the XPS spectra of P3HT:graphene (10:1) and P3HT:F-graphene (10:1) films were measured. As shown in Fig. S6(a), P3HT:F-graphene presents a sharp O1s peak in the spectra while P3HT:graphene shows rare O1s peak corresponding with the XPS of graphene and F-graphene. Because the content of N element in BHJ is rare, N element is hard to be detected. However, P3HT:F-graphene still presents a weak peak of N1s compared with P3HT:graphene film. The results show that F-graphene is existent in BHJ. Figure 8(d) shows the J–V curves for P3HT:F-graphene BHJ photovoltaic cells. As expected, the photovoltaic characteristics point out that the device with a ratio of 10:1(P3HT:F-graphene) shows a well photovoltaic performance exhibiting an open-circuit voltage (V oc) of 0.61 V, short-circuit current density (J sc) of 5.95 mA/cm2, fill factor of 0.52, and PCE (η) of 1.9%. Despite these promising results, the efficiency of the graphene-based OSC devices is still lower than the fullerene-based devices (over 10%). And the energy level differences of the donor and acceptor materials of the graphene-based system indeed prove to not match as well as in the polymer-fullerene BHJ. Therefore, extensive research in the design of new graphene-based acceptor with tailored band gap and their corresponding polymer donors is urgently needed.
(a) Schematic and (b) energy level diagram of ITO/ZnO/P3HT:F-graphene/MoO3/Ag photovoltaic device. (c) Tapping model of AFM height image of ITO/ZnO/P3HT:F-graphene surface. (d) Current voltage characteristics of the photovoltaic devices using P3HT:F-graphene as the active layer which were under the illumination of AM1.5G, 100 mW/cm2.

IV. CONCLUSIONS
A novel solution-processed functional graphene was synthesized through a simple method. And the F-graphene showed good solubility in the normal organic solvent. The photovoltaic devices were fabricated with a BHJ structure of ITO/ZnO/P3HT:F-graphene/MoO3/Ag. The highest PCEs of the devices using P3HT:F-graphene was 1.9%, with a composite ratio of 10:1. The sufficient photovoltaic performance of F-graphene, without any optimization, renders this novel graphene-based material as an alternative electron acceptor for OSC devices. It can be easily anticipated that its performance would be enhanced following the proper optimization.
Supplementary Material
To view supplementary material for this article, please visit http://dx.doi.org/10.1557/jmr.2016.243.
ACKNOWLEDGMENTS
This subject was financially supported by Natural Science Research Projects Funded of Anhui Colleges and Universities (KJ2015A224) and the Scientific Research Fund of Anhui Province Education Department (KJ2010B104).