1 Introduction
The use of the contingent valuation method (CVM) to accurately measure willingness-to-pay (WTP) measures continues to foster much debate in the environmental economics literature. An important subset of this discussion involves perceived survey respondent consequentiality to the CVM question in creating an incentive compatible survey mechanism and appropriately controlling for potential hypothetical bias inherent in the survey design. Hypothetical bias occurs when elicited stated behavioral intentions from survey respondents are not aligned with actual behavior. Over the past two decades, potential hypothetical bias from eliciting individuals’ WTP via a CVM framework has been an important element in the debate. Much of the debate revolves around the assertion that an elevated hypothetical bias is ingrained in CVM estimates. For example, Harrison and Rutström (Reference Harrison, Rutström, Plott and Smith2008) find a positive bias in 32 out of 39 observations, while List and Gallet (Reference List and Gallet2001) find respondents, on average, overstate their preferences by a factor of about three. More recently, Hausman (Reference Hausman2012) continued the criticism of the CVM technique by reviewing the empirical CVM literature, suggesting that CVM is “hopeless” with respondents inventing answers on the fly rather than responding out of stable or well-defined preferences.
However, providing evidence to the contrary, Carson, Flores, Martin and Wright (Reference Carson, Flores, Martin and Wright1996) examine CVM results with estimates from revealed behavior techniques, such as travel cost and hedonic models, and find no statistical difference between the two. Other studies support this view (see for example, Rosenberger & Loomis, Reference Rosenberger and Loomis2000; Whittington, Reference Whittington2010). Carson and Groves (Reference Carson and Groves2007) indicate that the CVM question is incentive compatible if the respondent cares about the policy (i.e., it influences their utility), the scenario they face is in the form of a binary, dichotomous choice question, and the respondent perceives the valuation question as consequential. If these conditions hold, then valuations elicited from stated preference surveys accurately reflect true WTP. So, for incentive compatibility to exist, respondents must perceive that their answers to preference questions will influence agency decisions concerning the public good presented in the survey. Carson, Groves and List (Reference Carson, Groves and List2014) suggest that when respondents perceive the survey as consequential, “their responses become revealed economic behavior”.
More recent work has investigated the impact of controlling for consequentiality on voting behavior and policy WTP estimates. Vossler and Watson (Reference Vossler and Watson2013) use a timely referendum in Massachusetts on local funding for a conservation and preservation program to compare survey responses from a CVM question to actual referendum voting. They find that if participants believe their responses have a chance of influencing policy then these voters are more likely to vote in favor of the policy, and WTP estimates elicited from a binary choice elicitation method are in line with those from financially binding incentive compatible treatments. Further, WTP estimates from consequential voters are significantly greater than those from inconsequential voters. In a design set-up similar to ours, Groothuis, Mohr, Whitehead and Cockerill (Reference Groothuis, Mohr, Whitehead and Cockerill2017) use a CVM framework to examine the effect of respondent consequentiality on a referendum vote about water conservation in North Carolina. They find that consequential voters are more likely to vote in favor of the policy, and that, like the finding of Vossler and Watson (Reference Vossler and Watson2013), consequential voters are willing to pay more than inconsequential voters. However, theory does not provide any predictions on the voting behavior for those for whom a survey response is not perceived as consequential.
While these studies consider the behavior of the average respondent in the sample, our objective is to expand previous research on respondent consequentiality and examine whether these results hold across subgroup populations. This investigation can be important for policy-based benefit-cost analyses (BCA) where appropriately identifying subgroup values may be required to estimate the net benefits of a new policy.
There are a number of studies that have investigated statistical differences in WTP for residents and nonresidents to a resource or public good.Footnote 1 However, we are interested in (1) examining residents’ and nonresidents’ perceptions of survey consequentiality; (2) examining the effect of residents’ and nonresidents’ perceptions of consequentiality on WTP for a public good; and (3) use our findings to infer behavioral differences across subgroups that are perhaps driving any differences in voting behavior. Combined, these steps enable the influence of perceived consequentiality on WTP estimates across subgroups to be examined for the first time. The purpose of which is to lay the foundations for future research to understand the potential causes of any differences in perceived consequentiality and voting behavior across subgroups, and to consider how to appropriately solicit accurate WTP values, by subgroup.
The public good in question in this research is artificial reef development in Florida coastal waters. Florida has the most active and diverse reef system in the United States. We develop two surveys (one for Florida residents and the other for nonresidents) with the heart of both surveys revolving around a hypothetical scenario regarding new state-level artificial reef development spending. The population of interest is Florida fishing license holders with resident and nonresident email addresses gathered from the Florida saltwater fishing license database. The surveys were administered using Qualtrics via email. From the survey responses, we develop a CVM model and estimate the value of new artificial reef development to both resident and nonresident reef users.
Overall, our results suggest improved construct validity for our resident, compared to nonresident, models. We find that residents’ and nonresidents’ perceptions of survey consequentiality are similar. However, its effect on voting behavior differs. Resident behavior is more in line with findings from other studies on aggregate behavior. Residents who perceive the survey to be consequential are more likely to vote for the reef development policy than those residents who perceive the survey to be inconsequential. This result is consistent with the “protest no” literature (Groothuis & Whitehead, Reference Groothuis and Whitehead2009). As a result, WTP estimates for consequential residents are greater than for inconsequential residents. In contrast, perceived consequentiality has no effect on nonresident voting. Further, WTP values for both consequential and inconsequential nonresident voters are not statistically different from each other.
From a BCA perspective, our results indicate that controlling for perceived survey consequentiality among a resident population provides appropriate WTP values for use in analyses. This is not necessarily the case for a nonresident population and more work is required to understand the influence of perceived consequentiality on nonresident voting behavior and how to appropriate accurate WTP values for this population subgroup.
2 Study area and background
Florida has long been engaged in the development of artificial reefs around its coastline. Hess, Rushworth, Hynes and Peters (Reference Hess, Rushworth, Hynes and Peters2005) stated that “Florida is in many ways an ideal state for engaging in reef building.” Its comparative advantage relative to other geographic locations includes the fact that ‘Its coastal waters are warm and shallow for many miles out toward sea,’ and that ‘Large areas of its coastal ocean have barren sand and mud bottoms with a surface climate suitable for nearly year-round marine activities.’ It is not surprising that the first two large ship reefings were in Florida waters. Specifically, these were the USS Oriskany, sunk off the Pensacola, FL, coastline in 2006, and the USS Vandenberg, sunk off Key Largo, FL, in 2009. After their sinking, the two vessels became the largest and second largest artificial reefs, deliberately sunk, in the world, respectively.
Both vessels were taken from the national defense reserve fleet. The fleet was established after World War II to serve as an inventory of vessels available for use in national emergencies and for national defense. As of August 2016, there were approximately 99 vessels in the fleet. Vessels are periodically examined and reclassified. During that process some are moved into a “nonretention” status and targeted for disposal. According to the U.S. Department of Transportation Maritime Administration vessel disposal program report, there were 14 vessels in nonretention status – MARAD vessels that no longer have a useful application and are pending disposition.
There are a number of options available for ship disposal including vessel donation and sale, dismantling (domestic and foreign recycling/scrapping), sinking as an artificial reef, and deep-sinking in the U.S. Navy SINKEX Program.Footnote 2 Hess et al. (Reference Hess, Rushworth, Hynes and Peters2005) examine the disposal options for the fleet of decommissioned vessels that were stored at various naval yards throughout the country at the time and concluded that reefing was the best option available. In particular, Hess et al. note that if one focuses on the costs and offsetting revenues associated with domestic recycling, international recycling, and reefing disposal options, reefing is “very promising” and one of the “least expensive” disposal options available to MARAD and the Navy. Hess et al. (Reference Hess, Rushworth, Hynes and Peters2005) also reiterated the potential benefits from the reef disposal option and suggested that communities might be willing to cost share in the disposal process due to fiscal benefits from use after reef establishment.
Deploying new artificial reefs comes at a considerable expense. For example, the cost of deploying large ship reefs is typically between $1 million and $9 million. These costs include environmental remediation and preparation, towing, and port fees. Due to the expense in reefing, large ship deployments are typically funded through a cost-sharing initiative between Florida Fish and Wildlife Conservation Commission (FWC) and county-level entities. A recent fully comprehensive report by Huth, Morgan and Burkhart (Reference Huth, Morgan and Burkhart2015), commissioned by FWC, indicated that the annual economic impact from diving and fishing activity on the reef system accrues approximately $5.6 billion in economic activity, creating 3,752 jobs.
We are aware of only three studies that have estimated use value with regard to artificial reefs. Milon (Reference Milon1989) and Johns, Leeworthy, Bell and Bonn (Reference Johns, Leeworthy, Bell and Bonn2001) both use contingent valuation questions to elicit use value for creating new artificial reefs. Milon estimates WTP for a new marine artificial reef site using several alternative incentive mechanisms and finds annual use values that range from $27 to $142. Johns et al. also utilize a contingent valuation methodology to estimate reef users’ value for maintaining artificial reefs in their existing condition, and for investing and maintaining “new” artificial reefs. In the survey, respondents were informed of a proposed new artificial reef program with no specific mention of the vessels/infrastructure that constituted the new reef. Results indicate diminishing marginal returns to increasing the size of the artificial reef system with annual use values per person for maintaining the existing reef of $75 compared to $24 for creating new artificial reefs. Finally, using dichotomous choice question responses from a sample of local and nonlocal users, Bell, Bonn and Leeworthy (Reference Bell, Bonn and Leeworthy1998) estimate a total annual use value (not diving specific) of $25.0 million for artificial reef use across the Florida Panhandle region.
3 Model
A contingent valuation method (CVM) is used to derive the WTP estimates. CVM is a stated preference survey technique widely used by economists to measure the value of public goods. A stated preference (SP) is a research participant’s statement of a future intention (an expectation) while a revealed preference (RP) is a research participant’s statement about what they have actually done in the past. Stated preference methods consist of exploring expected behavior to measure nonmarket values. Economists use both RP and SP methods to estimate the economic values of resources, such as artificial reefs. The idea behind CVM research is straightforward. Research participants are presented with a hypothetical market in which they can pay for a specified increase in a public good or pay to avoid a specified loss of a public good. Their WTP is contingent upon the hypothetical scenarios and markets described to them in the survey, hence the name “contingent valuation method” (Mitchell & Carson, Reference Mitchell and Carson1989).
Suppose survey research participants possess a utility function
 $u=u(x,h,z)$
, where
 $u$
is increasing in
 $x$
,
 $h$
, and
 $z$
;
 $x$
measures consumption of fishing trips on a Florida artificial reef system,
 $h$
captures the existence of artificial reefs (a public good), which is increasing in the number of available reefs, and
 $z$
is a composite commodity of market goods. The budget constraint is
 $y=z+px$
, where
 $y$
is income and
 $p$
is the money cost of fishing consumption, including fees and costs of travel to reef sites. The price of the composite commodity is normalized to one and the existence of artificial reefs is an unpriced nonmarket good.
Solving the utility maximization problem yields the indirect utility function,
 $u=v(p,h,y)$
, which is decreasing in
 $p$
and increasing in
 $h$
and
 $y$
. The willingness to pay,
 $\mathit{WTP}$
, for additional artificial reefs, resulting from additional reef funding, is implicitly defined as the payment that equates indirect utility with different levels of artificial reef availability,
 $$\begin{eqnarray}\displaystyle v(p,h^{0},y)=v(p,h^{\prime },y-WTP), & & \displaystyle\end{eqnarray}$$
where
 $h^{0}$
is the current level of artificial reef availability and
 $h^{\prime }$
is the improved artificial reef availability.
Willingness to pay can also be correlated to personal and demographic characteristics, such as gender, age, education, and behavioral characteristics, like reef preferences. This enables the components that potentially influence individuals’ WTP to be analyzed.
To examine the effect of consequentiality on WTP, we develop a standard probability model
 $$\begin{eqnarray}\displaystyle P(\,\mathit{yes}=1)=\unicode[STIX]{x1D719}(\unicode[STIX]{x1D6FC}_{0}+\unicode[STIX]{x1D6FC}_{1}\,\mathit{fee}+\unicode[STIX]{x1D739}^{\prime }\boldsymbol{X}+e), & & \displaystyle\end{eqnarray}$$
where
 $\mathit{yes}$
is equal to 1 if the respondent votes in favor of the referendum,
 $\mathit{fee}$
is the randomly assigned increase in annual fishing license fees,
 $\unicode[STIX]{x1D6FC}_{0}$
is a constant,
 $\unicode[STIX]{x1D6FC}_{1}$
is the coefficient on the bid variable,
 $\boldsymbol{X}$
is a vector or explanatory variables with the corresponding vector
 $\unicode[STIX]{x1D739}$
.
The probability model is then augmented as
 $$\begin{eqnarray}\displaystyle P(\,\mathit{yes}=1)=\unicode[STIX]{x1D719}(\unicode[STIX]{x1D6FC}_{0}+\unicode[STIX]{x1D6FC}_{1}\,\mathit{fee}+\unicode[STIX]{x1D739}^{\prime }\boldsymbol{X}+\unicode[STIX]{x1D711}C+e), & & \displaystyle\end{eqnarray}$$
with
 $\unicode[STIX]{x1D711}$
is the coefficient on a consequentiality dummy,
 $C$
. Based on the research from lab and field experiments, plus CVM studies, a priori expectations are that
 $C$
is positive and statistically significant (see Landry & List, Reference Landry and List2007; Vossler & Evans, Reference Vossler and Evans2009; Vossler & Watson, Reference Vossler and Watson2013; Groothuis et al., Reference Groothuis, Mohr, Whitehead and Cockerill2017).
Carson and Groves (Reference Carson and Groves2007) suggest that strong consequentiality involves both policy consequentiality and payment consequentiality. Payment consequentiality exists when the respondent perceives that there is a nonzero probability that they will have to pay the bid amount. Both policy and payment consequentiality can have implications on WTP measures. To assess whether payment consequentiality is an issue in our sample, we ran a bivariate probit model that included the fee variable in both the “for equation” (dependent variable is our binary yes variable) and also in the second “consequentiality equation” (dependent variable is the consequentiality dummy). The fee variable in the second equation then captures the influence of payment consequentiality. We found that the coefficient on the fee variable in the consequentiality equation to be insignificant so as the fee increases, there is no significant change in perceived consequentiality, rejecting the idea of payment consequentiality in our sample. We therefore focus our attention solely on policy consequentiality.
4 Survey
To assess residents’ and nonresidents’ WTP for artificial reef development, two surveys were developed, distributed via email using email addresses provided by resident and nonresident fishing license holders and available from the FWC license database as described above. As such, the target population for the two surveys was Florida resident and nonresident fishing license holders. The CVM policy question and random fee assignment values were the same across surveys. The surveys began with questions designed to elicit individuals’ fishing/diving activity information. Questions on individual attributes (gender, education level, etc.) were also asked, as were questions on respondents’ attitudes and beliefs regarding the existing reef system.
The critical part of the resident and nonresident surveys from a valuation perspective is the hypothetical scenario from which a valuation for new artificial reef development can be estimated. The research participants were informed in the survey as follows:
“Suppose that the Florida Legislature increases the funding available to Florida Fish and Wildlife to support new artificial reef development around the state but requires local areas to share in the cost of the new reefs and that cost share would take the form of an increase in your saltwater fishing license fee of $fee. If a referendum of Florida fishing license holders was held on the fee increase and if at least 50% vote for the fee it will be put into practice would you vote FOR the fee increase?”
where $fee was varied randomly across research participants with each participant receiving either a fee increase of either $1, $5, $15, $25, $35, or $50.
To test for consequentiality we ask respondents to rank their level of agreement/disagreement to the follow-up statement:
“I believe that the results from this survey could affect decisions about artificial reef policy in Florida.”
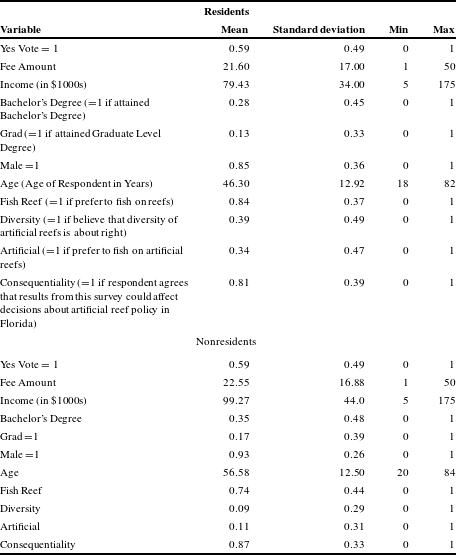
Respondents were asked to rank their response to the statement from 1 (strongly disagree) to 5 (strongly agree). Table 1 presents a summary of the demographic variables collected. For residents (nonresidents), the average age is 46 (57) years and average income is $79,000 ($88,000). The average respondent is male with 85% (93%) having earned a bachelor’s degree or higher. We also asked respondents a series of attitudinal questions about the existing reef system. Both residents and nonresidents seem to think that more artificial reef development is warranted as the majority of both groups disagree to the statements that the number of artificial reefs, and the diversity is about right and that the State of Florida is investing too many resources into artificial reef development. Also, for both residents and nonresidents, the majority of respondents fish on the artificial reef system but would rather fish on a natural reef than an artificial one.
Descriptive statistics.

The surveys were conducted in the summer of 2014. FWC provided the sampling frame, which was comprised of Florida saltwater fishing license database records. Approximately 86% of user licenses were residents and 14% were nonresidents. We sent 337,106 emails to residents and 64,062 to nonresidents, receiving 5,138 survey responses from residents and 1,220 survey responses from nonresidents. This led to a 1.5% response rate among residents and a 2% response rate among nonresidents. While low, our sample demographics compare favorably with other sampling efforts of the Florida fishing population.
5 Results
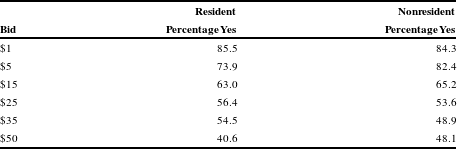
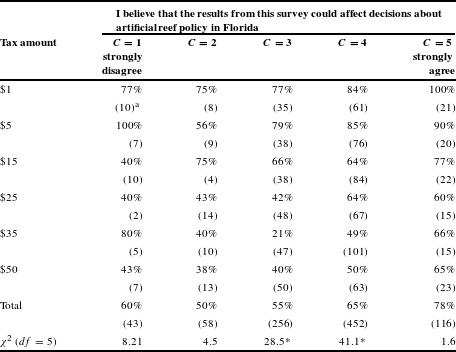
Before analyzing the main results, Table 2 shows that responses from both subgroups exhibit consistently downward sloping bid functions, which is consistent with economic theory.
Resident and nonresident bid functions.

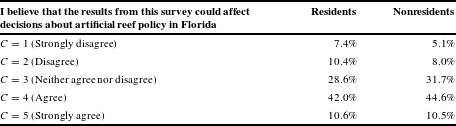
The first part of the analysis examines whether survey consequentiality perceptions are the same or different across resident and nonresident subgroups (see Table 3). The distribution is strikingly similar across consequentiality levels with approximately 82% and 87% of respondents, respectively, not disagreeing nor agreeing (
 $C=3$
), or agreeing/strongly agreeing (
 $C=4$
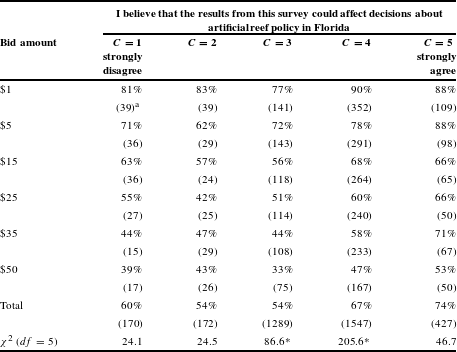
or 5) that they believe the results of the survey could affect decisions about artificial reef policy in Florida. Further, Table 4 (Table 5) shows the distribution of yes responses across consequentiality levels and fee amounts for residents (and nonresidents). The distribution is similar for both subgroups. In terms of defining consequentiality for use in the model, the literature suggests a knife-edge result exists where respondents’ perceptions of a survey’s consequentiality tip from at least consequential to inconsequential (Vossler & Watson, Reference Vossler and Watson2013). Using a chi square test, we test for equal frequencies of yes votes across fee amounts. For both residents and nonresidents, for low levels of consequentiality, as the fee increases, the percentage of yes votes is not statistically different. This suggests that, for both subgroups, those respondents that perceive a consequentiality level equal to 1 or 2 do not find the survey mechanism to be consequential. However, for higher levels of consequentiality (
 $C=3$
, 4, and 5) the percentage of yes votes decreases as the fee amount rises at the 95% confidence level. Based on these findings and the work of Groothuis et al. (Reference Groothuis, Mohr, Whitehead and Cockerill2017) that elicit consequentiality using the same type of five-point scale, we code consequentiality as equal to one for respondents that “at least” neither agree nor disagree to our consequentiality statement (
 $C=3$
, 4, or 5). As such, any responses from respondents that do not agree or strongly disagree that the results could affect decisions about artificial reef policy in Florida are considered as inconsequential and coded as a zero (
 $C=1$
or 2). To strengthen our argument, we ran chi square tests of independence to compare the distributions of yes frequencies by consequentiality over the two samples. Chi square test statistics indicated that we cannot reject the null that the distributions are independent of the sample (
 $p=0.767$
).
Level of perceived consequentiality (percentage), by subgroup.

Resident frequency of Yes responses by bid amount and level of consequentiality.

* Significant at the 95% confidence level.
a Sample size in parentheses.
Nonresident frequency of Yes responses by bid amount and level of consequentiality.

* Significant at the 95% confidence level.
a Sample size in parentheses.
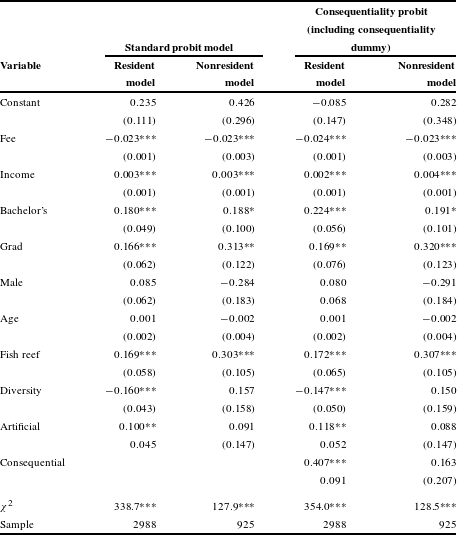
Next, given that both subgroups of respondents have similar perceptions of survey consequentiality, we investigated the determinants of WTP for both subgroups. Table 6 presents a standard probit model. As expected, the coefficient on the fee amount is negative and statistically significant for both subgroups, so as the fee amount increases, the probability of a respondent voting in favor of the policy falls. Other coefficient estimates indicate some similarities across subgroups in terms of the determinants of WTP. Both residents and nonresidents with higher income and education levels are more likely to be in favor of the policy. Further, respondents in both groups are more likely to say yes to an increase in funding for the artificial reef program if they fish the reef system. Gender and age do not appear to influence the response for either subgroup. Differences in WTP determinants are also evident. For example, residents that currently believe that the diversity of the reef system is “about right” are less likely than nonresidents to be in favor funding more artificial reef development, however they are more likely to vote in favor of the policy if they prefer to fish on artificial, as opposed to, natural reefs.
Probit models.

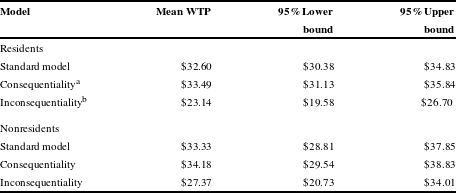
Using the coefficient estimates from the standard probit model, mean WTP values are calculated at the sample means of covariates (see Table 7). Nonresidents are willing to pay marginally more for artificial reef development, on average, than residents ($32.60 for residents and $33.33 for nonresidents), but the difference is not statistically significant. These mean annual WTP measures are in line with one of the few studies assessing reef user values for additional reef development (see for example, Milon, Reference Milon1989).
Willingness-to-pay estimates.

a Respondents that perceive the survey question to be consequential.
b Respondents that perceive the survey question to be inconsequential.
The important findings from this research come from combining the results from our probit models of voting behavior (Table 6) and the WTP estimates (Table 7). We are interested in examining differences in perceived consequentiality on voting behavior and WTP values. In Table 6, we augment the standard model to identify differences in the impact of perceived consequentiality on resident and nonresident voting behavior. Columns 4 and 5 in Table 6 add a consequentiality dummy to the standard probit model. Results from Table 6 show that for residents, as previous research suggests, consequentiality matters. That is, consequential residents, perceiving that their responses could affect decisions about artificial reef policy in Florida are more likely to vote in favor of increasing funding to support additional artificial reef development. This result is in line with Groothuis et al. (Reference Groothuis, Mohr, Whitehead and Cockerill2017), who showed that respondent perceived consequentiality increases the likelihood of voting in favor of a water conservation policy. In terms of WTP estimates, findings from Vossler and Watson (Reference Vossler and Watson2013) and Groothuis et al. (Reference Groothuis, Mohr, Whitehead and Cockerill2017) indicate that CVM surveys elicit higher WTP values from consequential respondents than inconsequential. One possible explanation for this result is that inconsequential residents reject the policy scenario and answer with a protest no (or a protest zero) vote. Generally, respondents’ protest no bids are motivated by some objection to the survey design. Not perceiving the survey to be consequential is one potential component of the survey that may elicit protest no responses. From our WTP estimates, we observe that resident behavior is more in line with a priori expectations than that of nonresidents. Specifically, inconsequential resident WTP values are significantly lower than those of consequential residents, however there is no statistical difference in WTP values for nonresidents, by consequentiality type.
Overall, our results suggest improved construct validity for our resident, compared to nonresident, models. Carson, Flores and Meade (Reference Carson, Flores and Meade2001) describe construct validity as “how well the measurement is predicted by factors that one would expect to be predictive a priori.” Our findings are clearly suggestive of residents’ voting behavior being in line with a priori expectations, but not so for nonresidents. For example, Carson et al. (Reference Carson, Flores and Meade2001) describe how perception variables related to the provision of the good tend to be predictive of respondent WTP in the expected manner. So, those perceiving that the survey will influence policy and the provision of more funding for artificial reef development should be more inclined to vote in favor of the policy and exhibit a higher WTP. We find this for residents only. Other results also suggest improved construct validity for the resident models. For example, income is a positive and statistically significant determinant of WTP in the resident models, as one would expect a priori. Also, there is consistently less noise in the 95% confidence intervals for resident WTP values than for nonresidents.
From a benefit-cost perspective, our findings raise questions on how to elicit appropriate WTP estimates across subgroups. While of course more studies are required to validate our results, we find that the resident population behavior is in line with expectations and controlling for consequentiality should provide accurate WTP measures for use in a BCA. More research is required though to understand the voting behavior of a nonresident population and to estimate appropriate WTP measures for this subgroup.
6 Conclusion
Recent research has investigated the impact of controlling for consequentiality on voting behavior and policy WTP estimates. Findings from this research inform that respondents that perceive a survey question as consequential are more likely to vote in favor of a policy and that WTP estimates elicited from a binary choice elicitation method are in line with those from financially binding incentive compatible treatments. Further, consequential voters are willing to pay more than inconsequential voters.
The purpose of this research is to examine both resident and nonresident valuation of a public good. While there are a number of studies that have investigated statistical differences in WTP across these subgroups, we are interested in examining residents’ and nonresidents’ perceptions of survey consequentiality and its effect on WTP estimates for a public good. We developed two online surveys of resident and nonresident Florida fishing license holders to elicit reef preferences and attitudes, socio-demographic details, and to ask the same referendum question regarding a new policy for additional funding for artificial reef development. We find that residents and nonresidents have similar perceptions of survey consequentiality when asked if they thought that the results of the survey could affect decisions about artificial reef policy in Florida. However, overall, we find improved construct validity with our resident models over the nonresident models. In line with expectations, residents are more likely to vote in favor of the policy if they perceive the survey as consequential. For nonresidents, the perceptions of consequentiality do not impact voting behavior in our referendum question.
Also, in line with other research on average voter behavior, WTP values for inconsequential resident voters are lower than the pooled average. This suggests that inconsequential resident voters are responding to the policy with protest no votes. In contrast, WTP point estimates for both nonresident consequential and inconsequential are not statistically different.
From a benefit-cost perspective, our findings are especially important if appropriately identifying both residents’ and nonresidents’ WTP values are a critical component in measuring the net present value of a given policy. Our results indicate that controlling for perceived survey consequentiality among a resident population provides appropriate WTP values for use in analyses. This is not necessarily the case for a nonresident population and more work is required to understand the influence of perceived consequentiality on nonresident voting behavior and how to appropriate accurate WTP values for this subgroup.
Finally, with approximately 927,000 resident FWC fishing license holders (in 2014 – the year of our study), and 143,000 nonresident license holders, our WTP estimates indicate an annual aggregate WTP for additional artificial reef development of approximately $35 million. This assumes, rather conservatively, that all those reef users that do not have a FWC fishing license have a zero WTP. The sinking costs associated with recent large ship reefing projects (including environmental remediation and preparation, towing, and port fees) have been in the vicinity of between $1 million and $9 million. This suggests that the aggregate benefits of new artificial reef development cover the cost of at least four large ship reefing deployments every year (depending on vessel size and reefing location).