

Experimental
The present study was aimed to study the extent of diversity available in horsegram (Macrotyloma uniflorum (Lam.) Verdc.) collected from diverse altitudes of Himalayan region. A total of 54 landraces of horsegram were collected from three altitudinal zones of Uttarakhand Himalayas viz., 12 from lower hills (up to 1100 m above mean sea level (MSL)), 28 from mid hills (between 1100 and 1500 m above MSL) and 14 from higher hills (>1500 m above MSL), and grouped as group ‘A’, ‘B’ and ‘C’, respectively. These germplasm lines were evaluated for nine quantitative traits during Kharif 2004 along with two checks HP Kulthi-1 and VL Gahat-1 distributed randomly in each block of ten test entries in augmented block design at Vivekananda Parvatiya Krishi Anusandhan Sansthan experimental farm, Hawalbagh, Almora (28°0.9′N and 79°0.30′E at an elevation of 1250 m above MSL), using recommended cultural practices.
Data on the number of primary branches, plant height, pods per plant and grain yield per plant were taken on five randomly selected plants. Pod length and number of seeds per pod were recorded on ten pods selected randomly from the harvest of five plants. Hundred grains were selected randomly and weighed. Days to 50% flowering and physiological maturity were recorded on plot basis. The adjusted mean of quantitative traits was obtained from the methods of Peterson (Reference Peterson1985). The descriptive statistics for each quantitative trait were calculated for each group using standard statistical procedures. Variation within group expressed as coefficient of variation (CV; Zhong and Qualset, Reference Zhong and Qualset1995) was calculated for each trait and group. The differences between means of the different groups were assessed by Duncan's multiple range tests at 5% probability (Duncan, Reference Duncan1955).) First and second principal component (PC) axes scores of the PC analysis (Rao, Reference Rao1974) were plotted to visualize altitudinal group differences.
Discussion
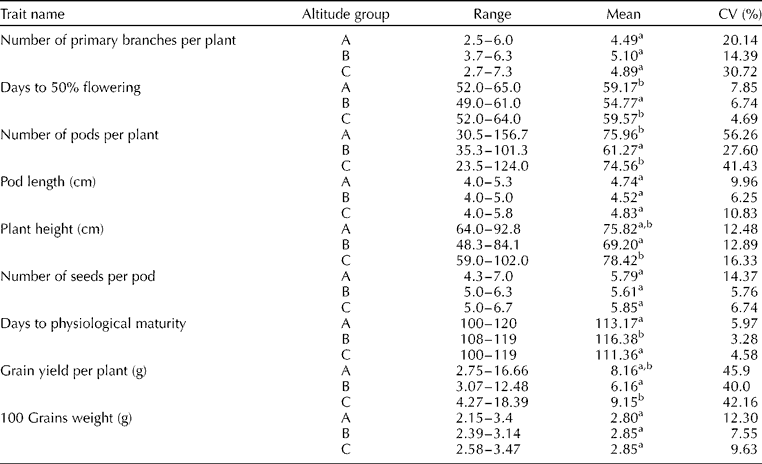
The maximum mean CV% (Table 1) was recorded for group ‘A’ (18.61%), followed by group ‘C’ (18.56%) and group ‘B’ (13.82%). The farming situation at lower and higher hills was more diverse than mid hills; this could be one of the reasons for the presence of high CV% at lower and higher hills. Correlation coefficient between PC score and adjusted mean value of the traits revealed that all the characters except pod length significantly contributed to the scores of PCI and PCII.
Range, mean and CV% of quantitative in different altitude groups

Means followed by same letters indicate non-significant differences. Means followed by different letters indicate significant differences at P = 0.05. Differences between means of different groups were tested by Duncan test.
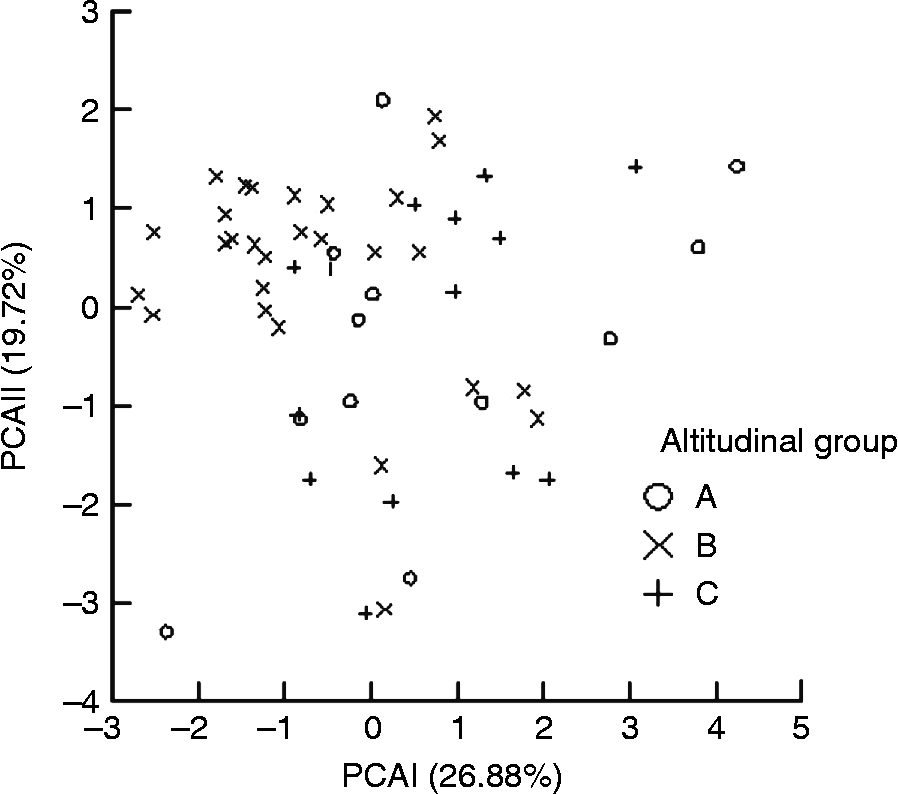
Group ‘B’ scored < 0 on PCAI and>0 on PCAII axes, and group ‘C’ scored>0 on PCAI and < − 1 on PCAII axes. Group ‘A’ was intermediate between groups ‘B’ and ‘C’. The biplot of PCI and PCII scores distributed accessions according to altitudinal groups (Fig. 1) with some degree of overlapping. There was dispersion among the accessions collected from different altitudes, but some degree of similarity was found among the landraces collected from mid hills. Ninety per cent of agriculture in mid hills is rainfed, and Demissie and Bjόrnstad (Reference Demissie and Bjόrnstad1996) reported that agro-ecological zones with high levels of stress factors tend to exhibit more homogenous genotypes and less degree of variation. However, years of farmer's selection for adaptation to unfavourable weather under similar climatic conditions had reduced the diversity in the horsegram accessions collected from same altitudinal group. High variability was recorded among the landraces collected from different altitudes. Such variability among the groups could arise due to different selection pressure practiced at different altitudes by the farmers. This indicates that altitude influences the selection criteria. Farmers in lower and higher hills select the landraces having high grain yield coupled with less reproductive phase duration and taller in nature. This can be inferred that selection in different altitude was based on life cycle pattern of the accessions and its relationship with physical environment. The high variability in agronomic traits among accessions of different origin groups indicates that horsegram landraces are adapted to specific zone. The altitude-based diversity was also reported by Manyasa et al. (Reference Manyasa, Silm, Githiri and Christiansen2008) in pigeon pea and Rojas et al. (Reference Rojas, Barriga and Figueroa2000) in chenopodium.
Scatter plot of 54 horsegram accessions using PCAI and PCAII scores (value in parenthesis explains percentage of variation).

Analysis and evaluation of various socio-economic, environmental and scientific challenges (Bisht et al., Reference Bisht, Mehta and Bhandari2007) are essential, so that agricultural activities could be reoriented towards better use of local resources in Himalayan agroecosystems.
Acknowledgements
The authors thank Drs K. P. Viswanatha and B. G. Prakash from Bangalore and Bijapur (India) for critically examining and improving the manuscript.