

State of the art
A general overview of binding methodologies
Life is based on molecular interactions, where binding of specific molecular partners is critical to the function of biological systems. These interactions can be characterized by binding parameters such as: the affinity (dissociation constant K D) and kinetic dissociation (off-rate or k off) or association (on-rate or k on) constants; which give important information about the binding dynamics between molecules. This information is closely related to the energy landscape of the binding process (Tinoco et al., Reference Tinoco, Sauer, Wang, Puglisi, Harbison and Rovnyak2013) and can be useful for drug development, where the first step is to study the binding of different compounds to a particular target.
Methods classically used to investigate biomolecular interactions are mostly performed in standard ensemble-based studies (or in multiplo), where population-average binding parameters are obtained due to the stochastic behavior of binding processes. Some of these methods are fluorescence studies, such as polarization changes in a tryptophan environment (Ghisaidoobe and Chung, Reference Ghisaidoobe and Chung2014; Singha Roy et al., Reference Singha Roy, Dinda, Chaudhury and Dasgupta2014), or detecting changes in the emission of fluorescence-labeled proteins; surface plasmon resonance, where changes in light are measured while reflecting off functionalized gold surfaces (Misselwitz et al., Reference Misselwitz, Staeck and Rapoport1998); nanorheology, which measures the elastic properties of a protein (Casanova-Morales et al., Reference Casanova-Morales, Quiroga-Roger, Alfaro-Valdés, Alavi, Lagos-Espinoza, Zocchi and Wilson2018b); and electrophoretic mobility shift assays, in which changes in displacement is measured in gels after binding (Fillebeen et al., Reference Fillebeen, Wilkinson and Pantopoulos2014); among many others. Most of these studies on protein–protein interactions focus on characterizing binding parameters using molecules in a solution, under thermal equilibrium, and free of external forces (O'Shannessy, Reference O'Shannessy1994; Li et al., Reference Li, Jiang, Nagarajan, Wohlhueter, Selvaraj and Zhu2007). The average binding parameters obtained by in multiplo techniques can often hide interesting interactions that can be observed at the single-molecule level (in singulo) (Bustamante, Reference Bustamante2008).
In singulo studies have become increasingly popular in recent years because they can be used to follow the behavior of an individual molecule through time. Thus, it is possible to obtain not just the average behavior of many molecules, but rather the behavior of an individual of that population. This has opened a window into many cellular processes in which only a small subset of molecules participate (e.g. DNA transcription), and can exhibit behavior that is very different than that of the ensemble average. Thus, in multiplo studies do not portray a complete picture of the fluctuations that can arise in cellular processes (Bustamante, Reference Bustamante2008) and can hide essential mechanisms at play in intermolecular interactions that can be identified with in singulo studies.
Measurement of forces to study binding in biochemical reactions
Another important advantage of in singulo studies is the possibility to apply and measure mechanical forces. Usually, reactions are studied by means of manipulating several thermodynamic parameters, such as: temperature (Baez et al., Reference Baez, Wilson, Ramírez-Sarmiento, Guixé and Babul2012), chemical concentration (Casanova-Morales et al., Reference Casanova-Morales, Alavi, Wilson and Zocchi2018a), and pressure (Akasaka et al., Reference Akasaka, Kitahara and Kamatari2013). All of these macroscopic variables may change the kinetic parameters of the reactions; the application of force can microscopically alter the same parameters. Since the very early studies of binding, there has been a clear relationship between forces and affinity. Antoine Lavoisier and Marie Anne Pierrette, in their seminal book Elements of Chemistry, use affinity and force indistinctly (Lavoisier, Reference Lavoisier1790). By focusing on force, the reaction coordinate becomes an easily quantifiable physical parameter, such as the end-to-end distance of a stretched molecule (Bustamante et al., Reference Bustamante, Chemla, Forde and Izhaky2004; Tinoco, Reference Tinoco2004).
In a physiological context, protein–protein interactions generally occur under non-equilibrium conditions and between molecules anchored to surfaces, such as the cell membrane or the extracellular matrix (Stout, Reference Stout2001). Moreover, the bonds supporting protein–protein interactions in vivo can be in mechanical stress produced by either external (e.g. shear flow) or internal (e.g. actin cytoskeleton contraction) sources (Pollard and Borisy, Reference Pollard and Borisy2003; Fournier et al., Reference Fournier, Sauser, Ambrosi, Meister and Verkhovsky2010). For example, during tumor metastasis, cancer cell adhesion to the vascular endothelium is exposed to the hemodynamic force caused by blood flow. Additionally, during migration, cells tug on each other and exert traction forces on the molecular interactions that maintain cell–cell adhesion (Ananthakrishnan and Ehrlicher, Reference Ananthakrishnan and Ehrlicher2007). It has long been recognized that forces control such molecular bonds by regulating their dissociation kinetics (Bell, Reference Bell1978). Theoretical models and experimental observations have described a wide variety of mechanical responses in which the force applied to disrupt an interaction can accelerate (slip bond), slow down (catch bond),- or have no impact (ideal) on the bond dissociation (Dembo et al., Reference Dembo, Torney, Saxman and Hammer1988; Zhu Reference Zhu2014). Interestingly, several studies have identified new classes of interactions in which the force-regulated bond dissociation is more complex, including dynamic catch bonds (Fiore et al., Reference Fiore, Ju, Chen, Zhu and Barker2014) and flex-bonds (Kim et al., Reference Kim, Zhang, Zhang and Springer2010). Experimentally, the force-dependent dissociation of two or more interacting proteins can be achieved by using single-molecule force spectroscopy techniques (described below), which have been widely employed to describe how mechanical cues regulate molecular interactions (Yuan et al., Reference Yuan, Chen, Kolb and Moy2000; Stangner et al., Reference Stangner, Wagner, Singer and Kremer2013). Details about the energy landscape of the dissociation process can be extracted from these force-induced protein–protein unbinding studies, including the thermodynamics and kinetics of bond rupture, as well as the specificity of interaction between proteins (Stangner et al., Reference Stangner, Wagner, Singer and Kremer2013; Burgos-Bravo et al., Reference Burgos-Bravo, Figueroa, Casanova-Morales, Quest, Wilson and Leyton2018).
Experiments of binding at the single-molecule level
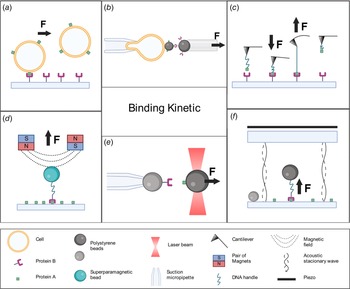
Several innovative methods have been used to monitor individual bond formation and dissociation, providing unique insights into molecular mechanisms. Techniques that allow direct visualization of single-molecule interactions without the application of force include fluorescence correlation spectroscopy and fluorescence cross-correlation spectroscopy. Techniques using force to manipulate single-binding events include laminar flow chambers (Alon et al., Reference Alon, Hammer and Springer1995; Robert et al., Reference Robert, Benoliel, Pierres and Bongrand2007) and molecular force spectroscopy. The most common force-based tools are biomembrane force probes (BFPs; Evans et al., Reference Evans, Ritchie and Merkel1995; Merkel et al., Reference Merkel, Nassoy, Leung, Ritchie and Evans1999), atomic force microscopy (AFM; Florin et al., Reference Florin, Moy and Gaub1994; Lee et al., Reference Lee, Kidwell and Colton1994b; Hinterdorfer et al., Reference Hinterdorfer, Baumgartner, Gruber, Schilcher and Schindler1996), magnetic tweezers (MTs; Danilowicz et al., Reference Danilowicz, Greenfield and Prentiss2005; Shang and Lee, Reference Shang and Lee2007; Kilinc et al., Reference Kilinc, Blasiak, O'Mahony, Suter and Lee2012), acoustic force spectroscopy (AFS; Sitters et al., Reference Sitters, Kamsma, Thalhammer, Ritsch-Marte, Peterman and Wuite2014), and optical tweezers (OTs; Nishizaka et al., Reference Nishizaka, Tadakuma, Kato, Miyata and Kinosita1996; Rinko et al., Reference Rinko, Lawrence and Guilford2004; Litvinov et al., Reference Litvinov, Bennett, Weisel and Shuman2005). In this article, we provide an overview of the different force-applying techniques used to study biomolecular interactions at the single molecule. Additionally, an extensive description of distinct biological assays that OTs enable is described, followed by a novel and detailed methodology to perform binding experiments using a compact and user-friendly OT instrument commercially known as miniTweezers (Smith et al., Reference Smith, Cui and Bustamante2003); see Fig. 1e.
Single-molecule force spectroscopy techniques. (a) Laminar flow chamber: a laminar flow exerts a force in the direction of the arrow causing rupture events between a ligand (protein A, green square) bounded to a cell, and a receptor (protein B, purple) coated to a surface. (b) BFP: a bead coated with ligands is attached to a transducer cell held by a suction micropipette. A second bead bearing receptors is brought into contact with the first bead and then retracted in the direction of the arrow, the deformation of the cell transducer caused by the rupture event is measured. (c) AFM: a cantilever bearing a ligand tethered to a dsDNA handle is allowed to bind a receptor-coated surface (arrow pointing down), during the retraction process (arrow pointing up) the bending of the cantilever caused by the strength of the interaction between the proteins is measured. (d) MTs: a superparamagnetic bead (in blue) bearing a receptor tethered to a dsDNA handle is manipulated with a magnetic field (dashed lines) caused by pairs of magnets. The bead is brought into a ligand-coated surface, and the binding force is measured during the retraction process as indicated by the arrow. (e) OTs: a ligand-functionalized bead is trapped and manipulated by light beams. The trapped bead is brought into contact with a receptor-functionalized bead held by a suction micropipette. During the retraction process (arrow direction), the interaction rupture force is measured. (f) AFS: a bead bearing a receptor tethered to a dsDNA handle is allowed to contact the bottom glass coated with ligands. The piezo element generates an acoustic wave that is reflected by the bottom glass (dashed curve), producing a standing wave. The bead exposed to this standing wave experiences a force (indicated by arrow) causing the rupture event. An immobilized bead at the bottom glass is used to determine the position of the bead experiencing force.

Laminar flow chambers
The basic principle of studying molecule interactions with laminar flow chambers consists of monitoring the trajectories of a receptor bound to a cell or particle along a ligand-coated surface in the presence of a laminar flow (Robert et al., Reference Robert, Benoliel, Pierres and Bongrand2007; Zohra, Reference Zohra2021). The cell or particle is tethered to a surface and subjected to a hydrodynamic force (see Fig. 1a). The interaction frequency (e.g. the number of binding events per second), and the detachment kinetics (e.g. the fraction of particles remaining bound as a function of time after arrest) can be obtained from this assay (Pierres et al., Reference Pierres, Benoliel and Bongrand2008). This approach resembles the in vivo conditions of several protein–protein interactions, such as the binding between endothelial cell selectins and their glycoprotein ligands on leukocytes. Selectin interactions were the first molecules studied at the single-bond level with laminar flow chambers. Here, a rapid dissociation constant of 1 s−1 was reported for the binding between selectins and P-selectin glycoprotein ligand 1 (PSGL-1; Alon et al., Reference Alon, Hammer and Springer1995). This technique has been widely used to investigate cellular processes that involve protein–protein interactions (e.g. cell adhesion or migration), respond to shear forces (Polacheck et al., Reference Polacheck, Charest and Kamm2011; Shemesh et al., Reference Shemesh, Jalilian, Shi, Heng Yeoh, Knothe Tate and Ebrahimi Warkiani2015). Additionally, this method has also been implemented to characterize single-molecule interactions, for example, between streptavidin and biotin (Pierres et al., Reference Pierres, Touchard, Benoliel and Bongrand2002). See Fig. 1a.
Single-molecule force spectroscopy techniques
Biomembrane force probe. BFP is a versatile method that can be used in a wide range of forces (10−1–103 pN) and loading rates (1–106 pN s−1) (Gourier et al., Reference Gourier, Jegou, Husson and Pincet2008). This technique consists of using cell-sized membrane capsules like vesicles, liposomes, or red blood cells (RBCs) as force transducers (Sung et al., Reference Sung, Sung, Crimmins, Burakoff and Chien1986; Shao Reference Shao2004). The membrane capsule is held in place by a suction micropipette, and a protein-coated bead can be attached to the force probe (Ungai-Salánki et al., Reference Ungai-Salánki, Peter, Gerecsei, Orgovan, Horvath and Szabó2019). This bead can then form the bond to be studied with a target, such as another bead, a vesicle, or a living cell, also held in place. The force measurements consist of automatized retraction–contraction cycles between the ligand-functionalized probe (i.e. bead connected to the soft spring RBCs) and target-bearing receptors (Gourier et al., Reference Gourier, Jegou, Husson and Pincet2008). During the retraction step, the bond is subjected to a tension force that stretches the transducer. This deformation is measured by precise video tracking of the bead joined to the transducer. These experiments allow the measurement of parameters like dissociation rates and transition state parameters such as the distance to the energy barrier (Brampton et al., Reference Brampton, Wahab, Batchelor, Allen and Williams2011). Using BFP, several works have characterized the mechanical responses of different biomolecular interactions to external forces. For instance, Evans and coworkers used BFP to study the impact of pulling on cell surface bonds, such as how the pairing of P-selectin and PSGL-1 propagates and alters receptor-cytoskeletal linkage beneath the membrane. They described that PSGL-1 detaches from cytoskeleton prior to failure of the exterior adhesive P-selectin:PSGL-1 bond (Evans et al., Reference Evans, Heinrich, Leung and Kinoshita2005; Evans and Kinoshita, Reference Evans and Kinoshita2007). Additionally, catch-slip behavior was identified for the interaction between PSGL-1 and P-selectin (Evans et al., Reference Evans, Leung, Heinrich and Zhu2004). In another example, Perret and coworkers tested the homophilic interaction between E-cadherins molecules and opposing cells (Perret et al., Reference Perret, Leung, Feracci and Evans2004). Furthermore, BFP has been used to study the intercellular adhesion molecule-1 (ICAM-1) with recombinantly activated αLβ2 integrin by divalent cations (Evans et al., Reference Evans, Kinoshita, Simon and Leung2010). BFP also allows quantifying how force and different conformations of lymphocyte function-associated antigen-1 regulate kinetics binding parameters with ICAM-1 (Chen et al., Reference Chen, Lou and Zhu2010). See Fig. 1b.
Atomic force microscopy. AFM is a technique that works in a force range of 10–104 pN. It is unique in its ability to apply forces as high as nanonewtons. However, it is limited in its lower force resolution (lower than piconewtons) (Neuman and Nagy, Reference Neuman and Nagy2008). The basic principle consists of coating both the tip of a microfabricated cantilever and a substrate surface with a low density of interacting molecules of interest (Robert et al., Reference Robert, Benoliel, Pierres and Bongrand2007). The cantilever tip is brought to the surface of the substrate, so that the coated cantilever interacts with the substrate. This results in a mechanical force that will cause the cantilever to bend. Meanwhile, a laser beam that is reflected at the top of the cantilever is used to monitor the bending angle of the cantilever (Fuhrmann and Ros, Reference Fuhrmann and Ros2010), which gives a measurement of force (Meyer and Amer, Reference Meyer and Amer1988). The measurement procedure consists of repeating cycles of approach and retraction at a constant speed on a given location. When the cantilever tip is pulled apart from the substrate surface, the force required for bond rupture can be recorded (Robert et al., Reference Robert, Benoliel, Pierres and Bongrand2007). The frequency distribution of unbinding forces is obtained after enough cycles have been done (usually hundreds of approach–retraction cycles). Subsequent analysis of these rupture force values can be used to estimate the dissociation rate constants (Kada et al., Reference Kada, Blayney, Jeyakumar, Kienberger, Pastushenko, Fleischer, Schindler, Lai and Hinterdorfer2001; Lee and Marchant, Reference Lee and Marchant2001, Reference Lee and Marchant2003; Lo et al., Reference Lo, Zhu and Beebe2001; Zhang et al., Reference Zhang, Wojcikiewicz and Moy2002; Cai and Yang, Reference Cai and Yang2003; Kokkoli et al., Reference Kokkoli, Ochsenhirt and Tirrell2004; Kienberger et al., Reference Kienberger, Kada, Mueller and Hinterdorfer2005). Starting with the pioneering work on complementary DNA strands (Lee et al., Reference Lee, Chrisey and Colton1994a, Reference Lee, Kidwell and Colton1994b), biotin–streptavidin (Florin et al., Reference Florin, Moy and Gaub1994; Lee et al., Reference Lee, Kidwell and Colton1994b), and cell adhesion proteoglycans (Dammer et al., Reference Dammer, Popescu, Wagner, Anselmetti, Guntherodt and Misevic1995), this method has been applied to a wide range of interactions (Willemsen et al., Reference Willemsen, Snel, Cambi, Greve, De Grooth and Figdor2000): from complex biological intermolecular systems such as protein–nucleic acid (Bartels et al., Reference Bartels, Baumgarth, Anselmetti, Ros and Becker2003, Reference Bartels, McIntosh, Fuhrmann, Metzendorf, Plattner, Sewald, Anselmetti, Ros and Becker2007; Kühner et al., Reference Kühner, Costa, Bisch, Thalhammer, Heckl and Gaub2004; Baumgarth et al., Reference Baumgarth, Bartels, Anselmetti, Becker and Ros2005; Fuhrmann et al., Reference Fuhrmann, Schoening, Anselmetti, Staiger and Ros2009), antibody–antigen (Hinterdorfer et al., Reference Hinterdorfer, Baumgartner, Gruber, Schilcher and Schindler1996; Allen et al., Reference Allen, Chen, Davies, Davies, Dawkes, Edwards, Roberts, Sefton, Tendler and and Williams1997; Morfill et al., Reference Morfill, Blank, Zahnd, Luginbühl, Kühner, Gottschalk, Plückthun and Gaub2007), quadruplex nucleic acids (Lynch et al., Reference Lynch, Baker, Byker, Zhou and Sinniah2009), enzyme–inhibitor (Porter-Peden et al., Reference Porter-Peden, Kamper, Vander Wal, Blankespoor and Sinniah2008), and cell adhesion molecules (Fritz et al., Reference Fritz, Katopodis, Kolbinger and Anselmetti1998; Björnham and Schedin, Reference Björnham and Schedin2009; Dague et al., Reference Dague, Pons, Roland, Azaïs, Arcucci, Lachaize, Velmont, Trevisiol, N’Guyen, Sénard and Galés2022) to supramolecular examples (Eckel et al., Reference Eckel, Ros, Decker, Mattay and Anselmetti2005a) and synthetic biology (Eckel et al., Reference Eckel, Wilking, Becker, Sewald, Ros and Anselmetti2005b). See Fig. 1c.
Magnetic tweezers. MTs are a high-throughput method that can measure forces in the range of 10−3–102 pN. MTs can manipulate superparamagnetic beads, with the external magnetic field from a pair of small permanent magnets placed above the sample holder of an inverted microscope. In these assays, receptor proteins are bound to the superparamagnetic beads and allowed to contact their surface-bound ligand. Then the permanent magnets above the trapping chamber produce a magnetic field gradient along the axial direction, resulting in a controlled force on the bead directed toward the magnets (Neuman and Nagy, Reference Neuman and Nagy2008). MTs can be used to study several molecular interactions in parallel, offering an advantage versus other single-molecule force. For instance, this method has been used to study the prototypical ligand–receptor pair streptavidin–biotin (Claudia et al., Reference Claudia, Greenfield and Prentiss2005; Shang and Lee, Reference Shang and Lee2007; Kilinc et al., Reference Kilinc, Blasiak, O'Mahony, Suter and Lee2012). See Fig. 1d. Finally, new experimental approaches have combined AFM with MTs (Muñoz et al., Reference Muñoz, Aguilar Sandoval, Wilson and Melo2015)
Acoustic force spectroscopy. AFS uses acoustic waves to apply controlled forces on microparticles in a flow cell. The exerted forces are in the range of sub-piconewtons to hundreds of piconewtons, with loading rates between 10−4 and 102 pN s−1 on thousands of protein–DNA complexes in parallel (Kamsma and Wuite, Reference Kamsma and Wuite2018). The flow cell consists of a piezo element and two glass layers with a fluidic channel in between. A protein–DNA complex attached by DNA end to a bead is allowed to contact the bottom glass coated with an interacting protein. The piezo element generates an acoustic wave that travels through the top glass to the bottom glass. The bottom glass reflects the acoustic wave, producing a standing wave over the flow cell. The bead exposed to this standing wave experiences a force along the vertical direction that applies tension to the interaction between the protein–DNA complex and the interacting protein (Lin et al., Reference Lin, Qin, Wuite and Dame2018). See Fig. 1f. AFS can be used to study DNA–protein interactions like DNA–viral capsid protein assembly (Van Rosmalen et al., Reference Van Rosmalen, Kamsma, Biebricher, Li, Zlotnick, Roos and Wuite2020), DNA–RecA filament formation, and to determine the energy landscape of digoxigenin–antidigoxigenin bonds (Sitters et al., Reference Sitters, Kamsma, Thalhammer, Ritsch-Marte, Peterman and Wuite2014). Furthermore, AFS allows to probe the mechanical properties of cells (Sorkin et al., Reference Sorkin, Bergamaschi, Kamsma and Wuite2018), the strength of molecular interactions of cells with the extracellular matrix (Kamsma et al., Reference Kamsma, Bochet, Oswald, Alblas, Goyard, Wuite, Peterman and Rose2018), and the unbinding behavior of carbohydrate binding modules to polysaccharide surfaces (Hackl et al., Reference Hackl, Contrada, Ash and Chundawat2021). See Fig. 1f.
Optical tweezers
OTs are based on the optical trapping phenomenon discovered in 1970 by Arthur Ashkin, for which he has recently been awarded the Nobel prize in 2018 (Nobel Prize, 2021). Optical trapping is achieved by tightly focusing lasers on a small volume (diameter on the order of micrometers) (Ashkin, Reference Ashkin1970), where a nearby dielectric particle then experiences a restoring force toward the point of highest laser intensity. This keeps the particle stably confined in all directions, trapped at a single point. Forces in the range of 10−1–102 pN can be exerted. These overlap with the range of forces experienced by biological molecules in their native environment; this makes OTs perfectly suited to study the forces between biomolecules (Neuman and Nagy, Reference Neuman and Nagy2008). These complete reviews are recommended for instrumental details and technical information (Molloy and Padgett, Reference Molloy and Padgett2002; Nieminen et al., Reference Nieminen, Knöner, Heckenberg and Rubinsztein-Dunlop2007; Zhang and Liu, Reference Zhang and Liu2008; Guo and Li Reference Guo and Li2013; Polimeno et al., Reference Polimeno, Magazzù, Iatì and Maragò2018; Zaltron et al., Reference Zaltron, Merano, Mistura, Sada and Seno2020). OTs offer several advantages in the study of biomolecular interactions such as high spatio-temporal resolution, easy and specific attachment of biomolecules, and compatibility with fluorescent detection and visualization techniques such as Förster resonance energy transfer in hybrid custom-built (Comstock et al., Reference Comstock, Ha and Chemla2011; Whitley et al., Reference Whitley, Comstock and Chemla2017) and commercial instruments (Avellaneda et al., Reference Avellaneda, Koers, Minde, Sunderlikova and Tans2020). A notable example of commercial OTs are the miniTweezers instrument (Smith et al., Reference Smith, Cui and Bustamante2003), a compact single-optical trap capable of piconewton, sub-nanometric spatial-, millisecond temporal-resolution (see Fig. 1e).
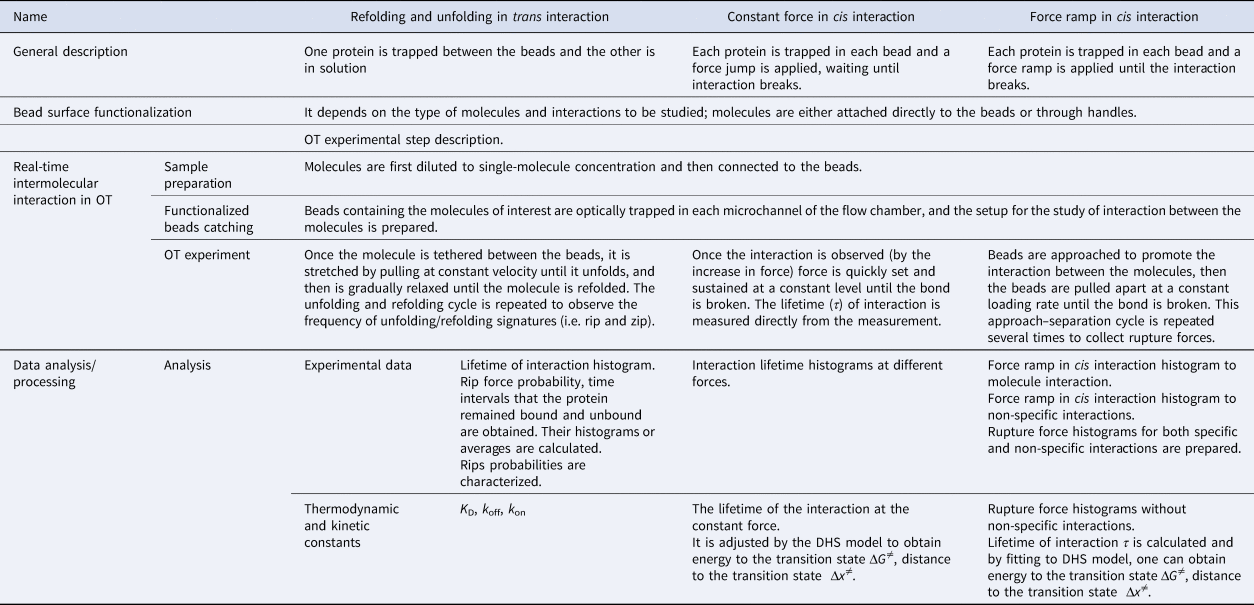
Different experimental approaches have been developed to study intermolecular interactions using OTs. To discuss these experimental approaches, we will classify them into three groups: refolding and unfolding in trans interaction, constant force in cis interaction, and force ramp in cis interaction.
Detailed description of intermolecular interaction force experiments using OTs
To compare the experimental approaches mentioned above, we will discuss the difference between them in three experimental stages (see Table 1):
• Bead surface functionalization
• Real-time intermolecular interaction in OT
• Data analysis/processing
Detailed description of intermolecular interaction force experiments using OTs

Bead surface functionalization
In this section, we describe the preparation to be done before the experiments. Specifically, the functionalization or derivatization of the beads and DNA handle.
Derivatization of the beads
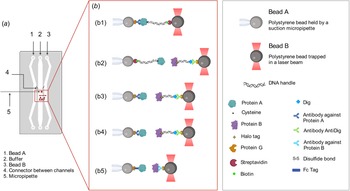
A critical preliminary step is the binding of the relevant molecules to the beads (the order of magnitude of the diameter from ~101 nm to 101 μm; Neuman and Nagy, Reference Neuman and Nagy2008). There are many experimental approaches to attach molecules to beads, and a variety of beads to use (see Fig. 2b). Although polystyrene beads are the most common (Ramírez et al., Reference Ramírez, Rivera, Quiroga-Roger and Wilson2017; Burgos-Bravo et al., Reference Burgos-Bravo, Figueroa, Casanova-Morales, Quest, Wilson and Leyton2018), latex (Mejean et al., Reference Mejean, Schaefer, Millman, Forscher and Dufresne2009), silica (Block et al., Reference Block, Goldstein and Schnapp1990), and germanium (Sudhakar et al., Reference Sudhakar, Abdosamadi, Jachowski, Bugiel, Jannasch and Schäffer2021) beads are also available. There are several types of beads with different kinds of functionalization that can be used depending on the molecule to be studied: Ni-NTA-coated beads can be used to directly bind his-tagged proteins (Mejean et al., Reference Mejean, Schaefer, Millman, Forscher and Dufresne2009); G-protein-coated beads can be utilized to bind the molecule of interest through Fc-fusion proteins (Burgos-Bravo et al., Reference Burgos-Bravo, Figueroa, Casanova-Morales, Quest, Wilson and Leyton2018), specific antibodies (Peña-Oyarzun et al., Reference Peña-Oyarzun, Rodriguez-Peña, Burgos-Bravo and Criollo2020), or by modified-DNA linkers called ‘DNA handles’ (Ramírez et al., Reference Ramírez, Rivera, Quiroga-Roger and Wilson2017); streptavidin- or neutravidin-coated beads can also be used to bind the molecule directly (e.g. a biotinylated-protein) or through a biotinylated-DNA handle. G-protein- and streptavidin-coated beads are the most commonly used in OTs as they form strong bonds and are commercially available. The derivatization strategies of these polystyrene beads will be described below.
Bead experimental setup with miniTweezers. (a) Laminar flow chamber used in miniTweezer setup: two microchannels (1 and 3) are connected to the main channel (2) by connectors (4). Channels 1 and 3 allow the controlled entry of the functionalized beads with the proteins of interest. Bead A is injected by channel 1 and at the main channel is trapped and guided with the optical trap to a suction micropipette (5). Functionalized bead B enters by channel 2, at the main channel is trapped and guided with the optical trap in front of bead A. (b) Five examples of construct combinations that can be studied in OT. (b1) Bead A/Protein_G/anti_protein_A ↔ protein_A/cystein/S-S/DNA_handle/biotin/streptavidin/bead B. (b2) Bead A/streptavidin/biotin/DNA_handle/S-S/cysteine/Protein_A ↔ Protein_B/Halo_tag/DNA_handle/Dig/Anti_Dig/ProteinG. (b3) Bead A/proteinG/anti_protein_A/Protein_A ↔ Protein_B/Halo_ta/DNA_handle/Dig/Anti_Dig/ProteinG. (b4) Bead A/anti_protein_A/Protein_A ↔ Protein_B/Halo_ta/DNA_handle/Dig/Anti_Dig/Protein_G. (b5) Bead A/Protein_G/Fc tag/Protein_A ↔ Protein_B/Anti_proteinB/Protein_G. (c) Box with names of molecules involved.

Protein G-coated polystyrene bead/primary antibody against protein of interest. For proteins, protein G-coated beads can directly bind a fusion protein containing an IgG-Fc tag (Burgos-Bravo et al., Reference Burgos-Bravo, Figueroa, Casanova-Morales, Quest, Wilson and Leyton2018). A primary antibody against the protein of interest can be used in combination with protein G (Peña-Oyarzun et al., Reference Peña-Oyarzun, Rodriguez-Peña, Burgos-Bravo and Criollo2020; Mateluna et al., Reference Mateluna, Torres, Rodriguez–Peña, Silva, Matthies, Criollo, Bikker, Bolscher, Wilson, Zapata–Torres and Torres2022). For this option, protein G-coated beads are incubated with a primary antibody that binds the protein to be immobilized on the bead. Then, a crosslinking agent is used to covalently bind the protein G and the Fc tag or antibody (Peña-Oyarzun et al., Reference Peña-Oyarzun, Rodriguez-Peña, Burgos-Bravo and Criollo2020).
Protein G- or streptavidin-coated polystyrene beads/DNA handles. Another possibility to attach the protein of interest to polystyrene beads is using DNA handles (Ramírez et al., Reference Ramírez, Rivera, Quiroga-Roger and Wilson2017). This approach can be used for studying interactions between proteins (Ramírez et al., Reference Ramírez, Rivera, Quiroga-Roger and Wilson2017) and non-protein molecules like aptamers (Casanova-Morales et al., Reference Casanova-Morales, Figueroa, Alfaro, Montenegro, Barrera, Maze, Wilson and Conejeros2019). DNA handles are constructs between 500 and 1500 bp (Cecconi et al., Reference Cecconi, Shank, Dahlquist, Marqusee and Bustamante2008; Kaiser et al., Reference Kaiser, Goldman, Chodera, Tinoco and Bustamante2011) that act as linkers between the protein and the bead (Halvorsen et al., Reference Halvorsen, Schaak and Wong2011). These constructs separate the protein from the optically trapped bead, eliminating undesired interactions and photodamage. Shorter DNA handles (e.g. 29 bp) can be used to enhance the signal to noise ratio (Forns et al., Reference Forns, de Lorenzo, Manosas, Hayashi, Huguet and Ritort2011).
A DNA–protein complex is typically formed through a disulfide bond between a cysteine residue on the protein of interest and a cysteine at one end of the DNA handle (Ramírez et al., Reference Ramírez, Rivera, Quiroga-Roger and Wilson2017). Enzyme-based coupling strategies have also been used to form a covalent protein–DNA handle bond, including HaloTag fusion proteins that perform a dehalogenase reaction with the HaloTag ligand cross-linked to DNA handle (Aubin-Tam et al., Reference Aubin-Tam, Olivares, Sauer, Baker and Lang2011). By polymerase chain reaction (PCR), DNA handles are made using digoxigenin or biotin moiety-functionalized primers (Cecconi et al., Reference Cecconi, Shank, Marqusee and Bustamante2011). The process allows the binding of the DNA–protein complex to the protein G-coated spheres that have been derivatized with anti-digoxigenin (anti-dig) antibodies or streptavidin beads. The protein G or protein G/primary antibody methodology described above can also be used for refolding–unfolding and force–ramp experiments (Bustamante et al., Reference Bustamante, Sotelo-Campos, Guerra, Wilson, Bustamante and Báez2017).
The derivatization strategy to be used depends on the molecules that will be studied. When using DNA handles, at least 40% of the cysteine residue in a protein needs to be exposed to the solvent (Wilson, Reference Wilson2011), and at the opposite side of the interaction. If an intrinsic cysteine residue is not available, a mutant protein can be fabricated by replacing a serine residue with cysteine (Ramírez et al., Reference Ramírez, Rivera, Quiroga-Roger and Wilson2017). However, the retention of the native protein conformation must be confirmed. If there is a cysteine (wildtype or mutant) that meets these requirements, then the use of DNA handles is appropriate. When working with other molecules such as aptamers, the DNA handle approach can be appropriate, but there must be an SH moiety in order to bind the handle. In the case of aptamers, they can be directly bound to the DNA handles by their 3′ and 5′ ends (Cecconi et al., Reference Cecconi, Shank, Dahlquist, Marqusee and Bustamante2008). The DNA handle approach can be utilized on refolding and unfolding in trans interaction and constant force in cis interaction. For refolding and unfolding in trans interaction, there need to be two cysteine residues on the same molecule and at opposite sides. On the other hand, the protein G and protein G/primary antibody method requires the availability of a specific antibody that binds the molecule on the opposite side of the interaction. Nevertheless, a chimera of the target protein can be synthetized, for instance by adding a GFP protein (Thoumine et al., Reference Thoumine, Bard, Saint-Michel, Dequidt and Choquet2008), GSH molecule (Nicholas et al., Reference Nicholas, Rao and Gennerich2014), or Fc tag (Burgos-Bravo et al., Reference Burgos-Bravo, Figueroa, Casanova-Morales, Quest, Wilson and Leyton2018). Fusion proteins allow working with non-purified protein extract because of the binding specificity (Burgos-Bravo et al., Reference Burgos-Bravo, Figueroa, Casanova-Morales, Quest, Wilson and Leyton2018). Large molecules might be directly attached to spheres, while DNA handles are recommended for small molecules since surface imperfections on the polystyrene beads are always present at the Angstrom level. Thus, DNA handles avoid the possible interference of the bead surface when the size of the molecule is smaller than the imperfections of the polystyrene beads. The DNA handles function as spacers between the protein and the beads, keeping interactions between the tethering surfaces to a minimum (Cecconi et al., Reference Cecconi, Shank, Marqusee and Bustamante2011) and preventing photodamage of the protein of interest (Chen et al., Reference Chen, He, Srinivasakannan, Li, Yin, Peng, Guo and Zhang2019; Desai et al., Reference Desai, Frank, Lee, Righini, Lancaster, Noller, Tinoco and Bustamante2019). In this way, DNA handles minimize thermal and acoustic fluctuations, which is especially useful when there are impurities within the sample (Halvorsen et al., Reference Halvorsen, Schaak and Wong2011). These derivatization strategies can be combined in the final experimental setup. For example, DNA handles and the protein G or protein G/primary antibody approaches can be used to bind each of the molecules of study. Therefore, when choosing a strategy for binding the molecule of interest to the bead, all the factors mentioned above must be taken into consideration.
Real-time intermolecular interaction in OTs
Preparing samples for OTs
As previously mentioned, the preparation of the samples is slightly different when using protein G/primary antibody versus DNA handles. In the case of protein G/primary antibody, the derivatization is performed in advance, and the binding of the protein to the beads occurs immediately before the experiment. In contrast, for DNA handles, the bead derivatization process is the first step (e.g. with anti-dig) followed by DNA handle-target molecule construct preparation (Fig. 2b). The complex is then incubated with the beads immediately before the experiment. A brief description of these two strategies will be given.
Preparation of the protein G-coated bead/primary antibody/protein complex. The derivatization of the beads is made as previously explained. After derivatization, a passivation process is recommended to prevent unwanted interactions. The passivation is carried out by incubating the beads with 1% w/v bovine serum albumin diluted in the interaction buffer (the buffer that will be used for the OT experiments) for 4 h at room temperature, then washing in the same buffer by centrifugation (Szili et al., Reference Szili, Al-Bataineh, Ruschitzka and Short2012). Passivation can also be done by adding β-casein at a final concentration of 1 mg ml−1 followed by incubation while vortexing for 1 h at room temperature (Fukuda et al., Reference Fukuda, Yan, Komi, Sun, Gabizon and Bustamante2020). After passivation, the beads can be stored at 4 °C in the presence of sodium azide (0.05% w/v) for up to a year. To form the complex with the protein, the beads (0.5%, w/v) are incubated at the nanomolar concentration on ice or room temperature for 15 min. Then the beads are ready to be injected into the microfluidic chamber of the OTs (Fig. 2a).
Preparation of the streptavidin-coated bead/DNA handle/protein complex and protein G-coated bead/anti-dig antibody/DNA handle/protein complex. The first step is to synthesize the DNA handles (Cecconi et al., Reference Cecconi, Shank, Dahlquist, Marqusee and Bustamante2008). The handles are synthesized via PCR in a thermal cycler using a plasmid or lambda DNA and appropriately functionalized primers (Cecconi et al., Reference Cecconi, Shank, Dahlquist, Marqusee and Bustamante2008). For synthesizing biotin-DNA-SH handles, one of the primers contains a biotin moiety and the other contains an SH moiety, so the result will be DNA handles with a biotin and an SH group at each end. In the case of digoxigenin- DNA-SH handles, one primer contains a digoxigenin moiety instead of the biotin-primer. Primers with two dig moieties can also be used in order to guarantee more stability in the binding between the molecule and DNA handle (Desai et al., Reference Desai, Frank, Lee, Righini, Lancaster, Noller, Tinoco and Bustamante2019). The biotin or digoxigenin-DNA molecules are then bound to the streptavidin or anti-dig-coated beads, respectively. Then, the DNA handle-molecule construct can be made via disulfide bonding formation (Wilson, Reference Wilson2011).
The microfluidic channels of the OT setup are filled with buffer solution before injecting the derivatized beads as described in the following section.
Trapping functionalized beads
In this step, the beads functionalized with the molecules of interest are trapped and brought in contact to promote the protein–protein interaction. The laminar flow microfluidic chamber has three independent channels with small glass tube interconnections, physically separating the two different types of beads (Fig. 2a). The central channel has a micropipette connected to the outside of the microfluidic chamber. The catching process corresponds to trapping the beads from the different channels of the microfluidic chamber and bringing them to the central channel of the chamber where the experiment is carried out. The procedure for an experiment is as follows:
(1) The functionalized beads are injected into the upper and lower channels.
(2) A dual-laser (808 or 845 nm) optical-trap (trap stiffness of 0.1 pN nm−1) is used to trap the bead in one of the channels and move it to the central channels where the micropipette is.
(3) Suction is applied on the micropipette to hold one of the beads in place.
(4) The optical trap is used to bring the second bead from the other channel close to the micropipette-trapped bead.
(5) The beads are briefly brought into contact (less than ~3 s) to promote interaction between the molecules.
OT experiment
Once the interaction is formed, tension is applied on the construct in order to measure its physical properties. As mentioned above, there are three main ways to measure interactions using OTs (Table 1):
• Refolding and unfolding in trans interaction (one protein is trapped between the beads and the other is in solution).
• Constant force in cis interaction (each protein is trapped in each bead and a force jump is applied waiting for the interaction to break).
• Force ramp in cis interaction (each protein is trapped in each bead and a force ramp is applied until the interaction breaks).
Refolding and unfolding in trans interaction
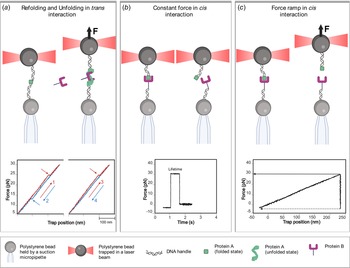
This experimental approach consists of repeated cycles to mechanically pull a molecule until it loses its natural structure and then lower the tension until the molecule refolds. The beads are brought into contact for ~1 s or less (step 5 in Section ‘Trapping functionalized beads’). Then, the optical trap is moved away at a constant speed (order of magnitude ~10–100 nm s−1) (Bustamante and Smith, Reference Bustamante and Smith2007) from the bead that is fixed in the pipette. If the molecules bond successfully while the beads are in contact, the extension–force curve will be with a positive slope (Fig. 3a), otherwise, the slope is null and the beads should be brought back into contact. As the optical trap is moved away, a sharp drop (or ‘rip’) in the tension can be observed whenever a specific structure of the molecule of interest unfolds. Finally, after completely unfolding the molecule, the optical trap is returned to its initial position, causing the system to relax and letting the molecule fold again. The experiment is repeated in the presence or absence of an interacting protein or other molecule added in trans in the buffer, and the frequency of rips is observed. These data are displayed as rip force histograms, from which the lifetime histogram is obtained.
Intermolecular interaction force experiments using OT. (a) Refolding and unfolding in trans interaction: at the top, protein A (green square) is tethered between two dsDNA handles attached to a bead held by a suction micropipette and an optically trapped bead. The optically trapped bead is pulled apart at a constant loading rate (arrow direction) stretching the molecule until it unfolds. Then protein B (purple) is added to the buffer and binds to the unfolded state of protein A preventing its refolding. At the left bottom, force–extension curves of the mechanical folding and unfolding events. The unfolding cycles are shown in red, and relaxation traces with refolding events at lower forces are shown in blue. The panel to the right shows no refolding event due to the binding of the interacting partner to the unfolded state. (b) Constant force in cis interaction: at the top, beads are approached to promote the interaction between the proteins. Once the interaction is observed, force is set and sustained constant until the bond is broken. At the bottom is a force–time graph. The interaction event is observed as an increase in the axis of force. The lifetime of the interaction is obtained directly from the graph corresponding to the time between the force is set and sustained constant until the bond is broken, observed as a sudden drop in force. (c) Force ramp in cis interaction. At the top, beads are approach and brought into contact to promote the interaction between the proteins. Then beads are separated by pulling apart the optically trapped bead at a constant loading rate (arrow direction) until the bond is broken. At the bottom is a force–extension curve. In case of interaction, an increase in the axis of force is noticed. Then at a certain distance the rupture of the interaction is produced, observed as a sudden drop in force.

For example, the in trans interaction scheme was used to study the interaction of binding immunoglobulin protein (BiP), a major chaperone from the endoplasmic reticulum, with its protein substrate, the MJ0366 (Ramírez et al., Reference Ramírez, Rivera, Quiroga-Roger and Wilson2017). Here, BiP was added in trans, while the MJ0366 protein was tethered between two beads (Fig. 3a). Since BiP interacts with unfolded proteins (Schmid et al., Reference Schmid, Baici, Gehring and Christen1994), OTs were used to mechanically control the folded state of the substrate. The MJ0366 protein was unfolded by pulling the optically trapped bead at a constant loading rate and refolded by lowering the tension (i.e. relaxing cycle). Experiments performed in the presence of BiP showed a loss of refolding and unfolding events in the consecutive pulling–relaxing cycles (Fig. 3a) in contrast to the experiments in the absence of BiP, verifying that BiP binds to the unfolded state of MJ0366 protein and prevents its refolding. From these features in the force–extension curves, the BiP's dissociation constants were calculated by measuring the probabilities for observing rips (the presence of unfolding and refolding events) and no rips (the absence of unfolding and refolding events). The reversibility of BiP binding to its substrate was also determined due to the reappearance of refolding and unfolding events. The time intervals that BiP stayed bound (e.g. disappearance of unfolding/refolding events, τ off) or unbound (e.g. reappearance of unfolding/refolding events, τ on) to the protein substrate were directly calculated. The corresponding k off and k on were estimated by assuming an exponential distribution for the off and on lifetimes (Ramírez et al., Reference Ramírez, Rivera, Quiroga-Roger and Wilson2017). It was also determined that the binding–unbinding of BiP to its substrate depends on both the type and concentration of nucleotide, indicating that ATP hydrolysis regulates the binding and release of this chaperone to the substrate protein (Ramírez et al., Reference Ramírez, Rivera, Quiroga-Roger and Wilson2017).
Naturally, this assay can be used to study the binding between other kinds of molecules. For example, a refolding and unfolding experiment was used to study the dynamics of APTSTX1–aptamer, a single-stranded DNA molecule with a high affinity for saxitoxin (STX), a lethal neurotoxin (Casanova-Morales et al., Reference Casanova-Morales, Figueroa, Alfaro, Montenegro, Barrera, Maze, Wilson and Conejeros2019).
Constant force in cis interaction
Constant-force assays (also called force-clamp assays in the literature) have been widely used to study protein interactions. In this assay, the beads are brought into contact for ~2 s or less in order to promote the interaction between the proteins (step 5 in Section ‘Trapping functionalized beads’). Once the binding is confirmed by an increase in the tension, the optical trap is fixed at a constant force. The duration of the interaction is measured, until the bond rupture is observed as a sudden decrease in the tension. This time is related to the lifetime τ of the interaction at a specific force. Then, the experiment is repeated in order to measure the decay times as a function of the force. This strategy should be repeated a minimum of 20 times, and at least five pairs of new beads should be used for each measured force.
The range of forces that will be applied to the molecule depends on previous information and characteristics of the interaction. If this is unknown, a large range of forces can be used initially to find the most relevant region for a given interaction. It is recommended to complement the experiment with the previous force ramp experiment, which can also provide some information on τ at different forces. Using these data, it is possible to extract kinetic parameters by using the Dudko–Hummer–Szabo (DHS) model (Dudko, Reference Dudko, Hummer and Szabo2008).
For instance, the dynamic-catch bond behavior was described for the first time in the characterization of the interaction of Thy-1 with both α 5β 1 integrin and syndecan-4 by BFP (Fiore et al., Reference Fiore, Ju, Chen, Zhu and Barker2014). Other constant-force assays include F-actin and G-actin dissociation kinetics (Lee et al., Reference Lee, Lou, Wen and McIntire2013), kinetochore-microtubule attachments (Akiyoshi et al., Reference Akiyoshi, Sarangapani, Powers, Nelson, Reichow, Arellano-Santoyo, Gonen, Ranish, Asbury and and Biggins2010), P-selectin, and PSGL-1 binding (Marshall et al., Reference Marshall, Long, Piper, Yago, McEver and Zhu2003).
On- and off-rates, mechanical stability and affinity measurements have been measured by studying proteins directly attached to the surface of the beads (Fig. 2b). For instance, the specific interactions between glycosylphosphatidylinositol-anchored Thy-1 protein, an abundant neuronal cell adhesion molecule, and its astrocytic receptors, the transmembrane α vβ 3 integrin and the proteoglycan of heparan sulfate syndecan-4, was characterized using this approach (Burgos-Bravo et al., Reference Burgos-Bravo, Martínez-Meza, Quest, Wilson and Leyton2020). For this, Fc-tagged recombinant molecules were used to allow direct coupling to the beads via the strong and high-affinity Fc-protein G interactions (Fig. 2b). Specifically, the bond lifetime of the Thy-1-dependent interaction as tri-molecular complex (i.e. Thy-1-Fc/syndecan-4-Fc + α vβ 3-Fc) was determined by constant-force assays (Fig. 3b), where the duration before bond dissociation is measured directly under different forces. The force-dependent lifetime data were fitted using the Bell (Reference Bell1978) model showing an ordinary slip-bond behavior for the tri-molecular complex (Burgos-Bravo et al., Reference Burgos-Bravo, Martínez-Meza, Quest, Wilson and Leyton2020). Furthermore, the Bell model was also used to calculate the kinetic parameters of the unbinding process, obtaining a k off at zero force of ~0.08 s−1 and distance to the transition state of ~0.2 nm.
Force ramp in cis interaction
Another strategy to study molecular bonds are force-ramp assays. In this approach, the forces required for bond dissociation (i.e. rupture forces) are measured and used to obtain force-dependent kinetic parameters and mechanical response of molecular bonds. Rupture-force data are obtained by pulling apart the optically trapped bead at a constant loading rate after the beads are brought into contact and then an interaction is formed (also referred to as approaching and retraction cycle; see detailed explanation in Section ‘Detailed description of intermolecular interaction force experiments using OTs’). As shown in Fig. 3c, rupture force values resulting from single-molecule bindings are determined directly from the force–trap position traces with a single-step bond rupture signature (Litvinov et al., Reference Litvinov, Bennett, Weisel and Shuman2005). The beads are brought into contact to promote protein–protein interaction (step 5 in Section ‘Trapping functionalized beads’). Then the optical trap is pulled apart at a constant velocity, much like in folding/unfolding experiments. The interaction between the two molecules resists the pulling, generating a measurable tension that increases with distance. After enough force is applied, the interaction yields, and the tension force drops suddenly to zero. The maximum force achieved before the separation of the system is then recorded as the ‘rupture force’ (Fig. 3c). These approach–tension–release cycles are repeated at least 50 times for an average pair of beads. Beads are changed approximately six times in order to achieve around 300 total pulling events, with and without interaction (a number easily achievable in a single-productive day and can be sufficient for robust statistics). These data are displayed as force ramp histograms, for which the underlying probability distribution can be fitted in order to extract the kinetic parameters.
Force-ramp assays were used to obtain rupture force data for the Thy-1/α vβ 3 integrin interaction (Burgos-Bravo et al., Reference Burgos-Bravo, Figueroa, Casanova-Morales, Quest, Wilson and Leyton2018). In this study, the most probable bond rupture force or bond strength of ~25 pN was determined pulling at a constant loading rate of 10 pN s−1 (Burgos-Bravo et al., Reference Burgos-Bravo, Figueroa, Casanova-Morales, Quest, Wilson and Leyton2018). The force magnitude was in the previously reported range for non-covalent interactions (Weisel, Reference Weisel2003). Likewise, bond strengths between 25 and 44 pN were reported for the interactions between Staphylococcus aureus protein A and several species immunoglobulin G molecules, such as rabbit and goat, by using OT and force-ramp assays (Stout, Reference Stout2001). The kinetic parameters of the force-induced dissociation process can be characterized using the DHS model (Eq. (9); Dudko et al., Reference Dudko, Hummer and Szabo2008), which permits transforming the rupture force histograms into force-dependent lifetimes τ(F) (for more details see Section ‘Detailed description of intermolecular interaction force experiments using OTs’). This methodology permitted the characterization of the complete energy landscape (Δx ‡ ~ 0.50 nm and ΔG ‡ ~ 5.54k BT) and the zero-force kinetic parameter (k off0 ~ 0.051 s–1) of the Thy-1/α vβ 3 dissociation process (Burgos-Bravo et al., Reference Burgos-Bravo, Figueroa, Casanova-Morales, Quest, Wilson and Leyton2018). Moreover, the force-dependent lifetime showed that force exponentially increased Thy-1/α vβ 3 integrin dissociation, indicating a slip-bond behavior for this molecular bond.
Applying the single-molecule OT technique, the binding specificity and direct interaction between a pair of proteins can be determined from the frequency of adhesion measurements (e.g. the probability for adhesion based on the total number of contacts) (Robert et al., Reference Robert, Benoliel, Pierres and Bongrand2007; Stangner et al., Reference Stangner, Wagner, Singer and Kremer2013). Events with and without binding are used to calculate adhesion frequency in a sequence of approaching–retraction cycles between both beads during the force-ramp experiments. This strategy was used to verify the specific interaction between syndecan-4 and Thy-1 (Burgos-Bravo et al., Reference Burgos-Bravo, Martínez-Meza, Quest, Wilson and Leyton2020). Using a similar strategy, Peña-Oyarzun and coworkers confirmed the existence of a protein complex between the mechanosensory Ca2+ channel polycystin 2 (PKD2) and scaffolding protein Beclin 1 (BECN1), two autophagy-related proteins (Peña-Oyarzun et al., Reference Peña-Oyarzun, Rodriguez-Peña, Burgos-Bravo and Criollo2020). Here, to perform OT experiments, GST-PKD2 and 6xHis-BECN1 fusion proteins were attached to GSH- and anti-His-coated polystyrene beads, respectively. A bond strength of ~12 pN average (loading rate of 10 pN s−1) and a dissociation rate of ~0.28 s−1 were calculated for the PKD2/BECN1 protein complex, suggesting a weak and transient protein–protein interaction. Moreover, an ordinary slip-bond behavior was described for this complex. By using this technique, a physical interaction was identified between PKD2 and BECN1 that is required for autophagosome formation in human cells. Recently, this strategy has been used to prove the interaction between histatin-1 and the receptor VEGFR2 (Mateluna et al., Reference Mateluna, Torres, Rodriguez–Peña, Silva, Matthies, Criollo, Bikker, Bolscher, Wilson, Zapata–Torres and Torres2022). Based on the kinetic parameters and rupture forces obtained, the authors proposed that the histatin-1–VEGFR2 interaction is specific but transient.
A tether ligand assay is another strategy that can be used to measure binding rates of ligand–receptor pairs under force. Here, the goal is to hold the same binding partners in spatial proximity under mechanical control. A fusion construct is prepared between a pair of interacting proteins joined by a flexible polypeptide linker. This allows the measurement of repeated interactions of the same pair of molecules. This strategy has provided insights into von Willebrand factor (VWF) binding of the glycoprotein Ibα subunit (GPIbα) on the surface of platelets (Kim et al., Reference Kim, Zhang, Zhang and Springer2010, Reference Kim, Hudson and Springer2015), its essential role in the platelet plug formation, and their resistance to strong hydrodynamic forces. A complex was formed between GPIbα and the A1 domain of VWF using a polypeptide linker and attached to a pair of beads by DNA handles. By moving the optically trapped bead, this construct was subjected to pulling and relaxing cycles (e.g. force-ramp assay), allowing the unbinding and rebinding of the GPIbα–A1 complex. Both unbinding and binding processes are characterized by the abrupt increase and decrease in the tether length, respectively. This experimental strategy has also been used to study the force-sensitive mechanosensory role of filamin (Rognoni et al., Reference Rognoni, Stigler, Pelz, Ylanne and Rief2012).
Both force-ramp and constant-force assays have been extensively used to study the mechanical regulation of molecular interactions by experimentally measuring kinetic parameters under force. However, some differences have been described for both strategies. The force-ramp gives a higher throughput than constant-force assays. In the first strategy, the rupture forces are obtained from all binding events, while the constant force measures the lifetime from a fraction of binding events that survive the jump into the desired force. The bond lifetime values are obtained directly by the constant-force approach, without the extra data processing/analysis needed in force-ramp experiments. Moreover, when force is ramped at a constant rate, the rupture forces are measured in a dynamic condition. In contrast, when the force is clamped at a constant level, the bond dissociation is determined under static conditions, where the same force is applied to all components in the system, including interacting molecules, force sensor, and molecular linkers. Interestingly, using the constant force setup, it was possible to discover the catch (Marshall et al., Reference Marshall, Long, Piper, Yago, McEver and Zhu2003) and ideal bonds (Rakshit et al., Reference Rakshit, Zhang, Manibog, Shafraz and Sivasankar2012).
Considering the high sensitivity of this single-molecule technique, purified proteins are desirable to study unbinding parameters using OTs, for example, to reduce the rupture force resulting from non-specific interactions. The strength estimated for these non-specific binding events can reach values of ~10 pN (Weisel, Reference Weisel2003). Even when this rupture force peak might differ from the obtained for the specific dissociation between the proteins of interest, the non-specific interaction distribution partly overlaps with the lower rupture forces range produced by specific protein–protein interactions. To address this issue, a novel mathematical approach based on the law of total probabilities was designed to effectively correct the rupture force measurements for non-specific binding events, consequently obtaining an accurate estimation of the specific rupture forces for protein–protein dissociation and calculating the kinetic and transition state parameters (Burgos-Bravo et al., Reference Burgos-Bravo, Figueroa, Casanova-Morales, Quest, Wilson and Leyton2018). A complete description of the mathematical correction is given in Section ‘Detailed description of intermolecular interaction force experiments using OTs’. It has been reported that the work with purified protein still suffered from residual non-specific interactions (Burgos-Bravo et al., Reference Burgos-Bravo, Figueroa, Casanova-Morales, Quest, Wilson and Leyton2018), highlighting the importance of this mathematical correction method when single-molecule protein–protein interaction studies are performed.
Data analysis/processing
We will detail the strategies to analyze the data for the three experiments mentioned above:
• Refolding and unfolding in trans interaction strategy. It is possible to obtain the dissociation constant K D, and kinetics constants (k off, k on).
• Constant force in cis interaction strategy. The lifetime of the interaction at the constant force. It is adjusted by the DHS model to obtain energy to the transition state ΔG ≠, and distance to the transition state Δx ≠.
• Force ramp in cis interaction strategy. Rupture force histogram without non-specific interactions. Lifetime of interaction τ are calculated. By fitting to the DHS model, one can obtain the energy to the transition state ΔG ≠, and distance to the transition state Δx ≠.
Refolding and unfolding in trans interaction strategy
It is possible to calculate the dissociation constant K D of molecule for the used substrate (Ramírez, Reference Ramírez2016):

where [S] is the concentration of the substrate molecule, [Molecule] is the concentration of the molecule, [S:Molecule] is the concentration of the molecule–substrate complex, and P rip and P nrip are the probabilities for observing rips and no rips.
The time intervals that the molecule stay bound and unbound to the substrate can be determined directly, and the corresponding on and off rates can be calculated. By assuming a first-order reaction for the on and off times, the on and off rate constants can be calculated from the inverse average of the on and off times:


A first-order reaction, which is modeled by an exponential distribution for the on and off times, proceeds at a rate linearly dependent on only one reactant concentration, represented by A, where k is the rate constant and t is the residence (or absence) time.
The mean for the probability density to the k off at absence time (at) and k on at residence time (rt) are:


The K D can also be calculated using these parameters:

Constant force in cis interaction strategy
For interpreting this force dependence of the lifetime, the τ(F) data can be fitted by the prediction of the DHS model. This model predicts the force-dependence of the lifetime assuming that the dissociation of protein–protein binding can be described as an escape from a one-dimensional free energy well (Dudko et al., Reference Dudko, Hummer and Szabo2008). Therefore, by fitting to the non-linear DHS model, the energy landscape and kinetic parameters of the dissociation process at a constant loading rate can be obtained.
Obtaining biochemical parameters through the DHS model
Once the specific force histogram is obtained, it is normalized and fitted to the DHS model (Dudko et al., Reference Dudko, Hummer and Szabo2008). First, it is necessary to calculate the lifetimes of the interaction with force dependence, τ(F):

In this equation, k is an integer, with values 1, 2,…, N − 1, N indicates the number of a bar on the histogram. F 0 is the minimum recorded force, and ΔF is the width of the bars of the histogram. Each bar has a height h k, corresponding to the counts in bar k, C k, normalized so that the total area is equal to: h k = C k/C Tot ⋅ ΔF, with C Tot being the total number of accounts. The loading rate $\dot{F}$ is the rate of change in force over time. When modeling the DNA handles as a worm-like chain, the loading rate corresponds to:

where v is the constant speed of the experiment (in our case 100 nm s−1). The spring constant of the miniTweezers, k s, has a value of 0.1 pN nm−1. The contour length (L C) is the end-to-end length of the DNA handle, in this case 180 nm. The persistence length, (L P) (Bouchiat et al., Reference Bouchiat, Wang, Allemand, Strick, Block and Croquette1999), is the characteristic length at which the chain remains rigid. In the case of double-stranded DNA, L P has an average value that depends on the experimental conditions. In physiological buffer, it is ~50 nm (Bustamante et al., Reference Bustamante, Bryant and Smith2003). β = (k BT)−1 corresponds to the reciprocal of the thermal energy.
Then, the lifetimes of the interaction in dependence on force are given by:

From the previous expression, at zero force, three parameters are obtained:
(1) The lifetime of interaction τ 0, whose reciprocal corresponds to the dissociation kinetic constant, k off.
(2) The free energy difference to the transition state ΔG ≠, which corresponds to the energy barrier for the dissociation process.
(3) The distance to the transition state Δx ≠, which correlates with the interactions that must be broken to separate the two molecules (Schlierf and Rief, Reference Schlierf and Rief2005; Tych et al., Reference Tych, Hoffmann, Brockwell and Dougan2013; Stigler and Rief, Reference Stigler and Rief2015).
The scaling factor ν can be adjusted to values ν = 1/2 for a harmonic oscillator, ν = 2/3 for a potential with linear and cubic terms, and ν = 1 for an exponential known as the Bell equation (Bell, Reference Bell1978). For this last case, where τ(F) = τ 0e −βFΔx≠, it is not possible to obtain values of ΔG ≠.
Force ramp in cis interaction strategy
Interaction lifetimes can be assigned to each bar of the rupture force histogram (Eq. (7)). A non-linear regression of lifetime versus force graph, given by the DHS model (Eq. (9)), is used to obtain the kinetic parameters of dissociation process.
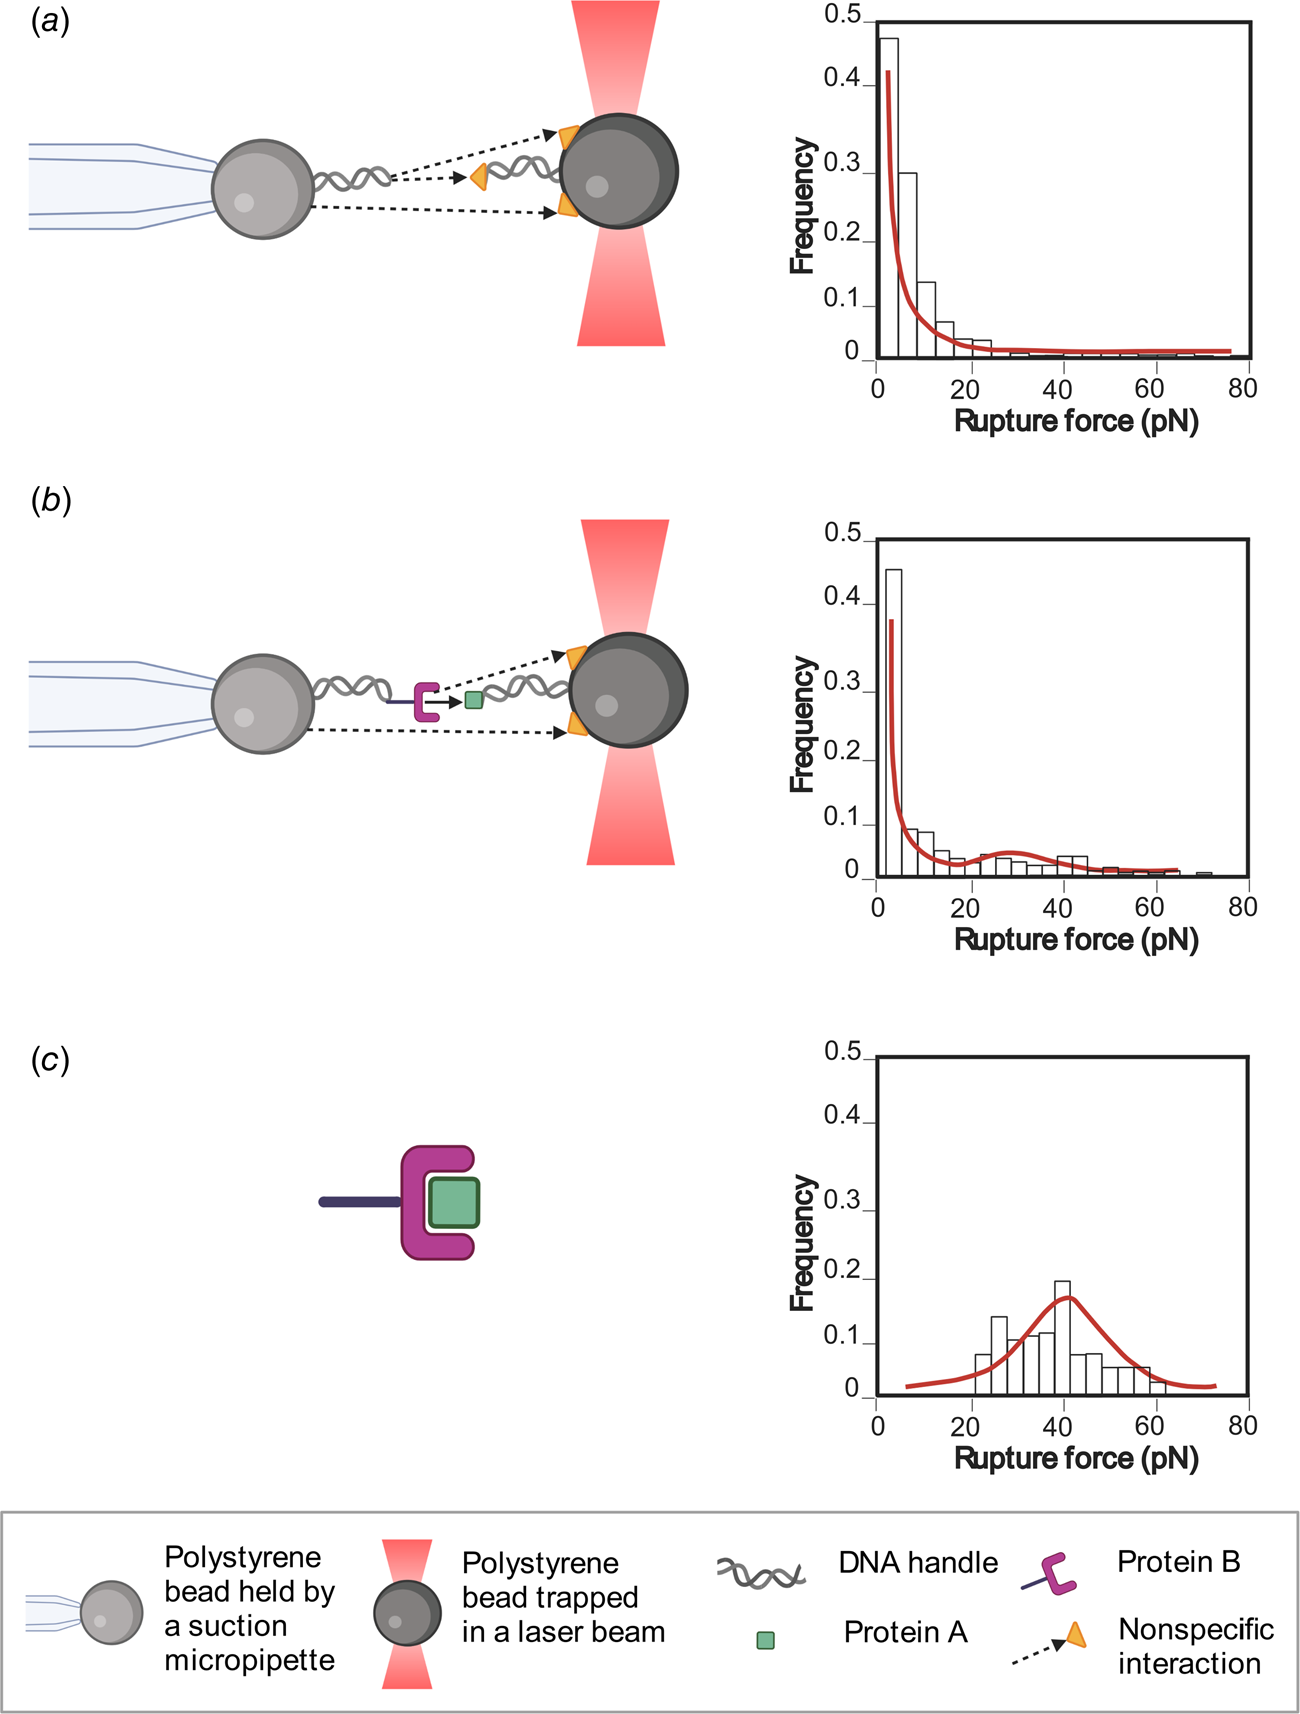
Sometimes, non-specific interactions (i.e. every interaction between the components of the system that are not the two molecules of interest at their specific interaction site) can mask the specific interaction of interest. In this case, multimodal force ramp histograms are common, with a very high number of forces ramp below 10 pN (Fig. 4b). In the next section, a statistical analysis method will be revised in order to filter the specific data and to dampen the effect of non-specific interactions on the kinetic parameters obtained.
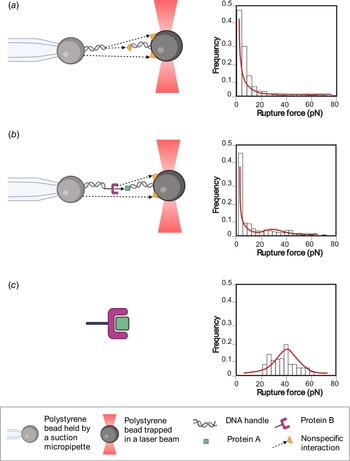
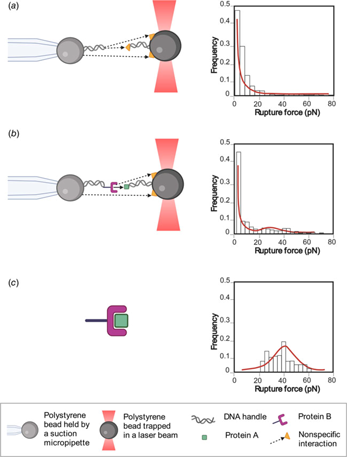
Methodology to obtain the specific interaction forces between the molecules of interest. The illustration shows the interactions of the molecules and their respective histograms. (a) Control histogram: the forces of non-specific interactions, represented by a yellow triangle and dashed black arrows, are measured using the components of the construct without the proteins of interest (proteins A and B), resulting in a force histogram of non-specific interactions. (b) Experimental histogram: the interaction forces between proteins A and B (black arrow) plus non-specific forces (yellow triangle and dashed black arrows) of all the construct components are measured, giving a force histogram that includes both kinds of interaction. (c) The unspecific interactions are filtered using the control histogram force, obtaining only the forces of the interaction between the two proteins.
Methodology to obtain the specific interaction forces between the molecules of interest
Let us call our molecules of interest A and B. In an ideal scenario, only interactions between A and B would be measured; let us call these events AB. However, in a real experiment, a lot of rupture events are observed that do not correspond to AB-interactions, these can be from interactions of our molecules of interest directly with the beads and/or other molecules in the environment. Let us call these events AB. If only AB-events are of interest, but some of our measurements are AB, is there a way to obtain the rupture-force distribution of AB-events?
A reasonable assumption is that both events are mutually exclusive. A rupture event cannot belong to a specific (AB) and non-specific (AB) interaction at the same time. Another reasonable assumption is that both events are complementary, so that only specific or non-specific interactions can be observed (as only data where interactions were observed are collected), so

This allows us to relate the probability P(F) of a rupture event happening between F and F + dF to its conditional probabilities:

The probability P(F|AB) corresponds experimentally to the rupture-force histogram when there are no specific interactions. This scenario can be achieved when the molecules A and B are not present. P(F) is the rupture-force histogram when A and B are present and there are other molecules that can interfere with the measurement of AB-events.
Finally, to reconstruct the rupture-force distribution for AB-events, Bayes' theorem can be used to obtain the expected proportion of AB to AB events for a given force

and can be used to create an ‘experimental’ rupture-force histogram for AB-events. The method can be summarized as follows:
(1) Characterize the non-specific background by measuring without the presence of molecules of interest, effectively an experimental P(F|AB). Then fit to the cumulative distribution function (CDF) in order to have a continuous expression for P(F|AB). Smoothing is also a viable alternative (Fig. 4a).
(2) Introduce molecules A and B to the system. By measuring the rupture-force histogram, obtain an experimental P(F). By fitting to the CDF and using Eq. (2), obtain P(AB) = 1 − P(AB) and an expression for P(F|AB) (Fig. 4b).
(3) Finally, by computing the ratio in Eq. (3) and using it to weigh the points that go into the rupture-force histogram P(F), reconstruct an experimental histogram associated to AB-events (Fig. 4c).
If necessary, proper modeling of P(F|AB) can be done assuming that it has a DHS-determined shape. In principle, the models used for P(F|AB) and P(F|AB) are not critical as long as AB events can be clearly distinguished in the fit of the experimental cumulative distribution of P(F) (which would be characterized by a small fit error on P(AB)). In practice, this will be achieved if (1) the rupture-force histograms of the molecules of interest have distinguishably different behavior compared to the background and/or (2) a large amount of data was taken, improving the statistical error on P(AB). An example where this problem is easy to see is when the AB events behave exactly like the background. Then this method would not give a reasonable result, and the error on P(AB) will be nonsensically large (note that P(AB) can only be from 0 to 1).
Once the filtered force histogram has been obtained, the DHS model is applied to calculate the biochemical parameters (see Section ‘Obtaining biochemical parameters through the DHS model’).
Finally, it is possible to apply the Jarzynski equality (Jarzynski, Reference Jarzynski1997), which allows us to obtain the free energy of the associated and dissociated state between both proteins, allowing the kinetic parameters of association to be explored indirectly, if there are no intermediates in this process (Raman et al., Reference Raman, Utzig, Baimpos, Ratna Shrestha and Valtiner2014).
Conclusions
As shown in this review, it is possible to characterize protein–protein interactions in great detail at the single-molecule level. We showed three different configurations used in OT experiments that can be used to measure the biophysical parameters of the interaction (refolding and unfolding in trans interaction; constant force in cis interaction; force ramp in cis interaction).
Using the outlined methods, it is possible to obtain parameters like kinetics constants (k off, k on), affinity values (K D), energy to the transition state ΔG ≠, and distance to the transition state Δx ≠, providing a thorough characterization of the energy landscape of the interaction. Furthermore, some parameters such as distance to the transition state are only obtained from force spectroscopy experiments.
Also, a methodology to obtain the specific interaction forces between the molecules of interest is detailed. The interesting thing about this presented technique is that through experimental controls and mathematical analysis, non-specific interactions can be distinguished from specific interactions.
Currently, new OT instruments are appearing that allow changes in temperature in the experimental chamber (de Lorenzo et al., Reference de Lorenzo, Ribezzi-Crivellari, Arias-Gonzalez, Smith and Ritort2015). With those instruments we will have a more complete view of the energy landscape of the interaction and obtain other parameters such as specific heat. Finally, newer models are appearing that consider more complete range of forces and higher pulling speed such as Bullerjahn–Sturm–Kroy model (Bullerjahn et al., Reference Bullerjahn, Sturm and Kroy2014) and Cossio–Hummer–Szabo (CHS) model (Cossio et al., Reference Cossio, Hummer and Szabo2016). These will make it possible to determine with greater precision the intermolecular interactions at the single molecule. Other parameters will become attainable, such as critical force (F c; force at which the energy barrier disappears; Bullerjahn et al., Reference Bullerjahn, Sturm and Kroy2014) and the μ parameter that indicates kinetic ductility of the protein (Cossio et al., Reference Cossio, Hummer and Szabo2016). Both experimental advances and theoretical analyses must intertwine and develop together. As presented in this work, both the experimental part and mathematical analysis are important for an optimal analysis of the observed phenomena.
Acknowledgments
This work was supported by: FONDECYT 1181361, PCI PII20150073 (C.A.M.W.). The authors are thankful for interactions with all members of Biochemistry Laboratory of the Universidad de Chile. Additionally, the authors thank Ms. Shantanu Kadam, Fernando Medina, and Virginia Rusell for their critical proofreading of the manuscript.