INTRODUCTION
Global environmental changes have initiated the sixth great mass extinction event in Earth's history (Barnosky et al. Reference Barnosky, Matzke, Tomiya, Wogan, Swartz, Quental, Marshall, McGuire, Lindsey, Maguire, Mersey and Ferrer2011). Among these, climate change, which involves changes in temperature, precipitation, ocean acidification and sea-level rise, is likely to become the most important direct threat to biodiversity (Pereira et al. Reference Pereira, Leadley, Proença, Alkemade, Scharlemann, Fernandez-Manjarrés, Araújo, Balvanera, Biggs, Cheung, Chini, Cooper, Gilman, Guénette, Hurtt, Huntington, Mace, Oberdorff, Revenga and Rodrigues2010). Indirectly, climate change may also affect biodiversity by altering existing threats, such as by modifying the distribution and abundance of invasive alien species (Hellmann et al. Reference Hellmann, Byers, Biderwagen and Dukes2008; Walther et al. Reference Walther, Roques, Hulme, Sykes, Pysek, Kühn, Zobel, Bacher, Botta-Dukát, Bugmann, Czúcz, Dauber, Hickler, Jarosík, Kenis, Klotz, Minchin, Moora, Nentwig, Ott, Panov, Reineking, Robinet, Semenchenko, Solarz, Thuiller, Vilà, Vohland and Settele2009). All biomes will be influenced by climate change (Williams et al. Reference Williams, Jackson and Kutzbach2007), and although many species will be able to adapt to climate change effects, many others are likely to go extinct, resulting in biodiversity impoverishment. Secondary consequences of climate change for regional biodiversity will arise notably from changes to agro-ecosystems (Fischer et al. Reference Fischer, Shah, Tubiello and van Velhuizen2005), and displacement of people (Wetzel et al. Reference Wetzel, Kissling, Beissmann and Penn2012), which will add pressure on conservation and underdeveloped areas by shifting exploitation and agriculture, subsequently resulting in additional environmental degradation. Although these threats will occur simultaneously, most studies focus either on climate change (see for example Beaumont et al. Reference Beaumont, Pitman, Perkins, Zimmermann and Yoccoz2010) or sea-level rise (see Wetzel et al. Reference Wetzel, Beissmann, Penn and Jetz2013).
Among the regions of utmost importance for conservation, and for which such studies are especially needed, are the biodiversity hotspots. Biodiversity hotspots harbour an exceptionally high number of unique vascular plant species (at least 1500 vascular plants), with a high proportion having only 30% of their original natural vegetation remaining (Mittermeier et al. Reference Mittermeier, Gil, Hoffman, Pilgrim, Brooks, Mittermeier, Lamoreux, Fonseca and Gil2004). About 60% of threatened mammals, 63% of threatened birds, and 79% of threatened amphibians are found exclusively within the hotspots (Mittermeier et al. Reference Mittermeier, Turner, Larsen, Brooks, Gascon, Zachos and Habel2012). Understanding the potential consequences of climate change for biodiversity within these regions should be a high priority for researchers and managers alike (Schmitt Reference Schmitt, Zachos and Habel2011). In addition, coastal and insular regions are predicted to be among the first environments affected by climate change (Feagin et al. Reference Feagin, Sherman and Grant2005), and some biodiversity hotspots appear to be highly vulnerable to sea-level rise (Malcolm et al. Reference Malcolm, Liu, Neilson, Hansen and Hannah2006; Bellard et al. Reference Bellard, Leclerc and Courchamp2013a ). Numerous reports have discussed risk, exposure and adaptation for broad regions of Australia, such as Queensland (see Beer et al. Reference Beer, Tually, Kroehn, Martin, Gerritsen, Taylor, Graymore and Law2013) or smaller regions (see Shoo et al. Reference Shoo, O’Mara, Perhans, Rhodes, Runting, Schmidt, Traill, Weber, Wilson and Lovelock2014), but none have focused on the newly-declared 35th biodiversity hotspot of ‘East Australia’ (Williams et al. Reference Williams, Ford, Rosauer, Silva, De, Russell, Mittermeier, Larsen, Margules, Zachos and Habel2011).
The East Australian hotspot could be highly susceptible to climate change, but may have great capacity for effective conservation management (Williams et al. Reference Williams, Ford, Rosauer, Silva, De, Russell, Mittermeier, Larsen, Margules, Zachos and Habel2011). It harbours 2144 endemic plant species that constitute 25.9% of the vascular plants in the hotspot. The predominantly coastal and fragmented nature of this hotspot, combined with a growing human population promoting species invasions and pollution, suggests a potentially high vulnerability to the effects of climate change and sea-level rise. Indeed, only 23.3% of residual and naturally bare areas remain in the hotspot, while the rest has been modified, transformed, replaced or removed (Williams et al. Reference Williams, Ford, Rosauer, Silva, De, Russell, Mittermeier, Larsen, Margules, Zachos and Habel2011). Due to the increase in negative effects of habitat loss on species density and/or diversity with climate change (Mantyka-Pringle et al. Reference Mantyka-pringle, Martin and Rhodes2012), the consequences of climate change are anticipated to be substantial in this hotspot, which harbours many amphibian species already at risk of extinction and has a high intrinsic vulnerability to climate change (Foden et al. Reference Foden, Mace, Vié, Angulo, Butchart, DeVantier, Dublin, Gutsche, Studart, Turak, Vié, Hilton-Taylor and Stuart2008). The birds located in this region are also susceptible to climate change, with low adaptive capacity (Foden et al. Reference Foden, Butchart, Stuart, Vié, Akçakaya, Angulo, DeVantier, Gutsche, Turak, Cao, Donner, Katariya, Bernard, Holland, Hughes, O’Hanlon, Garnett, Sekercioğlu and Mace2013). However, the likely effects of climate change on the biodiversity within this this newly declared hotspot have not yet been assessed.
Here, we quantify (1) the hotspot's vulnerability to sea-level rise; (2) the exposure of the hotspot to local climate change; and (3) the secondary consequences of climate change and sea-level rise for land-use classes and subsequent human population displacement. Because most conservation planning and actions fail to consider all aspects of future climate changes (Courchamp et al. Reference Courchamp, Hoffmann, Russell, Leclerc and Bellard2014), we identify areas of greatest biodiversity value, low protection levels, and high vulnerability to future threats. We further demonstrate the importance of considering future threats to formulate effective conservation strategies in a climate change context.
METHODS
Forests of East Australia
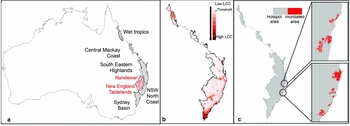
The Forests of East Australia hotspot occurs along a discontinuous coastal stretch of Australia's east coast and also incorporates eight islands (Figs 1 a and S3, see Supplementary material). It combines two World Wildlife Fund (WWF) ecoregions: the Eastern Australian Temperate Forests and Queensland's Tropical Rain Forests (Williams et al. Reference Williams, Ford, Rosauer, Silva, De, Russell, Mittermeier, Larsen, Margules, Zachos and Habel2011), divided into seven bioregions (Interim Biogeographic Regionalisation for Australia [IBRA]; Thackway & Cresswell Reference Thackway and Cresswell1995) including two under-represented bioregions with < 10 % of their remaining area in protected areas (Fig. 1 a, see Supplementary material). Only 23% (58900 km2 of total area) of its natural habitat remains, but a wide range of environments still harbour many endemic species, including at least 2144 plants, 28 birds, 70 reptiles, 10 freshwater fish, 38 amphibians and six mammals (Williams et al. Reference Williams, Ford, Rosauer, Silva, De, Russell, Mittermeier, Larsen, Margules, Zachos and Habel2011). The human population is rapidly increasing its influence within the hotspot, with a population of over nine million in 2006, and an average population density of 36 people per km2, mainly concentrated along the coast. According to Williams et al. (Reference Williams, Ford, Rosauer, Silva, De, Russell, Mittermeier, Larsen, Margules, Zachos and Habel2011), a total of 165400 km2 (65%) is under some form of production land use, including 13700 km2 (8.3%) categorized as ‘intensive’ land use, 70 400 km2 (42.6%) under ‘production from dryland agriculture and plantations’, 5700 km2 (3.4%) under ‘production from irrigated agriculture and plantations’ and 75600 km2 (45.7%) categorized as ‘production from relatively natural environments’ (Table S1, see Supplementary material). A combined total of c. 46600 km2 (18.41%) of the land area is protected within International Union for Conservation of Nature (IUCN) protected area categories I–VI (IUCN 2015): c. 15800 km2 (6.24%) in category I (Strict Nature Reserve), 25200 km2 (9.96%) in category II (National Park), c. 200 km2 (0.09%) in category III (Natural Monument), c. 100 km2 (0.04%) in category IV (Habitat/species Management Area), c. 100 km2 (0.04%) in category V (Protected Landscape) and c. 5200 km2 (2.04%) in category VI (Managed Resource Protected Area) (Fig. S1, see Supplementary material).
The hotspot and its exposure to climate change. (a) Location of the hotspot divided in seven bioregions. Red bioregions represent bioregions that are currently under-represented in protected areas. (b) Indices of local climate change (LCC) for the A1B scenario, represented by the standard Euclidian distance between the current and future climate predictions for each grid point (see main text for details). The threshold represents the value at which the climate is statistically different from the current climate found in the hotspot (namely the non-analogous climate). (c) Areas predicted to be permanently under water with a 2-m sea-level rise.

Sea-level rise
We quantified the hotspot's vulnerability to sea-level rise by determining the land area (including standing fresh water such as rivers, lakes, wetlands and associated habitat) that will be submerged under the 1- and 2-m sea-level rise scenarios concordant with projections to 2100 (Overpeck et al. Reference Overpeck, Otto-Bliesner, Miller, Muhs, Alley and Kiehl2006; Rahmstorf Reference Rahmstorf2007; Pfeffer et al. Reference Pfeffer, Harper and O’Neel2008; Grinsted et al. Reference Grinsted, Moore and Jevrejeva2009; Nicholls & Cazenave Reference Nicholls and Cazenave2010). Hotspot elevation data were obtained from the USA's National Aeronautics and Space Administration (NASA) shuttle radar topography mission with 90-m resolution (Jarvis et al. Reference Jarvis, Reuter, Nelson and Guevara2008), which show a very good agreement with surface location data (Rexer et al. Reference Rexer and Hirt2014), although the vertical error could be significant in some areas (such as very mountainous regions). This dataset has already been used to assess potential effects of sea-level rise (Wetzel et al. Reference Wetzel, Kissling, Beissmann and Penn2012; Bellard et al. Reference Bellard, Leclerc and Courchamp2013a ). We used the extract function from the raster package for the hotspot and its eight associated islands to assess the vulnerability of each pixel to sea-level rise (R Core Team 2013, raster package) by calculating the area subject to projected sea-level rise (see Bellard et al. Reference Bellard, Leclerc and Courchamp2013a for details). We first considered only cells below a projected sea-level rise that were initially flooded; subsequently, we only considered flooded cells that were connected to the ocean.
Climate change
Data
To determine areas that would experience climate change, we compared current climate data averaged from 1950–2000 from the Worldclim database (Hijmans et al. Reference Hijmans, Cameron, Parra, Jones and Jarvis2005) with simulations of future climates at 10′ resolution (namely 18.6 km × 18.6 km). We used six different climate variables: mean temperature, maximum temperature of warmest month, minimum temperature of coldest month, annual precipitation, precipitation of wettest month and precipitation of driest month. Future climate data were extracted from the Global Climate Model data portal (Global Climate Model 2013) at the 10′ resolution (Ramirez-Villegas & Jarvis Reference Ramirez-Villegas and Jarvis2010). Simulations of future climate were based on three general circulation models (namely HADCM3 [the Hadley Centre Coupled Model, version 3], CSIRO2 [the CSIRO Mark 2 global climate model with slab ocean] and CGCM2 [the Canadian Second Generation Coupled Global Climate Model]), with data averaged from 2070 to 2099 (Intergovernmental Panel on Climate Change 2015). These models were statistically downscaled from the original global change model outputs using the delta method (Ramirez-Villegas & Jarvis Reference Ramirez-Villegas and Jarvis2010). The delta data with respect to the baseline climate were calculated for each of the variables and months. These anomalies were then interpolated using a thin plate spline interpolation (Ramirez-Villegas & Jarvis Reference Ramirez-Villegas and Jarvis2010). We used a low (B2A) and a high CO2 (A1B) emission scenario, respectively, to capture the range of potential climatic outcomes. These scenarios reflect different assumptions about demographic, socioeconomic and technological development on greenhouse gas emissions (Solomon et al. Reference Solomon, Qin, Manning, Chen, Marquis, Averyt, Tignor and Miller2007).
Climate analogue analysis
We used the method of Williams et al. (Reference Williams, Jackson and Kutzbach2007) to quantify climate dissimilarities (standardized Euclidean distances [SED]) between current and future climates within the hotspot at 10′ resolution (namely 18.6 km × 18.6 km), as follows:
 \begin{equation*}
SED_{ij} \; = \;\sqrt {\sum\limits_{k\; = \;1}^6 {\frac{{(a_{kj} \; - b_{ki} )^2 }}{{S^2 _{kj} }}} }
\end{equation*}
where akj and bki are the current and future means for climate variable k at grid points i and j, and skj is the standard deviation of interannual variability across the 30-yr climate window (namely 2070–2099). Standardizing each variable placed all climate variables on a common scale (Veloz et al. Reference Veloz, Williams, Blois, He, Otto-Bliesner and Liu2012). The standardization values were temperature seasonality for temperature variables and precipitation seasonality for precipitation variables. High SED values corresponded to high climate dissimilarities between two periods and potentially indicated novel or disappearing climates (Williams et al. Reference Williams, Jackson and Kutzbach2007; Veloz & Williams Reference Veloz and Williams2011).
We calculated a SED threshold (SEDt) for the hotspot to statistically determine the limit above which the climate was no longer considered analogous to current conditions (namely climate loss), by comparing the distribution of SED values between the hotspot and the rest of the world for the current period. We used the receiver operating characteristic to determine the SEDt value to provide the statistical optimal separation within- and between-surface histograms (Oswald et al. Reference Oswald, Brubaker, Hu and Gavin2003). Therefore, the SEDt was associated with an evaluation of the threshold (the area under the curve [AUC]). Our AUC value of 0.714 indicated that the threshold discriminated fairly between analogue and non-analogue climates within the hotspot (Fig. S2, see Supplementary material).
Using the SEDt, we calculated three indices of climatic change following the methodology of Williams et al. (Reference Williams, Jackson and Kutzbach2007). First, we calculated the SED between the current and future climate data for each grid point (an index of the intensity of local climate change). Then we calculated the SED between the future for each hotspot grid point and its closest analogue from the global pool of current climates (an index of the novelty of future climates, with no contemporary analogue globally), and we calculated the SED between the current climate for each hotspot grid point and its closest future climate analogue (an index of disappearance of extant climate, being contemporary climate conditions that have no future analogue globally).
Secondary consequences of climate change and sea-level rise
We quantified the secondary consequences of climate change due to inundation or loss of analogous climates for land-use classes and sub-classes, and for human population displacement. Spatial analysis of percentage of land-use and land-cover classes affected by either climate change or sea-level rise was based on the Australian Land Use and Management (ALUM) Version 7 at 50-m resolution (ALUM 2010). For each affected area, we calculated the proportion of each land-use class and sub-class, including protected areas. Human population density data were sourced from the Gridded Population of the World, version 3 (GPWv3) extrapolated from 2000 to the year 2006 (CIESIN [Center for International Earth Science Information Network] 2013).
Species richness and protection analysis
We explored the relationship between type of protected area and species richness using a bivariate plot at 0.5° resolution (50 km). Species occurrence data recorded between 1990 and 2010 were sourced from the Atlas of Living Australia (2013) for 18 414 species from seven different taxa: 119 amphibians; 5531 arthropods; 1098 fishes; 218 mammals; 923 molluscs; 10267 plants; and 258 reptiles. Species richness ranged from 0 to 943 (median 53) species per pixel, all taxa combined. We classified low species richness as ≤ 53 species and high species richness as > 53 species. Low protected area was defined as unprotected, other minimal use, or IUCN protected area categories V and VI (transformed by long-term interactions with humans [such as agriculture or forestry areas] or use of natural resources [hunting and grazing areas]), while high protected area was defined as area within IUCN categories I, II, III and IV.
RESULTS
Sea-level rise and climate change
According to our model, in total, almost 890 km2 (0.26%) of the hotspot's land area would be permanently inundated with a 1-m sea-level rise, this area increasing to 1980 km2 (0.59%) with a 2-m sea-level rise, with water intrusion reaching up to 35 km inland (Figs 1 c and S4, see Supplementary material). The eight islands would have no more than 4% of area inundated per island (Fig. S3, see Supplementary material).
Climate change
Of the existing climates throughout the hotspot, 98% (under the A1B scenario) or 100% (under the B2A scenario) were predicted to persist by 2070–2099. The fraction of land area with a novel climate was only 1.65%, thus, only species occurring within this area would confront new climatic conditions. However, persistence of climates did not necessarily mean that such climates were predicted to remain in the same areas. Indeed, local climate change was predicted to occur over 40.61% (A1B scenario) and 10.27% (B2A scenario) of the area, respectively. This local climate change was strongly concentrated in southern New South Wales (the Sydney Basin bioregion) and north Queensland (the Wet Tropics bioregion) under both the A1B (Fig. 1 b) and the B2A scenarios (Figs S5 and S6, see Supplementary material). In contrast, the Central Mackay Highlands, South Eastern Highlands and the northern part of the Sydney Basin were predicted to be climatically stable under both emission scenarios.
For any point in the hotspot, the mean geographic distance to the closest analogue climate was predicted to double under the A1B scenario by 2070–2099 (Fig. S7, see Supplementary material). However, in the Sydney Basin and Wet Tropics bioregions most impacted by climate change, the distance to the closest future analogue climate could be less than that it is currently. The average distance to the closest analogue climate is modelled as c. 300 km in the Wet Tropics region, and c. 792 km for areas exposed to sea-level rise (Fig. S8, see Supplementary material).
Secondary consequences of climate change and sea-level rise
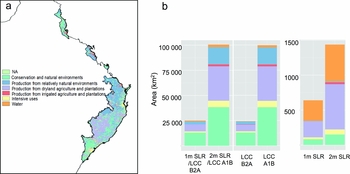
Permanent inundation, assuming either a 1- or 2-m sea-level rise, would displace 20 600 (0.25%) or 69 600 (0.83%) people, respectively, especially around Grafton, Port Macquarie and Taree (Fig. S4 and Table S2, see Supplementary material). Of the land-use classes (Table S1, see Supplementary material), 1- and 2-m sea-level rises were projected to inundate agricultural areas by 233 km2 (36%) and 652 km2 (45%), respectively, while for water, these values were 293 km2 (46%) and 524 km2 (36%) (Fig. 2). The most affected sub-classes of agricultural areas were native and exotic pasture mosaic and cropping, and those of water were river, and marsh and wetland (Table S3, see Supplementary material). About 81 km2 (13%) and 149 km2 (10%) of the natural areas land-use class was projected to be permanently submerged under the 1- and 2-m scenarios, respectively. Most of natural areas predicted to be inundated consisted of national park. In contrast, only 27 km2 (4%) and 72 km2 (5%) of the inundated areas were of the urban or agricultural land-use class under the two scenarios, respectively.
(a) Map of the hotspot with land-use classes: ‘conservation and natural environments’, ‘production from relatively natural environments’, ‘production from dryland agriculture and plantations’, ‘production from irrigated agriculture and plantations’, ‘intensive uses and water’ land classes. (b) Land area (km2) of the land-use and cover classes predicted to be affected by local climate change and sea-level rise under the two scenarios A1B (2-m sea-level rise) and B2A (1-m sea-level rise).

Between 1.2 and 5 million people (15% and 59% of the hotspot population in 2006) would be exposed to local climate change, according to the emission scenarios (Table S2, see Supplementary material). The natural areas land-use class was projected to experience the greatest local climate change, with 13003 km2 (53%) and 38222 km2 (38%) affected under the B2A and A1B emission scenarios, respectively, predominantly within the national park and residual native cover sub-classes (Table S3, see Supplementary material). The next most affected land-use class was agricultural areas, with 6670 km2 (27%) and 34150 km2 (34%), respectively, predominantly in the native and exotic pasture mosaic (Table S3, see Supplementary material). Local climate change was also predicted to affect 2942 km2 (12%) and 16941 km2 (17%), respectively, of the production from relatively natural environments land-use class (Table S3, see Supplementary material).
Combining local climate change and sea-level rise, natural areas was the most affected land class (13080 km2 [52%] and 38319 km2 [38%]) under the combined 1m/B2A and 2m/A1B scenarios, respectively (Fig. S9 and Table S4, see Supplementary material). The next most affected land-use class was agricultural areas (6841 km2 [27%] and 34 365 km2 [34%], respectively), followed by production from relatively natural environments (2946 km2 [12%] and 16956 km2 [17%], respectively) (Table S4, see Supplementary material).
Species richness and protection
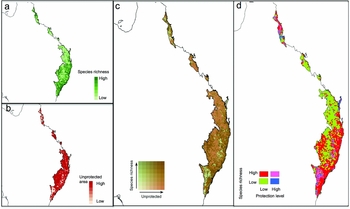
The level of protection was low for 87% of the area (Fig. 3 a, b). Regions with the least protection and low species richness were mainly inland Queensland and New South Wales (Fig. 3 c, d). The regions with the greatest species richness and lowest protection were the Wet Tropics, Nandewar, New England Tablelands, and Sydney Basin bioregions (Fig. 3 c, d).
Diagnostic maps of (a) species richness, (b) protection levels, (c) categories of IUCN protection class and species richness. (d) Biplot: areas in red are those with a low protection level and high species richness.

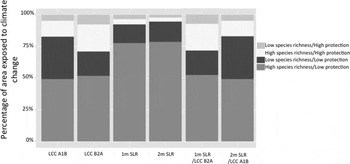
More than 75% of the area affected by sea-level rise was in regions with high species richness and low protection. In addition, because most of the areas affected by sea-level rise are river, marsh and wetland (Table S3, see Supplementary material), many freshwater species that are located along the New South Wales north coast will be affected by sea-level rise. The average species richness was about 150 species per pixel for areas threatened by sea-level rise. In addition, most of the areas affected by sea-level rise are surrounded by unprotected areas (Fig. 3 b). Local climate change predominantly affected areas with high species richness and low protection: 49% and 52% of these areas were affected under the A1B and B2A scenarios, respectively. However, the areas surrounding the Wet Tropics and Sydney basin bioregions are predominantly protected. Local climate change also affected 12% and 22% of areas with both high species richness and high protection under the A1B and B2A scenarios, respectively.
Considering all components of climate change simultaneously, areas with low protection and high species richness comprised 50% or more of the total affected area in all scenarios, followed by areas with low protection and low species richness, which ranged between 19% and 34% of the total affected area (Fig. 4 and Table S5, see Supplementary material).
Percentage of area with low or high species richness and protected areas exposed to loss of analogue climate (LCC, under A1B or B2A scenarios) or under a 1- or 2-m sea-level rise (SLR) for both single scenarios or combinations of scenarios.

DISCUSSION
Our study demonstrates the importance of simultaneously taking into account primary and secondary effects of climate and sea-level rise in this area. The projections indicate that the current protection of the hotspot, based mainly on accumulating small areas of protected lands across Australia, will be insufficient to mitigate impacts of climate change for biodiversity (see also Mackey et al. Reference Mackey, Watson, Hope and Gilmore2008).
We draw three key points about climate change effects on the hotspot. First, local climate change will influence a much larger area than will inundation. We predict that local climate change will be widespread, occurring over a combined area of c. 100000 km2 (41%), predominantly in the north and south extremes of the hotspot by 2070–2099. We predict that the Wet Tropics and Sydney Basin bioregions will be most affected; species will have to respond in space (by movement), time (by phenology) or intrinsically (by physiology) (Bellard et al. Reference Bellard, Bertelsmeier, Leadley, Thuiller and Courchamp2012). If species are unable to adapt to these new climate conditions, they will have to relocate by an average distance of c. 703 km to reach their closest analogue climates, although predictions for the Sydney Basin and Wet Tropics indicate that the closest analogue climates may in fact be closer in the future (Fig. S7, see Supplementary material). The two under-represented bioregions, Nandewar and New England Tablelands, will be moderately affected by climate change. Unlike some other hotspots, which are predicted to be subject to significant levels of inundation from sea-level rise (Bellard et al. Reference Bellard, Leclerc and Courchamp2013a ), the Forests of East Australia hotspot will only lose 890 km2 of its area to sea-water intrusion under the 1-m scenario, concentrated in the coastal south-east (the New South Wales North Coast bioregion). However, inundation due to sea-level rise is likely to be underestimated, because negative impacts will affect wider areas and occur long before complete inundation due to salt-water intrusion or high tides. Second, displacement of people and property will occur. Despite the relatively small area anticipated to be inundated by sea-level rise, this change will potentially displace at least 20 600 people (according to 2006 population figures extrapolated from 2000 data). This result is likely to be underestimated because the New South Wales and Queensland population growth rates have increased by 1.5% and 1.7%, respectively, over the last four years. Moreover, Australia takes in about 190000 migrants a year, and about half of these go to the states of New South Wales and Queensland, so it is likely that even more people will experience sea-water inundation in the coming decades. The consequences here are twofold. Although nothing can be stated about where these people would translocate to, ultimately the human migration would lead to additional threats for biodiversity. The numerous species populations with distributions entirely or predominantly within the projected inundation zones (> 75% area with high species richness under low protection) highlight the future threat of sea-level rise to biodiversity; freshwater species will be disproportionally affected by sea-level rise (Fig. 2). Some threatened species will likely be limited in their movements. For example, birds relying on coastal habitats may be unable to relocate since they are already threatened by invasive species and the human use of coasts (Garnett et al. Reference Garnett, Franklin, Ehmke, Vanderwal, Hodgson, Pavey, Reside, Welbergen, Butchart, Perkins and Williams2013). Although we predict where the secondary threats are likely to occur, we did not model human responses to local climate change or sea-level rise; this research should be a top priority in future.
Third, local climate change will predominantly affect natural areas such as national parks. Approximately half of the natural areas within the hotspot have low protection, leading to a decreased ability for biodiversity to respond to climate change (Watson et al. Reference Watson, Fuller, Watson, Mackey, Wilson, Grantham, Turner, Klein, Carwardine, Joseph and Possingham2009). Overall, large changes in climate at the local scale are more likely to result in large changes in local suitability for populations than small changes, particularly when climate changes exceed local variability, which is the case here. Some species will doubtless be able to adapt to new climates through phenotypic plasticity or micro-evolution (Lavergne et al. Reference Lavergne, Mouquet, Thuiller and Ronce2010; Peñuelas et al. Reference Peñuelas, Sardans, Estiarte, Ogaya, Carnicer, Coll, Barbeta, Rivas-ubach, Llusià, Garbulsky, Filella and Jump2013), but many others may not. Identifying areas where climate will be significantly different (disappearing climate) in the hotspot, will help determine where species are in greatest need to be monitored, protected and potentially assisted because they will have to adapt to the new climate conditions. Species can also persist by range reduction to microhabitats called refugia. Our results also showed that climate stability will mainly occur in the South Eastern Highlands and northern part of the Sydney Basin bioregions. In this context, corridors facilitating movements inside the Sydney Basin bioregion and between the New South Wales North Coast, New England Tablelands, Nandewar and South Eastern Highlands will greatly assist species to find climate refugia.
Local climate changes over primary production lands could merely induce a change in productivity and production type. For example, crops can respond positively to elevated CO2 in the absence of climate change (Ainsworth & Long Reference Ainsworth and Long2005). However, the associated impacts of high temperature, precipitation changes, and possibly increased frequency of extreme climatic events, will probably depress yields and increase production risks (Fischer et al. Reference Fischer, Shah, Tubiello and van Velhuizen2005). These changes may also increase the risk of invasive insect pests and weeds (Lobell et al. Reference Lobell, Burke, Tebaldi, Mastrandrea, Falcon and Naylor2008). But there may also be a requirement to convert some natural areas to agriculture where climates suited to certain crops shift away from current agricultural areas. Habitat loss due to agricultural conversion and activities is already the greatest threat affecting species in eastern Australia (Evans et al. Reference Evans, Watson, Fuller, Venter, Bennett, Marsack and Possingham2011), and climate change is likely to exacerbate this issue. In addition, high local climate change is likely to induce extreme temperatures, droughts, and windstorms, which are already affecting the human population (Raleigh & Jordan Reference Raleigh, Jordan, Mearns and Norton2010).
There are important caveats to our approach that need to be addressed. First, climate change effects varied greatly with the two CO2 emission scenarios, highlighting the importance of considering different emission scenarios. Second, we used climate, land-use and species-richness data at different spatial scales. Although this will have had little influence on the results of land-use classes affected by climate and sea-level rise, the exposure of biodiversity to climate change may be subject to overestimation. When assessing the impact of climate change on land-use patterns, we also assumed that, in the future, they would remain spatially the same as they currently are; this is not necessarily true. We also expected that land subject to sea-level rise will be inundated, although a low increase in sea-level can be balanced by sediment supply and morphological adjustments (Webb & Kench Reference Webb and Kench2010). However, a 1-m increase in sea level by 2100 is unlikely to be compensated by these physical responses in this time frame. The level of sea-level rise is predicted to be regionally dependent, which we were not able to consider due to lack of available data. In addition, the elevation data were limited by their vertical resolution; this could be highly significant in mountain regions, which are not at great risk from sea-level rise. However, novel approaches like a Monte Carlo uncertainty propagation analysis can be used to incorporate uncertainty in coastal mapping (Leon et al. Reference Leon, Heuvelink and Phinn2014). Moreover, species richness may not provide the best illustration of direct and indirect impacts of climate change on biodiversity. Other metrics that may be more suitable would quantify genetic, functional or ecosystem diversities (Devictor et al. Reference Devictor, Mouillot, Meynard, Jiguet, Thuiller and Mouquet2010) because climate change will affect both biodiversity patterns (Lawler Reference Lawler2009) and trophic interactions (Peñuelas et al. Reference Peñuelas, Sardans, Estiarte, Ogaya, Carnicer, Coll, Barbeta, Rivas-ubach, Llusià, Garbulsky, Filella and Jump2013). However, species richness was the most feasible metric at this scale.
Multiple conservation and research directions for the hotspot at the bioregion scale are indicated. Largely, these directions are in line with the high-level policy action directed at climate-change mitigation and adaptation in Australia (Dunlop et al. Reference Dunlop, Hilbert, Stafford Smith, Davies, James, Ferrier, House, Liedloff, Prober, Smyth, Martin, Harwood, Williams, Fletcher and Murphy2012; Beer et al. Reference Beer, Tually, Kroehn, Martin, Gerritsen, Taylor, Graymore and Law2013).
First, the greatest conservation benefits would be obtained by either maintaining or increasing the conservation status of areas in the northern (Wet Tropics) and southern (Sydney Basin) extremities of the hotspot. These regions contain most species and were predicted to be most affected by local climate change. Existing protected areas in these bioregions are not located where most climate change will occur. Greater conservation outcomes will also be achieved by increasing protected area extent, particularly for currently low protection areas with high species richness, or in areas containing species of conservation concern. Even if protected areas might be less suited in the future to support the species they were originally designed for, they nevertheless play an important role as establishment centres of species spreading to new habitats (Hiley et al. Reference Hiley, Bradbury, Holling and Thomas2013). Moreover, areas with low species richness may still have high importance for biodiversity, because they can harbour highly threatened species, endemic species, or act as a corridor between areas of greater conservation value.
Second, to accommodate the great number of species range shifts likely to occur throughout the hotspot, there will need to be greater connectivity of protected areas (Hodgson et al. Reference Hodgson, Thomas, Wintle and Moilanen2009) because these will only be effective if species are able to move among them. In particular, Wet Tropics species will have to move about 300 km to find the closest analogue conditions, while species from Sydney Basin will have to move three times further (Fig. S7, see Supplementary material). As a consequence of protected areas historically focused on remnant habitats or particular species (Williams et al. Reference Williams, Ford, Rosauer, Silva, De, Russell, Mittermeier, Larsen, Margules, Zachos and Habel2011), they are currently highly fragmented and not conducive to species’ range shifts. Corridors creating connectivity among existing conservation areas should allow movements of species, however, the velocity of climate change is expected to outpace the dispersal ability of most terrestrial species (see for example Devictor et al. Reference Devictor, Julliard, Couvet and Jiguet2008). Interventions such as assisted translocation may be required (Thomas Reference Thomas2011). Determining which species will or will not require intervention, and whether such intervention is possible or feasible, will increasingly need to be considered. Identifying the circumstances under which the benefits of translocation outweigh the potential costs is essential (Ricciardi & Simberloff Reference Ricciardi and Simberloff2009; IUCN SSC [IUCN Species Survival Commission] 2013; Harris et al. Reference Harris, Arnall, Byrne, Coates, Hayward, Martin, Mitchell and Garnett2013). Given the current network of terrestrial protected areas fails to adequately represent biodiversity (Le Saout et al. Reference Le Saout, Hoffmann, Shi, Hughes, Bernard, Brooks, Bertzky, Butchart, Stuart, Badman and Rodrigues2013), there is a need to identify future areas. New protected areas should aim to maximize representation of all environments in a given region, not just aim to improve inclusion of under-represented ecotypes (NRMMC [Natural Resource Management Ministerial Council] 2010). Functional and ecosystem biodiversity will also need to be accounted for in this hotspot. Additionally, since most protected areas suffer from ongoing declines in populations and fail to conserve species diversity (Craigie et al. Reference Craigie, Baillie, Balmford, Carbone, Collen, Green and Hutton2010; Geldmann et al. Reference Geldmann, Barnes, Coad, Craigie, Hockings and Burgess2013), effective conservation methods are needed.
Third, greater preparedness for change will reduce long-term climate change issues. For example, habitat engineering that is aimed at restoration and the removal of other threatening processes will help habitat to deal with climate change (McClanahan et al. Reference McClanahan, Cinner, Maina, Graham, Daw, Stead, Wamukota, Brown, Ateweberhan, Venus and Polunin2008). Major threats for this hotspot also include invasive alien species and habitat fragmentation, as almost two-thirds of Australia's threatened species are impacted by introduced plants or animals (Evans et al. Reference Evans, Watson, Fuller, Venter, Bennett, Marsack and Possingham2011) and invasive alien species will also be affected by climate change (Hellmann et al. Reference Hellmann, Byers, Biderwagen and Dukes2008). However, it remains unclear whether these species will be promoted or disadvantaged by climate change (Bellard et al. Reference Bellard, Thuiller, Leroy, Genovesi, Bakkenes and Courchamp2013b ), thus such research should also be a priority locally. Our results have clearly shown that some specific land uses within the hotspot will experience change within a relatively short time, so planning for changed climate conditions should be a management priority.
CONCLUSION
Sea-level rise and local climate change are likely to occur across the hotspot. As climate change progresses, the balance between the needs of society and environment will need to be refined regionally. Areas vulnerable to direct and indirect effects of climate change are currently insufficiently protected, despite a high biodiversity. Suitable spatially-explicit conservation and sustainable development is essential in this biodiversity hotspot to prevent massive species loss. Conservation measures should focus on protection of both keystone species and climate refugia.
ACKNOWLEDGEMENTS
Celine Bellard was supported by a grant from the CNRS and Franck Couchamp was supported by a grant from the Biodiversa EraNet. There were no conflicts of interest.
Supplementary material
To view supplementary material for this article, please visit Journals.cambridge.org/10.1017/S037689291500020X.