





Introduction
Despite schizophrenia-spectrum psychosis affecting 23.6 million people worldwide (Solmi et al., Reference Solmi, Seitidis, Mavridis, Correll, Dragioti, Guimond, Tuominen, Dargél, Carvalho, Fornaro, Maes, Monaco, Song, Il Shin and Cortese2023), conclusive evidence for an underlying cognitive mechanism of illness is yet to be identified. One proposal cites imbalances in predictive processing: the integration of sensory evidence with prior expectations (priors; Fletcher & Frith, Reference Fletcher and Frith2009). While predictive mechanisms enable efficient perception, reliance on expectations can cause non-veridical perception even in health. For example, changes in an individual’s reliance on priors, often termed strength, are a possible mechanism for numerous illusions (Hohwy, Roepstorff, & Friston, Reference Hohwy, Roepstorff and Friston2008; Kok et al., Reference Kok, Bains, van Mourik, Norris and de Lange2016). A body of literature has extended this discussion to address positive symptoms of psychosis: anomalous percepts (hallucinations) and beliefs (delusions; Sterzer et al., Reference Sterzer, Adams, Fletcher, Frith, Lawrie, Muckli, Petrovic, Uhlhaas, Voss and Corlett2018). However, studies often employ a variety of different tasks with small samples and report conflicting results. Studies have reported both stronger (e.g. Powers, Mathys, & Corlett, Reference Powers, Mathys and Corlett2017) and weaker (e.g. Schmack, Schnack, Priller, & Sterzer, Reference Schmack, Schnack, Priller and Sterzer2015) priors in psychosis, while others suggest no significant difference compared to controls (Daalman et al., Reference Daalman, Verkooijen, Derks, Aleman and Sommer2012). Likewise, studies disagree on which symptoms are underpinned by aberrant priors. Findings often demonstrate a relationship with one symptom; for example, Colbert, Peters, and Garety (Reference Colbert, Peters and Garety2010) reported stronger priors related to delusional traits but not hallucinations. However, a comprehensive theory should explain common co-existent symptoms. One explanation for these discrepancies posits a hierarchy of priors reflecting the interlinked cortical hierarchy described in predictive processing (Hohwy, Reference Hohwy2013; Rao & Ballard, Reference Rao and Ballard1999). In this account, weaker lower-level sensory priors trigger a compensatory strengthening of priors reflecting higher-order beliefs about the environment (Sterzer et al., Reference Sterzer, Adams, Fletcher, Frith, Lawrie, Muckli, Petrovic, Uhlhaas, Voss and Corlett2018). Haarsma et al. (Reference Haarsma, Knolle, Griffin, Taverne, Mada, Goodyer, Fletcher and Murray2020) probed this theory using separate tasks, finding weaker perceptual (low-level) priors alongside stronger cognitive (high-level) priors in first-episode psychosis (FEP). This theory not only has the potential to reconcile findings but also offers an account of co-existent symptoms, with weaker perceptual priors triggering anomalous perceptions and stronger cognitive priors underpinning delusions. However, the possibility of a differential reliance on distinct types of priors across the cortical hierarchy has not yet been tested across paradigms or with a large patient cohort.
The diversity of paradigms and results discussing reliance on priors in psychosis calls for a systematic analysis. The current study conducts a meta-analysis comparing prior strength in schizophrenia-spectrum psychosis versus healthy controls. This offers increased statistical power to assess whether an altered reliance on priors can explain psychotic symptoms across tasks. Subsequent analyses investigate whether differential effects can be explained by a hierarchy of priors, offering a much-needed empirical evaluation of this frequently cited theory. As a theory of psychosis should explain symptoms, separate meta-analyses are conducted to address the relationship between reliance on priors and delusions and hallucinations. Overall, these analyses explore whether discussions of universally strong or weak priors in psychosis offer an oversimplified description of interdependent mechanisms that reflect a hierarchy of priors and explain co-existent symptoms. Overall, this contributes a systematic summary of quantitative results and suggests directions for future research.
Methods
Systematic review protocol
The review protocol (Miller-Silva, Murray, & Martey, Reference Miller-Silva, Murray and Martey2024) was pre-registered in the PROSPERO registry (CRD42024574379) to reduce the risk of bias and provide a transparent record of decision-making. Analyses not featured in this protocol are labelled ‘exploratory’.
Population and controls
This review consisted of studies with medicated or unmedicated schizophrenia-spectrum psychosis patients, including FEP, diagnosed by a clinician or researcher using a widely accepted diagnostic tool. Studies with participants classified as at-risk mental state (ARMS) or with psychosis caused by either a short-term, drug-induced state or neurological disorder were excluded. Controls had no known history of psychosis, ARMS status, or neurological disorder. All participants were adults (≥18 years).
Intervention
This review defines priors as beliefs about upcoming sensory information that can potentially bias perception. Included studies featured prior-inducing stimuli as the intervention, and these could take various forms (e.g. written information, stimulus conditioning). Only paradigms implementing a controlled manipulation of priors were included, meaning that reliance on priors was unequivocally tested. This criterion was necessary given that predictive processing is often cited as a unified theory of brain function (Clark, Reference Clark2013); therefore, many task outcomes could be interpreted as reflecting the use of predictive cues. This led to the exclusion of some commonly used tasks that assess patients’ susceptibility to illusions (e.g. Kaliuzhna et al., Reference Kaliuzhna, Stein, Rusch, Sekutowicz, Sterzer and Seymour2019) as these paradigms often have no direct manipulation of priors but assume that task performance relies on prior knowledge of natural scene statistics. A systematic review of visual illusion tasks in patients was recently completed (Costa et al., Reference Costa, Costa, Pessoa, Caixeta and Maior2023).
Outcomes
Study results represented participants’ reliance on priors. Included data were quantitative, continuous, and behavioral (e.g. accuracy, response bias). Imaging results were excluded. Studies investigated the effect of priors on perception (e.g. visual detection, audiovisual integration, motion processing). Tasks with a main outcome assessing metacognition (confidence, agency) or other higher-level abilities (e.g. planning, learning, memory, mentalizing, time perception, language, emotion recognition) were excluded. Representational momentum, time-to-collision, and jumping to conclusions tasks were thus excluded. Given the broad definition of ‘priors’ and variety of paradigms, this aimed to limit the scope of the review to a more similar, defined subset of perceptual tasks.
Data examining the relationship between prior strength and hallucinations and delusions in patients were also extracted in the form of group comparisons (e.g. patients with versus without hallucinations) or correlations with symptom scores. Results for psychosis-like experiences in controls (schizotypy) were not extracted.
Study design
Quantitative English-language papers were included in the review. Reviews (including systematic reviews and meta-analyses) were excluded as they presented no original data. Case reports were excluded.
Literature search and screening
The literature search was conducted between 7th August 2024 and 31st October 2024 using Embase (including a grey literature search of bioRxiv and medRxiv), MEDLINE, APA PsycINFO, and APA PsycArticles (full search strategy in Supplementary Appendix A). The bibliographies of included articles were hand-searched for additional references. The search filtered articles from 1st January 2005 onwards. This period covers the most relevant papers given that a seminal study on prediction and psychosis was published that year (Ford & Mathalon, Reference Ford and Mathalon2005), followed by a review of predictive processing in schizophrenia (Fletcher & Frith, Reference Fletcher and Frith2009).
This review followed the Preferred Reporting Items for Systematic Reviews and Meta-Analyses (PRISMA; Page et al., Reference Page, McKenzie, Bossuyt, Boutron, Hoffmann, Mulrow, Shamseer, Tetzlaff, Akl, Brennan, Chou, Glanville, Grimshaw, Hróbjartsson, Lalu, Li, Loder, Mayo-Wilson, McDonald and Moher2021; Supplementary Appendix B). The screening process for articles was independently conducted in Rayyan (Ouzzani, Hammady, Fedorowicz, & Elmagarmid, Reference Ouzzani, Hammady, Fedorowicz and Elmagarmid2016) by C.M.-S. and K.M.
Data extraction and quality assessment
Data extraction was conducted independently by C.M.-S. and K.M. in Microsoft Excel, with conflicts reviewed by G.K.M. The number of participants and summary statistics for age and sex were extracted for patients and controls separately. For patients, the diagnosis; diagnostic method; chlorpromazine-equivalent dosage; and scores for the Positive and Negative Syndrome Scale (PANSS; Kay, Fiszbein, & Opler, Reference Kay, Fiszbein and Opler1987), Peters, Joseph, & Garety (Reference Peters, Joseph and Garety1999) Delusion Inventory (PDI), and Cardiff Anomalous Perceptions Scale (CAPS; Bell, Halligan, & Ellis, Reference Bell, Halligan and Ellis2006) were extracted. Exclusion criteria for both participant groups and covariates were noted for the quality assessment.
For each task, descriptions of the paradigm, prior, and outcome measure were recorded. The type of prior in each task was coded as ‘perceptual’ or ‘cognitive’. Perceptual priors were defined as inducing implicit and/or automatic lower-level constraints on sensory processing. Cognitive priors induced higher-level beliefs that provided contextual abstractions, involving rapidly learned schemas, semantics, or explicit probabilities. For example, the (false) perception of a sound following exposure to a conditioned visual stimulus is the effect of a perceptual prior: the belief that the sound and visual stimulus always co-occur. In contrast, explicit information about the likelihood of perceiving a stimulus represents a cognitive prior. C.M.-S. and K.M. classified the priors, with conflicts resolved by G.K.M. Results were reported as group means and standard deviations, effect sizes, or correlation coefficients. If these statistics were missing from the article, an online plot digitizer (PlotDigitizer, 2025) was used to extract the group summary statistics from figures, or authors were contacted for the missing data. A qualitative summary of each finding and key interpretations by the authors were also recorded.
One anticipated challenge for this review was multiplicity, as studies often compare multiple patient groups to controls. Pre-registered inclusion criteria sought to reduce multiplicity and the risk of bias associated with the subjective selection of results for inclusion. For example, some studies feature separate groups for patients with and without active symptoms. As the research question focuses on the effect of psychosis on prior strength, results for patients with and without active symptoms were combined and compared to controls. The relationship between priors and individual symptoms was then explored in later analyses. Results from replications of paradigms with the same participant groups were averaged.
C.M.-S. and K.M. independently completed a quality assessment based on the Newcastle-Ottawa Scale (Wells et al., Reference Wells, Shea, O’Connell, Peterson, Welch, Losos and Tugwell2011; see Supplementary Appendix C for the adapted version used in this study) for each included article. This tool is recommended for reviews of case–control studies. This identified any studies with a high risk of bias (Table 1) for exclusion in a sensitivity analysis.
Table of studies included in the systematic review

Table 1. Long description
The table includes the following columns: Study, N (S Z) (sample size for schizophrenia-spectrum psychosis), N (H C) (sample size for healthy controls), Task domain, Task details, Outcome, Prior, Prior type, and R o B (Risk of Bias).
Key entries include:
* Abo Hamza et al. (2021): Visual detection (pareidolia) task with 50 S Z and 50 H C. Outcome: Number of illusory responses. Prior type: Cognitive. R o B: Low.
* Bansal et al. (2022): Motion perception task with 48 S Z and 36 H C. Outcome: Proportion of responses centered on initial motion direction. Prior type: Perceptual. R o B: Moderate.
* Cassidy et al. (2018): Auditory (tone duration) perception with 16 S Z and 17 H C. Outcome: Assimilation bias. Prior type: Perceptual. R o B: Low.
* Daalman et al. (2012): Auditory (voice) detection with 40 S Z and 40 H C. Outcome: Number of top-down responses. Prior type: Cognitive. R o B: Moderate.
* Galdos et al. (2011): Auditory (voice) detection with 30 S Z and 307 H C. Outcome: Number of speech illusions. Prior type: Perceptual. R o B: Moderate.
* Haarsma et al. (2020): Audiovisual (phoneme) perception with 30 S Z and 32 H C. Outcome: Change in indifference point. Prior type: Perceptual. R o B: Moderate.
* Powers et al. (2017): Audiovisual (tone detection) with 29 S Z and 15 H C. Outcome: Percentage of conditioned hallucinations. Prior type: Perceptual. R o B: Low.
* Schmack et al. (2015): Motion perception with 29 S Z and 32 H C. Outcome: Survival probability of percept. Prior type: Perceptual. R o B: Low.
* Thakkar et al. (2021): Visual perception (Negative Afterimage) with 36 S Z and 22 H C. Outcome: Luminance contrast of nuller. Prior type: Perceptual. R o B: Low.
* Vanes et al. (2016): Audiovisual detection with 40 S Z and 22 H C. Outcome: Difference in d-prime. Prior type: Perceptual. R o B: Low.
The table concludes with Weintraub et al. (2012) studying Auditory Segregation with 21 S Z and 22 H C, showing a Perceptual prior type and Low R o B.
Note: RoB, risk of bias; SZ, schizophrenia-spectrum psychosis patients; HC, healthy controls; N, number of participants.
Meta-analytic modelling
Meta-analyses were conducted in RStudio (v4.2.2; R Core Team, 2022) using the metafor (Viechtbauer, Reference Viechtbauer2010) and dmetar (Harrer, Cuijpers, Furukawa, & Ebert, Reference Harrer, Cuijpers, Furukawa and Ebert2019) packages. The dataset and analysis code are publicly available (osf.io/sr39g). The significance threshold for all analyses was 5%. All outcomes represented reliance on priors in patients versus controls to maximize their combinability. However, this meta-analysis pools effect sizes from different paradigms; hence, heterogeneity was explored in further analyses, and the implications of this are discussed.
The first meta-analysis compared the reliance on priors in patients versus controls. Effect sizes for each experiment were either calculated using group means and standard deviations or extracted directly from the articles. To create a standardized scale for outcome measures, effect sizes were converted to the standardized mean difference Hedges’ (Reference Hedges1981) g: a corrected version of Cohen’s d that has improved accuracy across sample sizes. Inverse values for g were computed where appropriate to ensure that positive values represented stronger priors in patients versus controls, while negative values indicated weaker priors in patients. These effect sizes were submitted to a random-effects, multi-level meta-analysis with studies weighted according to their precision. A random-effects model estimates the mean of a distribution of true effect sizes rather than a single true effect size (Hedges, Borenstein, Higgins, & Rothstein, Reference Hedges, Borenstein, Higgins and Rothstein2009). This was appropriate due to the heterogeneity in study methods (different tasks and priors) and populations (different illness stages and diagnoses). A three-level meta-analysis was required to account for the nesting of experiments within studies. Some studies conducted multiple tasks or calculated effect sizes for different prior types with the same participants. Failing to account for this non-independence could generate false-positive results. The first level of the model represented participants (i.e. sampling variance of the effect sizes), who were nested within experiments (i.e. within-study variance across multiple tasks) at the second level, which were nested within studies (i.e. between-study variance) at the third level. This method enabled the inclusion of multiple results per study, avoiding the subjective exclusion of results. The model assumes independence of effect sizes between studies (at level 3), which is justified as there was no overlap of participant samples across studies.
A planned subgroup analysis was conducted to assess whether heterogeneity in effect sizes was due to different prior types. This used the same three-level model but included prior type as a dummy-coded fixed effect with two levels (perceptual versus cognitive priors). While this two-level model of priors is likely an oversimplification of a broader hierarchy, this enabled an initial investigation into factors that may explain conflicting results in a field that is yet to clearly define the predictive processing hierarchy. Research has proposed that this two-level model may reveal associations between psychosis and stronger priors at one level to compensate for weaker priors at another level (Haarsma et al., Reference Haarsma, Knolle, Griffin, Taverne, Mada, Goodyer, Fletcher and Murray2020). A meta-analysis implementing this theoretical framework appraises its plausibility and generalizability across tasks.
Two further meta-analyses investigated the correlation between prior strength and 1) hallucinations and 2) delusions in patients. Most studies reported correlation coefficients between measures of prior strength and symptom scores from various questionnaires. Pearson’s r values could therefore be extracted from these papers directly. A few studies instead featured effect sizes comparing reliance on priors in patient groups with and without the symptom, and therefore the effect sizes needed to be converted to Pearson’s r. All r values were then converted to Fisher’s z and submitted to a three-level random-effects model.
Three-level models estimate within- and between-study heterogeneity. I 2 was used as an overall estimate of whether heterogeneity significantly affected the analysis (Higgins & Thompson, Reference Higgins and Thompson2002). Unlike Cochran’s (Reference Cochran1954) Q on which it is based, I 2 is robust to the number of studies in the analysis. However, as I 2 represents the variability in effect sizes not due to sampling error, its value tends to 100% as the precision of studies increases. Thus, prediction intervals (PIs) were used to estimate the range of effect sizes that will likely be reported by future studies. PIs are an interpretable form of the heterogeneity statistic τ2 and are unaffected by the number of studies or their precision.
For all analyses, publication bias was assessed using funnel plots and Egger’s test. Any influential outliers, which were identified using forest plot visualization and Cook’s distance, were excluded in a sensitivity analysis for each model.
Results
Search results
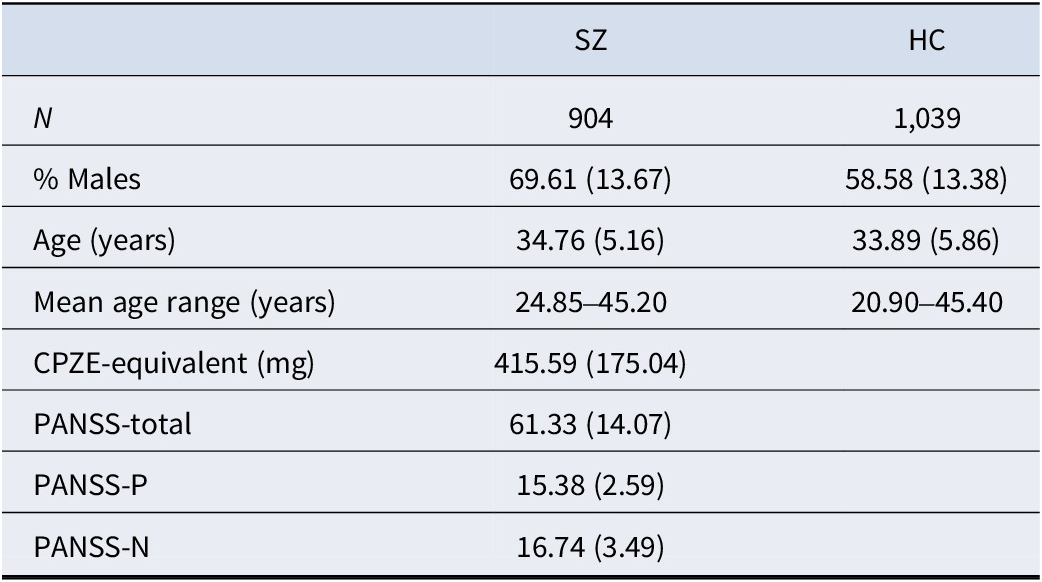
Figure 1 presents the process of study selection. The search produced a total of 3,852 articles, of which 954 were duplicates. Title and abstract screening were therefore conducted on 2,898 articles, and 197 were identified as potentially relevant. Fifteen of these articles were not retrievable (e.g. poster presentations); thus, 182 papers underwent full-text screening. Twenty-eight of these studies were combined with five studies identified through hand-searching, producing 33 studies to review. The dataset was comprised of 41 results as some studies featured multiple experiments. An overview of the included studies and demographics is presented in Tables 1 and 2, respectively.
Preferred reporting items for systematic reviews (PRISMA; Page et al., Reference Page, McKenzie, Bossuyt, Boutron, Hoffmann, Mulrow, Shamseer, Tetzlaff, Akl, Brennan, Chou, Glanville, Grimshaw, Hróbjartsson, Lalu, Li, Loder, Mayo-Wilson, McDonald and Moher2021) screening procedure.

Figure 1. Long description
The flowchart is organized into three vertical phases indicated by blue side tabs.
1. Identification Phase:
- Top central box: Records (n = 3,852) identified from searches on 7th August 2024. Sources include M E D L I N E, Ovid (n = 1,080); E M B A S E, Ovid (n = 1,114); A P A PsycArticles, E B S C O host (n = 53); and A P A PsycInfo, E B S C O host (n = 1,605).
- Right branch: Records removed before screening include automated de-duplication (n = 954), records marked as ineligible by automation tools (n = 0), and records removed for other reasons (n = 0).
2. Screening Phase:
- Central box 1: Records screened (n = 2,898).
- Right branch 1: Records excluded (n = 2,701).
- Central box 2: Reports sought for retrieval (n = 197).
- Right branch 2: Reports not retrieved (n = 15).
- Central box 3: Reports assessed for eligibility (n = 182).
- Right branch 3: Reports excluded (n = 154) for reasons including Duplicate (n = 2), Imaging/eye tracking data only (n = 44), Review article (n = 5), Re-analysis of data (n = 2), Incorrect population (n = 16), Incorrect non-perceptual outcome (n = 33), No clear prior manipulation (n = 48), Priming study (n = 2), Non-English language (n = 1), and Pharmacological intervention (n = 1).
3. Included Phase:
- Bottom central box: Studies included in review (n = 28) plus studies included from hand searching (n = 5), resulting in a total of 33 studies.
Demographics and symptom scores for patients and controls across all studies included in the meta-analysis

Table 2. Long description
The table consists of three columns. The first column lists the demographic or clinical variable, the second column contains data for S Z (schizophrenia-spectrum psychosis patients), and the third column contains data for H C (healthy controls). Values are presented as mean with standard deviation in parentheses where applicable.
* N (number of participants): SZ = 904, HC = 1,039.
* Percentage of Males: SZ = 69.61 (13.67), HC = 58.58 (13.38).
* Age in years: SZ = 34.76 (5.16), HC = 33.89 (5.86).
* Mean age range in years: SZ = 24.85 to 45.20, HC = 20.90 to 45.40.
* CPZE-equivalent in milligrams: SZ = 415.59 (175.04), HC is blank.
* PANSS-total: SZ = 61.33 (14.07), HC is blank.
* PANSS-P: SZ = 15.38 (2.59), HC is blank.
* PANSS-N: SZ = 16.74 (3.49), HC is blank.
Note: SZ, schizophrenia-spectrum psychosis patients; HC, healthy controls; N, number of participants; CPZE, chlorpromazine; PANSS, Positive and Negative Syndrome Scale. Statistics are mean (standard deviation).
Relationship between illness status and prior strength
Of the 41 results in the dataset, 34 results from 27 articles featured the information necessary to compute Hedges’ g (904 patients, 1,039 controls). Overall, there was no significant difference in the strength of priors in patients versus controls (g = .03, 95% CI [−0.27, 0.34]; p = .818). There was significant heterogeneity (Q (33) = 223.92, p < .001), the majority due to between-study heterogeneity (I 2 = 70.37%). Non-significant between-group differences reported by individual studies were not due to the lack of a robust prior manipulation effect. The PI indicated that future studies could suggest either increased, decreased, or no difference in the reliance on priors in patients versus controls (95% PI [−1.51, 1.58]). A forest plot of the results is displayed in Figure 2.
Forest plot of effect sizes representing reliance on priors in patients versus healthy controls.
Note: Positive effect sizes represent stronger priors in patients compared to healthy controls. The vertical dotted line represents no difference in reliance on priors between groups. The true effect size (black rectangles) and 95% CI (confidence interval) are plotted for each included result. The size of the black rectangles is proportional to the weighting used to calculate the pooled effect size (red diamond). The red dotted error bar represents the 95% PI. The width of the red diamond represents the 95% CI.

Figure 2. Long description
A forest plot with three main columns: Study, a graphical representation of effect sizes, and Hedges’ g with 95 percent C I. The x-axis at the bottom ranges from minus 4 to 2 Hedges’ g, with a vertical dotted line at 0 indicating no difference.
Individual studies are listed vertically with alternating white and gray background shading. Notable results include:
* Abo Hamza et al. 2021 at the top with a large positive effect size of 1.16.
* Fogelson et al. 2011 showing a significant negative effect at minus 2.37.
* Weintraub et al. 2012 at the bottom of the list with a negative effect of minus 1.42.
Each study row contains a black rectangle representing the effect size and a horizontal error bar for the 95 percent C I. Rectangles to the right of the zero line indicate stronger priors in patients, while those to the left indicate stronger priors in healthy controls.
At the bottom, a separate section for the Random Effects Model Pooled Estimate shows a red diamond centered at 0.03 with a 95 percent C I of minus 0.27 to 0.34. The diamond overlaps the zero line, indicating no statistically significant difference overall. A red dotted error bar extending from the diamond represents the 95 percent P I.
Sensitivity analyses were conducted to reduce the effect of bias on the results. Fogelson et al. (Reference Fogelson, Ribolsi, Fernandez-Del-Olmo, Rubino, Romeo, Koch and Peled2011) was identified as an influential outlier, but the removal of this article did not significantly alter the pooled effect size. Another sensitivity analysis excluded Powers et al. (Reference Powers, Mathys and Corlett2017) given that additional comparisons by the authors demonstrated that stronger priors were associated with (clinical and non-clinical) hallucinations rather than psychosis. This finding was not accounted for in the meta-analysis, which focused on comparing patients and controls. Exclusion of this study did not significantly alter the results. Finally, excluding Colbert et al. (Reference Colbert, Peters and Garety2010) due to a high risk of bias did not significantly change the results.
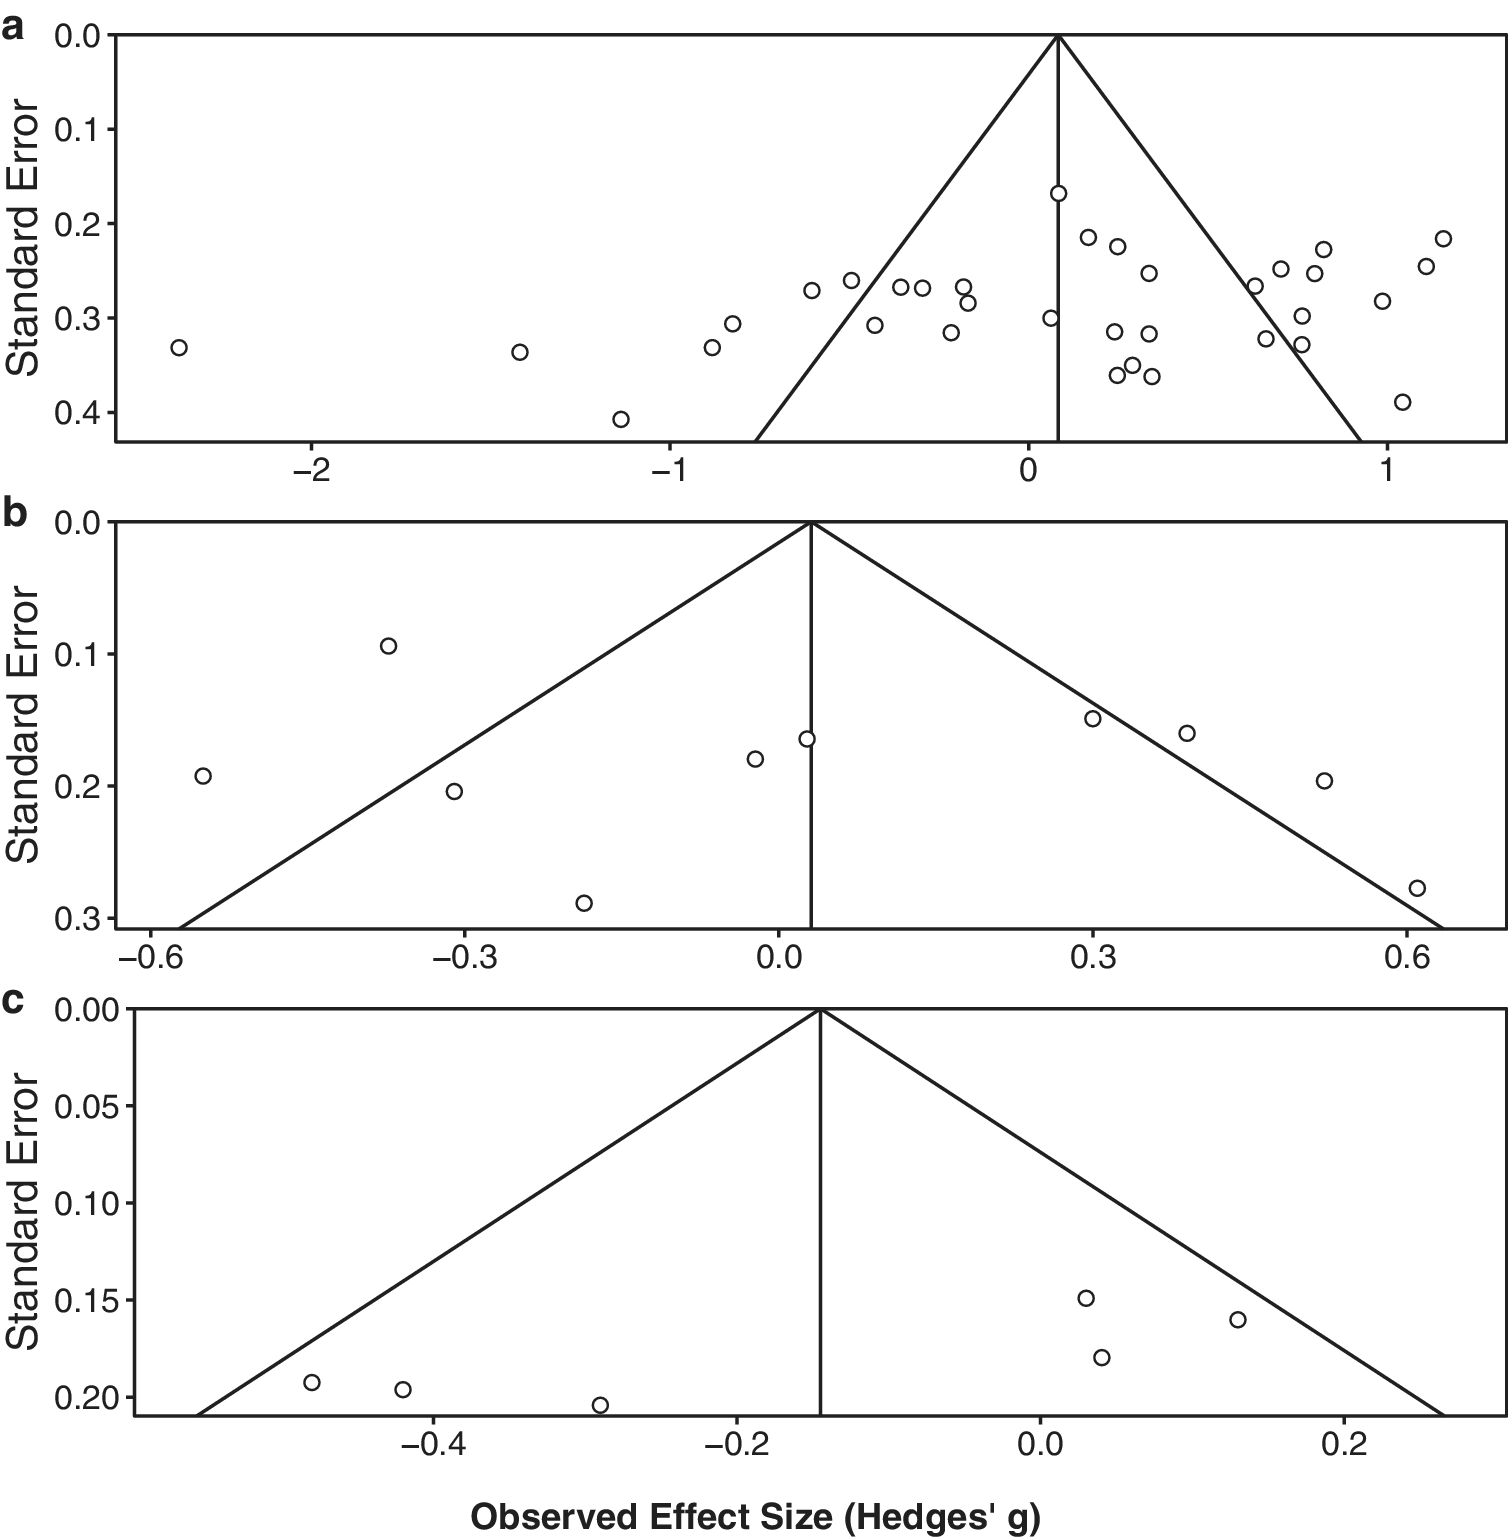
A funnel plot (Figure 3a) did not reveal evidence of significant publication bias and was corroborated by a non-significant Egger’s test intercept (p = .082; indicating no significant small study bias). The distribution of studies was mostly symmetric, with the exception of one outlier (Fogelson et al., Reference Fogelson, Ribolsi, Fernandez-Del-Olmo, Rubino, Romeo, Koch and Peled2011) that had already been addressed in sensitivity analyses. A wide distribution of effect sizes can be observed in the funnel plot, which likely reflects the heterogeneity of the studies included in the meta-analysis.
Funnel plots of study precision (standard error) and observed effect size.
Note: Plots represent analysis of (a) reliance on priors in psychosis patients versus controls, (b) correlation between reliance on priors and hallucinations in patients, and (c) correlation between reliance on priors and delusions in patients.

Figure 3. Long description
Three vertically stacked funnel plots labeled a, b, and c. All plots share a common x-axis at the bottom labeled Observed Effect Size Hedges’ g and individual y-axes labeled Standard Error. Each plot features a central vertical line and two diagonal lines forming an inverted funnel shape.
* Panel a: The y-axis ranges from 0.0 to 0.4. The x-axis ranges from -2 to 1. Data points are scattered widely, with a significant cluster outside the left boundary of the funnel and several points concentrated on the right side between effect sizes 0.5 and 1.0.
* Panel b: The y-axis ranges from 0.0 to 0.3. The x-axis ranges from -0.6 to 0.6. Data points are sparse, with approximately five points inside the funnel and five points outside, showing a slight spread toward the negative effect size region.
* Panel c: The y-axis ranges from 0.00 to 0.20. The x-axis ranges from -0.4 to 0.2. There are very few data points, with three points clustered inside the right side of the funnel and three points scattered on the left side outside the funnel boundary.
The planned subgroup analysis provided an exploration of between-study heterogeneity. This included 21 perceptual and 13 cognitive prior effect results. There was no significant difference in the pooled effect sizes for the two prior types (F (1,32) = 0.1, p = .758), indicating that the two-prior model did not sufficiently explain differences in task results. Furthermore, neither reliance on perceptual priors (g = −.01, 95% CI [−0.41, 0.4]; p = .979) nor cognitive priors (g = .08, 95% CI [−0.48, 0.65]; p = .758) significantly differed between patients and controls.
Relationship between symptoms and prior strength
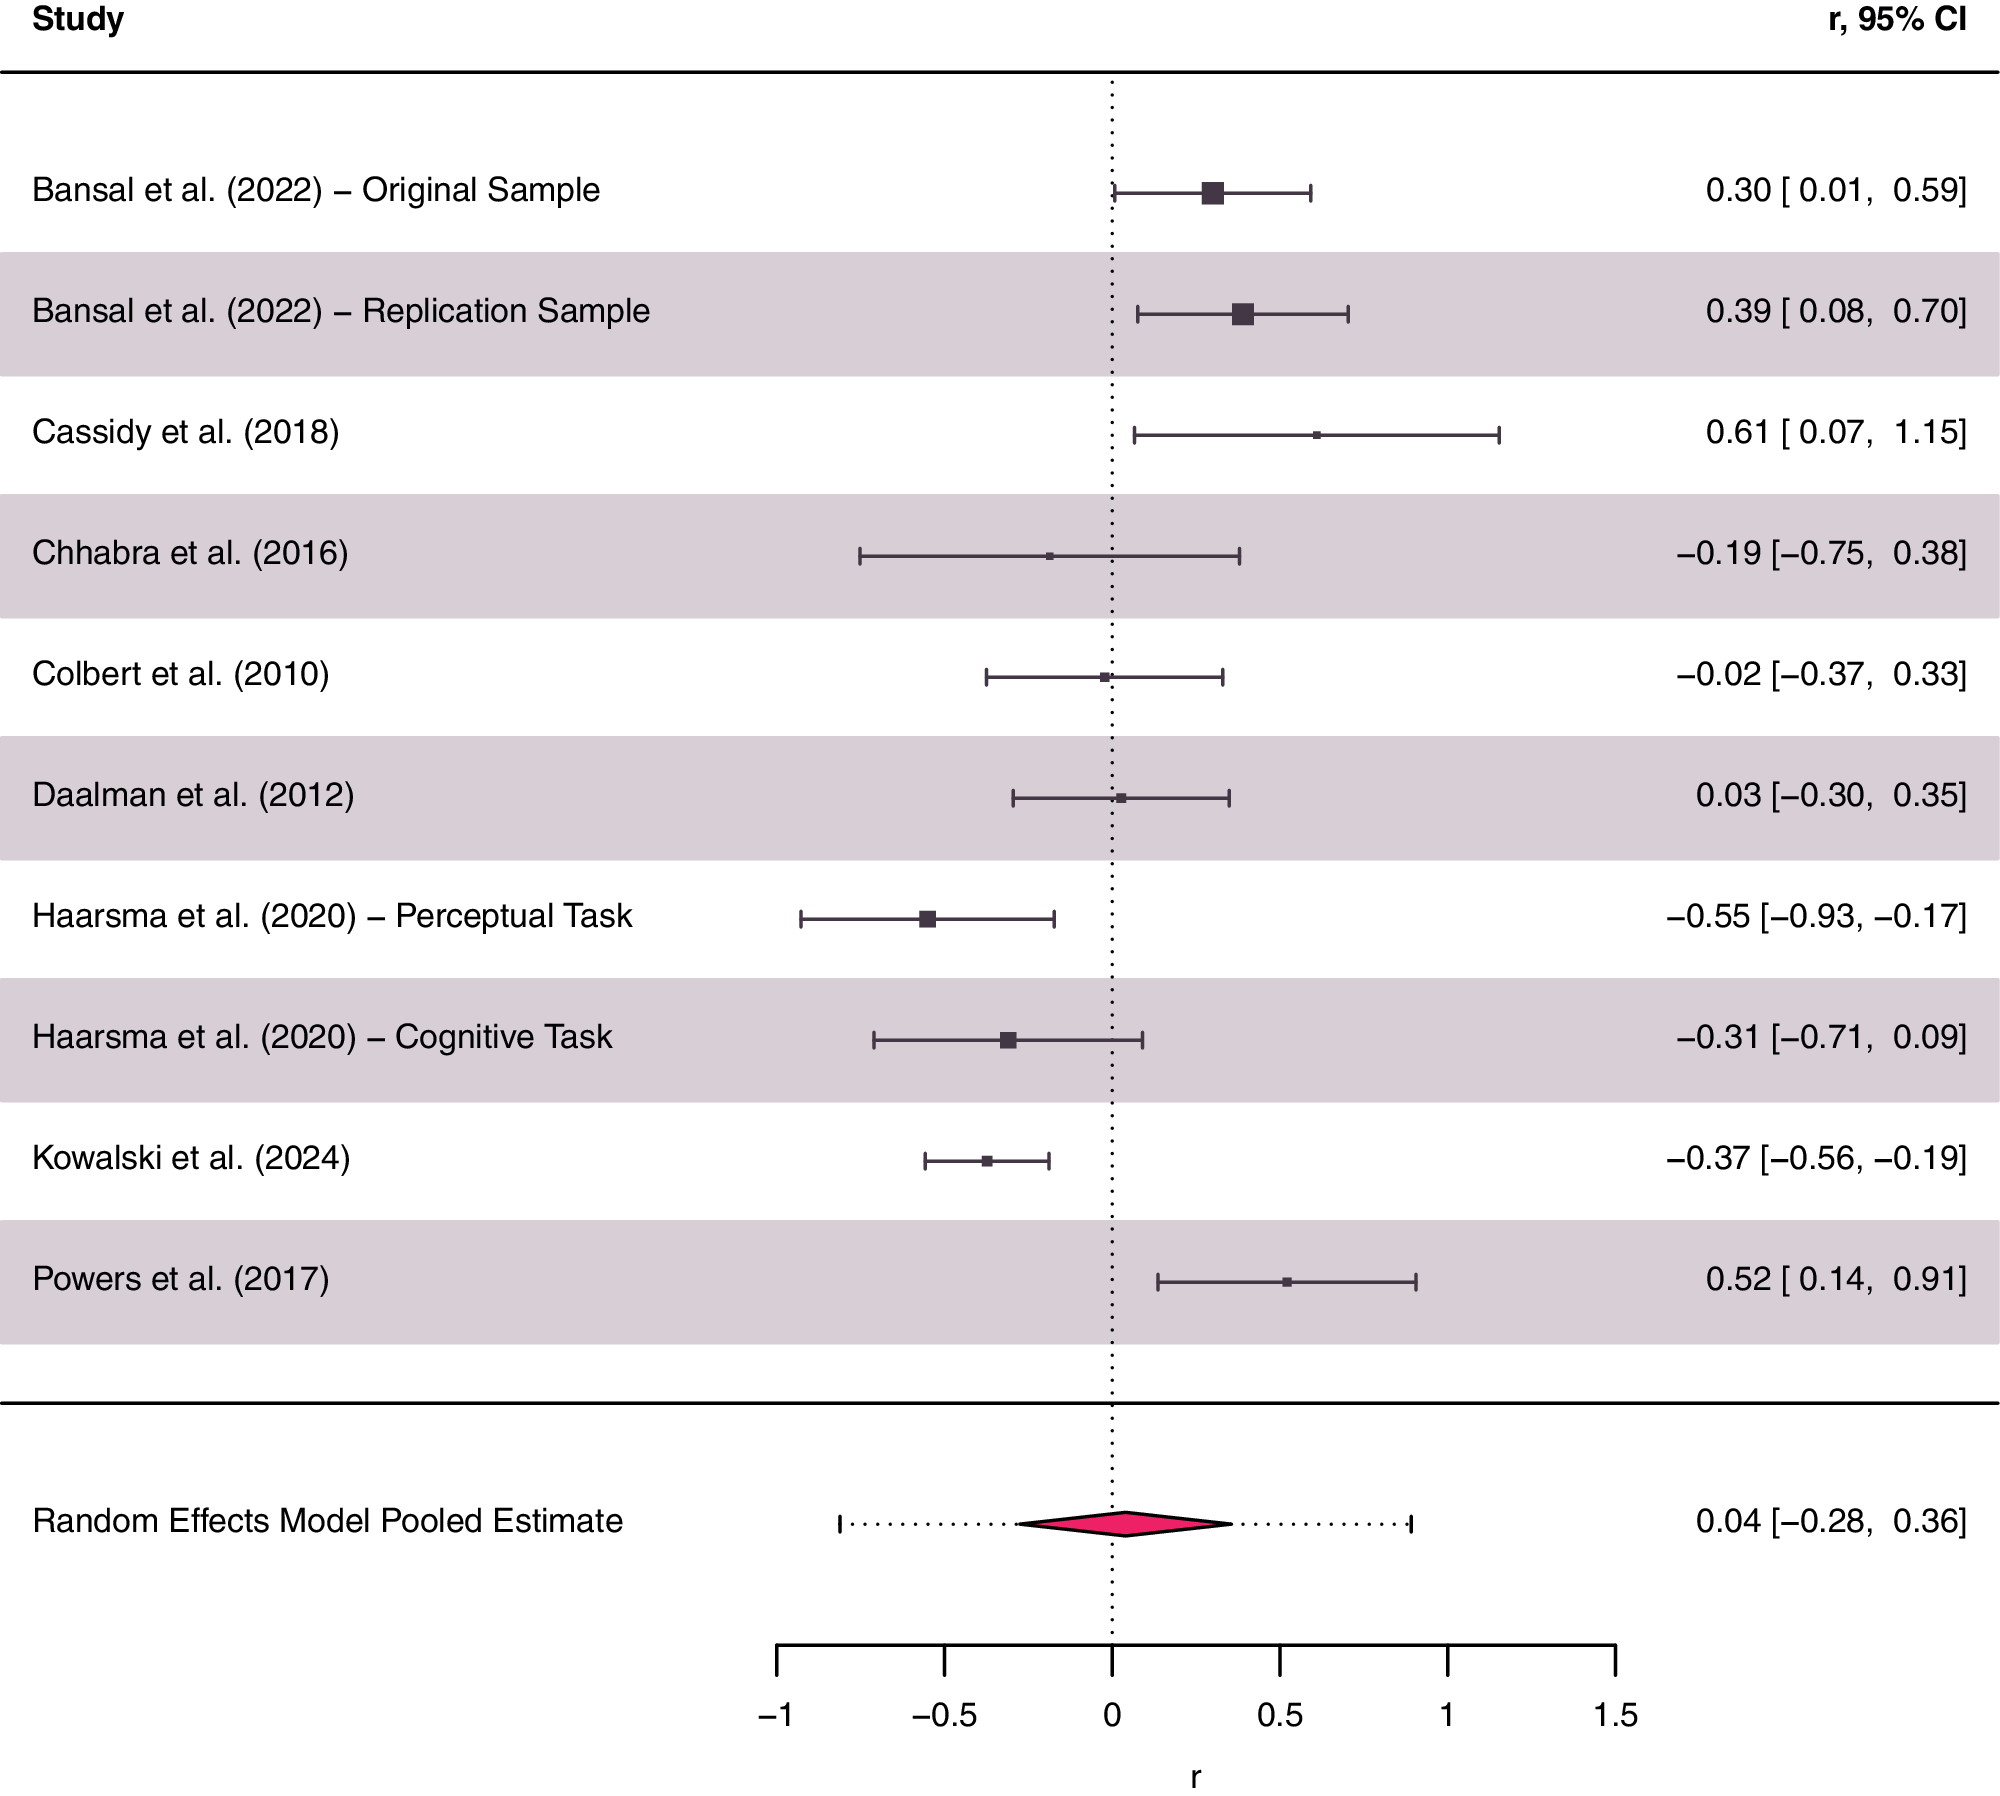
The meta-analysis focusing on the relationship between hallucinations and reliance on priors in patients incorporated 10 results from eight studies (370 patients; Figure 4). There was no significant relationship between hallucinations and prior strength (r = .04, 95% CI [−0.28, 0.36]; p = .780). There was significant heterogeneity (Q (9) = 47.81, p < .001). This was mostly between-study heterogeneity (I 2 = 80.8%). The PI indicated that effect sizes for future studies could demonstrate a positive, negative, or no association between hallucinations and prior strength (95% PI [−0.81, 0.89]). A sensitivity analysis again excluded Colbert et al. (Reference Colbert, Peters and Garety2010) due to a high risk of bias, but this did not significantly impact the results. A funnel plot (Figure 3b) revealed no evidence of publication bias, again supported by a non-significant Egger’s test intercept (p = .634). The spread of results indicated between-study heterogeneity.
Forest plot of effect sizes representing correlations between reliance on priors and hallucinations in patients.
Note: Positive effect sizes represent an association between stronger priors and hallucinations. The vertical dotted line represents no significant Pearson correlation (r) between reliance on priors and hallucinations. The true effect size (black rectangles) and 95% CI (confidence interval) are plotted for each included result. The size of the black rectangles is proportional to the weighting used to calculate the pooled effect size (red diamond). The red dotted error bar represents the 95% PI. The width of the red diamond represents 95% CI.

Figure 4. Long description
The forest plot is organized into three columns: Study name on the left, a graphical representation of effect sizes in the center, and numerical r values with 95 percent C I on the right. The x-axis at the bottom represents the Pearson correlation r, ranging from minus 1 to 1.5, with a vertical dotted line at 0 indicating no correlation.
Individual study results from top to bottom:
* Bansal et al. 2022 Original Sample: 0.30 [0.01, 0.59]
* Bansal et al. 2022 Replication Sample: 0.39 [0.08, 0.70]
* Cassidy et al. 2018: 0.61 [0.07, 1.15]
* Chhabra et al. 2016: minus 0.19 [minus 0.75, 0.38]
* Colbert et al. 2010: minus 0.02 [minus 0.37, 0.33]
* Daalman et al. 2012: 0.03 [minus 0.30, 0.35]
* Haarsma et al. 2020 Perceptual Task: minus 0.55 [minus 0.93, minus 0.17]
* Haarsma et al. 2020 Cognitive Task: minus 0.31 [minus 0.71, 0.09]
* Kowalski et al. 2025: minus 0.37 [minus 0.56, minus 0.19]
* Powers et al. 2017: 0.52 [0.14, 0.91]
At the bottom, separated by a horizontal line, is the Random Effects Model Pooled Estimate. It is represented by a red diamond centered near the zero line with a value of 0.04 [minus 0.28, 0.36]. A red dotted error bar extends horizontally from the diamond, representing the 95 percent P I.
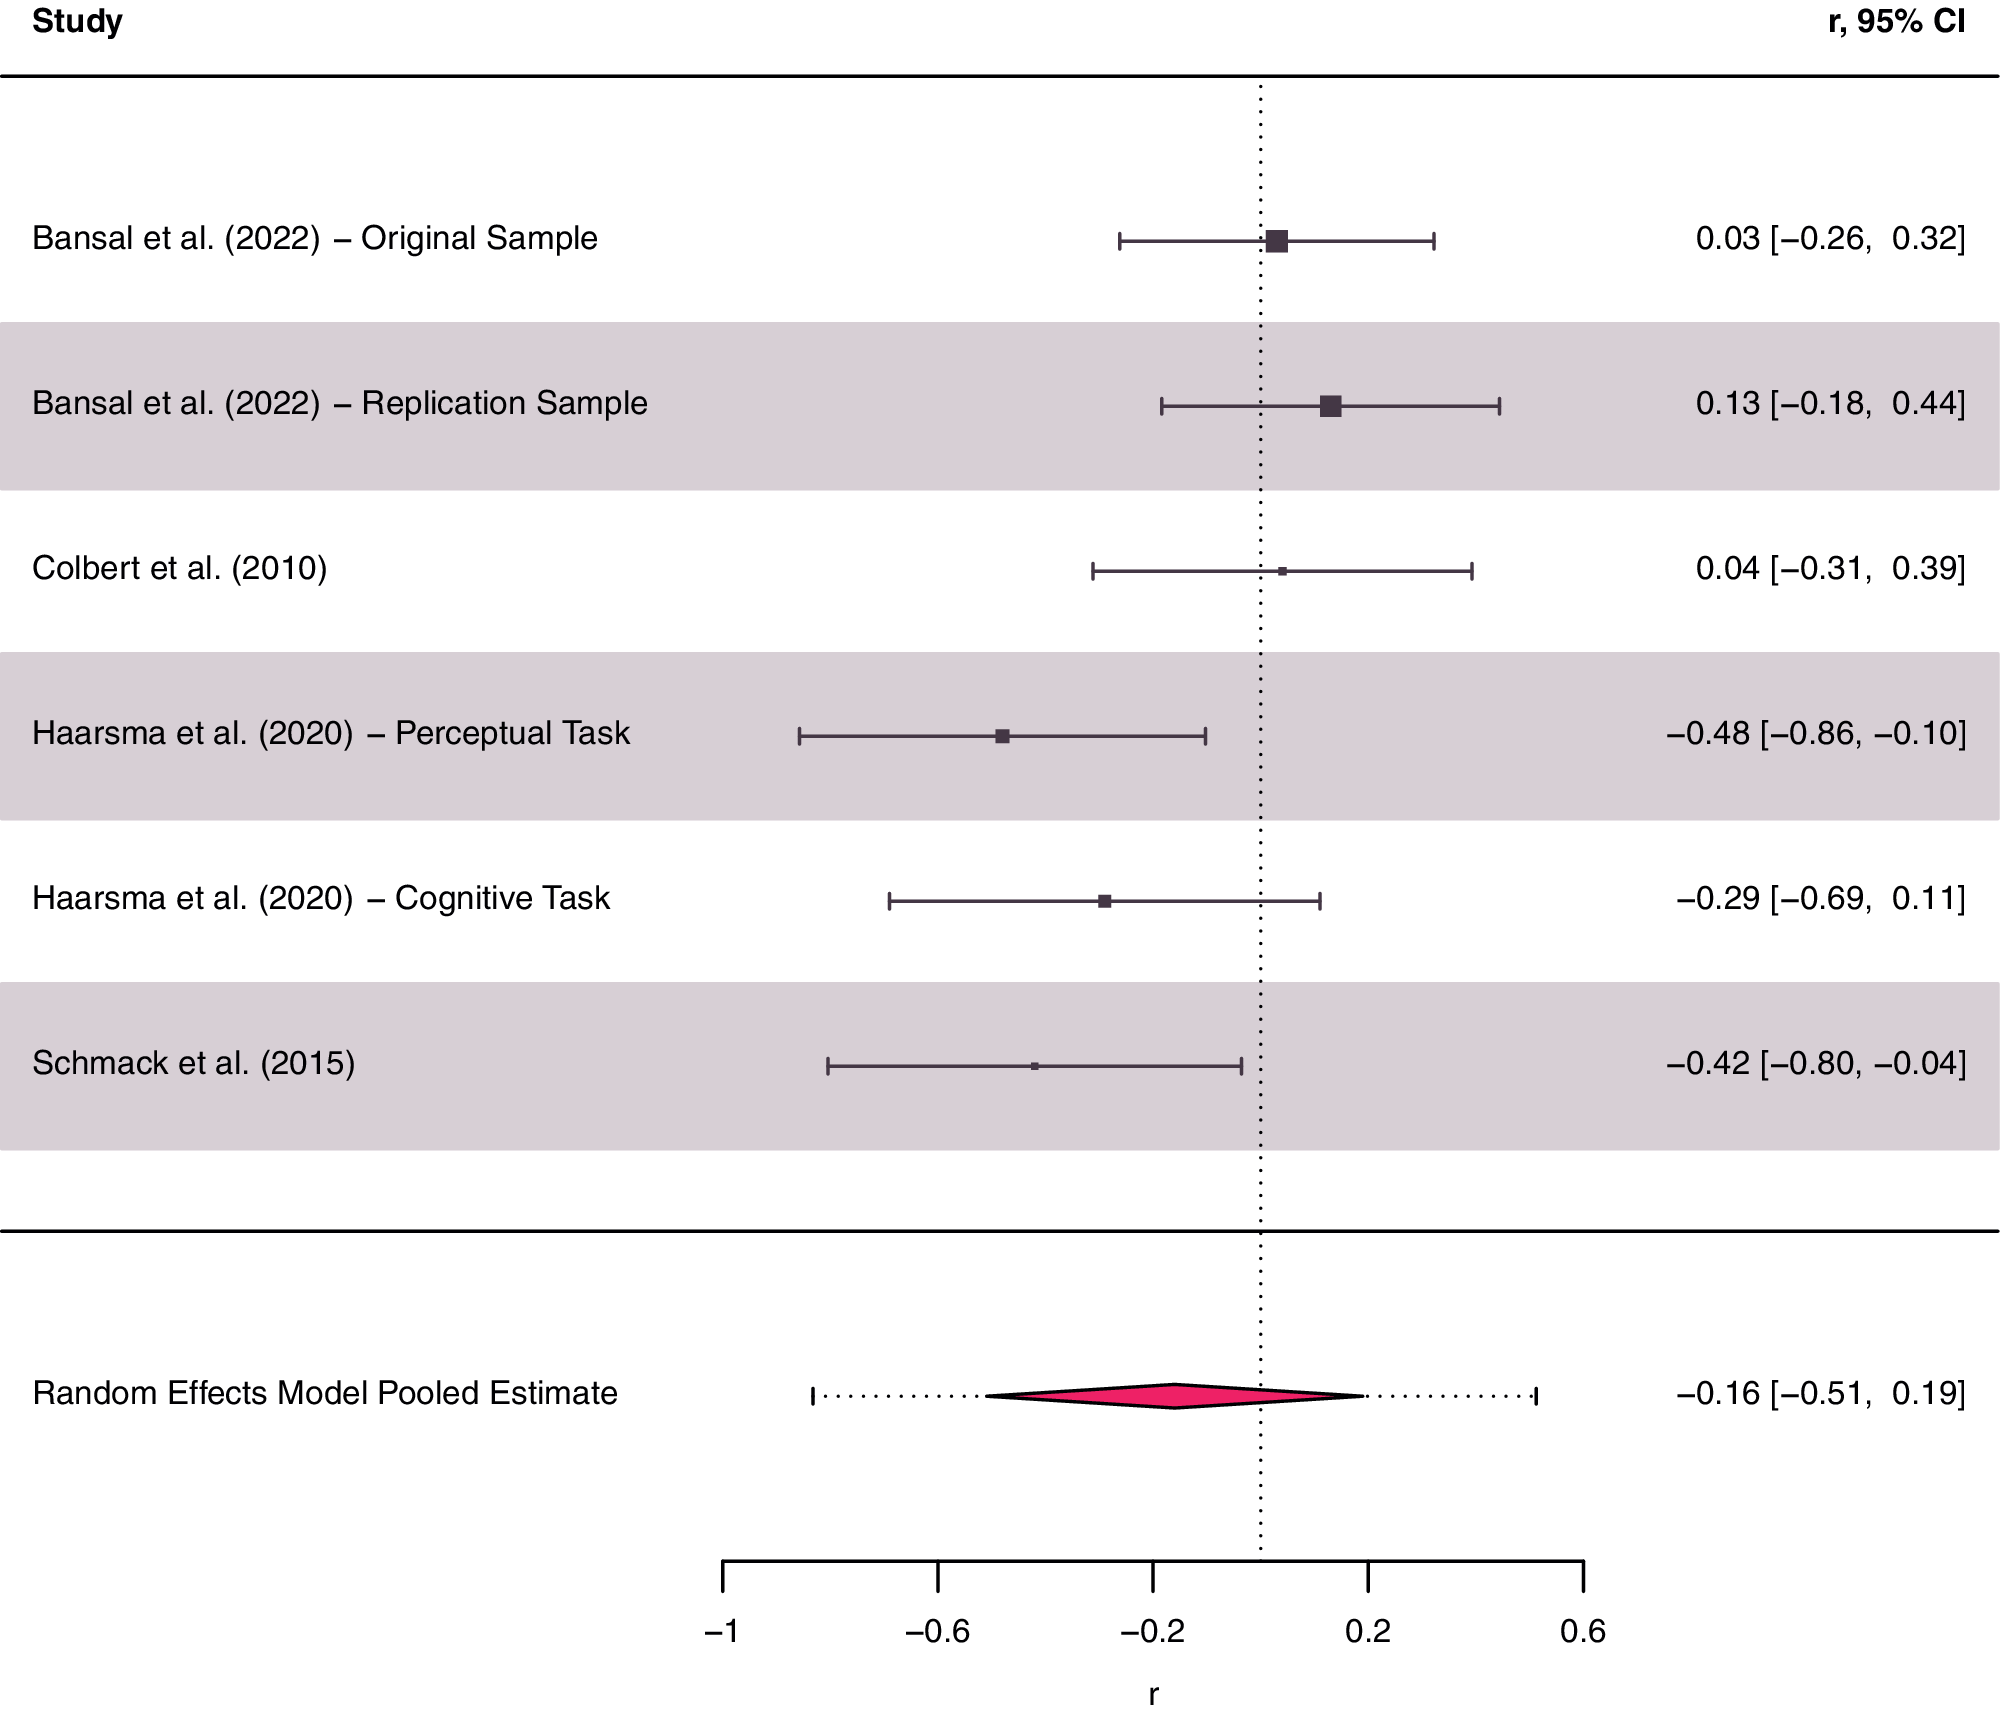
The meta-analysis investigating the association between delusions and reliance on priors in patients incorporated six results from four studies (183 patients; Figure 5). There was no significant relationship between delusions and prior strength (r = −.16, 95% CI [−0.51, 0.19]; p = .293). There was significant heterogeneity (Q (5) = 10.78, p = .056), mostly due to between-study heterogeneity (I 2 = 61.2%). The PI again indicated that effect sizes for future studies could demonstrate a positive, negative, or no association between delusions and prior strength (95% PI [−0.83, 0.51]). A sensitivity analysis again excluded Colbert et al. (Reference Colbert, Peters and Garety2010) due to a high risk of bias, which did not significantly impact the results. A funnel plot (Figure 3c) did not clearly evidence publication bias, but interpretation was limited due to the small number of studies. Egger’s test intercept did not indicate small study bias (p = .07).
Forest plot of effect sizes representing correlations between reliance on priors and delusions in patients.
Note: Positive effect sizes represent an association between stronger priors and delusions. The vertical dotted line represents no significant Pearson correlation (r) between reliance on priors and delusions. The true effect size (black rectangles) and 95% CI (confidence interval) are plotted for each included result. The size of the black rectangles is proportional to the weighting used to calculate the pooled effect size (red diamond). The red dotted error bar represents the 95% PI. The width of the red diamond represents the 95% CI.

Figure 5. Long description
The forest plot is organized with Study names on the left, a central graphical representation of effect sizes, and numerical values for r and 95 percent C I on the right. The x-axis at the bottom represents the Pearson correlation r, ranging from minus 1 to 0.6. A vertical dotted line indicates the null effect at r equals 0.
Individual study results from top to bottom:
* Bansal et al. 2022 Original Sample: r equals 0.03, C I minus 0.26 to 0.32.
* Bansal et al. 2022 Replication Sample: r equals 0.13, C I minus 0.18 to 0.44.
* Colbert et al. 2010: r equals 0.04, C I minus 0.31 to 0.39.
* Haarsma et al. 2020 Perceptual Task: r equals minus 0.48, C I minus 0.86 to minus 0.10.
* Haarsma et al. 2020 Cognitive Task: r equals minus 0.29, C I minus 0.69 to 0.11.
* Schmack et al. 2015: r equals minus 0.42, C I minus 0.80 to minus 0.04.
At the bottom, separated by a horizontal line, is the Random Effects Model Pooled Estimate. It is represented by a red diamond centered at r equals minus 0.16, with a 95 percent C I of minus 0.51 to 0.19. A red dotted error bar extends further to show the 95 percent P I.
Sub-group analyses also investigated the effect of prior type on the association between prior strength and symptoms. This is pertinent to the theory that an altered reliance on perceptual and cognitive priors may manifest as hallucinations and delusions, respectively. There was no significant moderating effect of prior type on the association between prior strength and delusions (p = .511; four perceptual, two cognitive tasks) or hallucinations (p = .188; five perceptual, five cognitive tasks) in patients. There was no significant correlation between hallucinations and reliance on perceptual priors (g = .2, 95% CI [−0.18, 0.58]; p = .262), or delusions and reliance on cognitive priors (g = −.06, 95% CI [−0.63, 0.511]; p = .790).
One limitation of the symptoms analyses was that the studies employed different symptoms scales. All studies except Colbert et al. (Reference Colbert, Peters and Garety2010) used PDI scores for analyses of delusions. A previous sensitivity analysis already confirmed that excluding this study did not significantly affect the results. Measures of hallucinations were more variable and included comparisons of symptomatic and asymptomatic patients and scores on the PANSS-P3 (hallucinations subscale), CAPS, PSYRATS (Haddock, McCarron, Tarrier, & Faragher, Reference Haddock, McCarron, Tarrier and Faragher1999; Psychotic Symptom Rating Scales) auditory hallucinations subscale, and BPRS (Overall & Gorham, Reference Overall and Gorham1962; Brief Psychiatric Rating Scale). An exploratory meta-regression was therefore conducted to assess whether the difference in prior strength between patients and controls is significantly affected by patients’ mean PANSS-P (positive symptoms scale) scores. This analysis included 22 results from 17 studies (527 patients). There was no significant effect of PANSS-P scores on the difference in prior strength in patients versus controls (F (1,20) = 0.04, p = .84). This used a single scale to corroborate the results of the planned symptoms analyses, revealing no effect of positive symptoms on prior strength.
Discussion
This study used a meta-analysis to systematically aggregate data from tasks investigating an altered reliance on priors in psychosis. Clarifying the role of predictive processing in psychosis is theoretically important and clinically relevant: it could inform the development of targeted cognitive interventions or digital phenotyping tools that monitor perceptual inference anomalies as early markers of relapse or treatment response. The high interest in this field is demonstrated by the large number of studies (N = 33) identified by our review, produced by multiple research groups across many countries. This literature features diverse tasks, reflected by the significant between-study heterogeneity. While a single pooled effect size is likely an inadequate summary metric for such heterogenous research, studies often extrapolate results across diverse tasks to advance a general theory of either stronger or weaker priors in psychosis. In contrast, the results of this study revealed no evidence for an altered reliance on priors in patients versus controls that can be consistently evidenced across paradigms. Importantly, this does not refute the possibility that aspects of aberrant predictive processing could contribute to mechanisms of psychosis. While the pooled effect size represented no psychosis-related alteration in reliance on priors, a number of individual studies reported significant between-group differences. For example, a subset of voice detection paradigms (Chhabra et al., Reference Chhabra, Sowmya, Sreeraj, Kalmady, Shivakumar, Amaresha, Narayanaswamy and Venkatasubramanian2016; Colbert et al., Reference Colbert, Peters and Garety2010; Galdos et al., Reference Galdos, Simons, Fernandez-Rivas, Wichers, Peralta, Lataster, Amer, Myin-Germeys, Allardyce, Gonzalez-Torres and Van Os2011) indicated an increased reliance on priors in psychosis. However, even within this domain, associations with symptoms varied, and therefore there was no clear relation to the clinical presentation of psychosis. Overall, the results indicate that psychosis is not associated with a generalized predictive processing alteration spanning multiple aspects of perception. Instead, predictive processing deficits in illness may be more nuanced. Our results recommend that authors exert caution when generalizing conclusions across tasks and promote discussion of factors that may underlie conflicting results, with a view to creating a more refined cognitive model of illness.
As a comprehensive theory should explain common symptoms, further analyses examined whether altered prior strength accounts for hallucinations and delusions. The meta-analyses revealed no differences in prior strength related to either symptom, although these were based on a smaller subset of studies. A limitation of these analyses was that they combined correlations between reliance on priors and different symptom scales. Nevertheless, an exploratory meta-regression using PANSS scores also reported no effect of positive symptoms. A sub-group analysis also did not reveal evidence that distinct mechanistic pathways, namely reliance on perceptual and cognitive priors, underpin hallucinations and delusions, although this was again based on a small subset of tasks. This meta-analysis featured participants with both active and remitted symptoms, and there were insufficient studies to perform a sub-group analysis of the role of priors in each illness phase. Future work could address whether predictive processing deficits function as a state or trait marker of illness. These results could be useful for informing a predictive model of illness progression and for linking psychotic episode–related cognitive changes with underlying neurobiology and environmental risk factors (e.g. recent trauma). Future work should also explore previously cited interactions between symptoms and illness stage (Haarsma et al., Reference Haarsma, Knolle, Griffin, Taverne, Mada, Goodyer, Fletcher and Murray2020) with a view to predicting transition to psychosis from the ARMS. Isolating possible medication effects on predictive processing could also inform pharmaco-cognitive models and drug selection, explain differences in task performance between patients, and help discern the effects of chronic illness and long-term medication exposure.
Possible reasons for heterogenous findings were explored in this review. Some theoretical arguments and individual studies (Haarsma et al., Reference Haarsma, Knolle, Griffin, Taverne, Mada, Goodyer, Fletcher and Murray2020; Schmack et al., Reference Schmack, Schnack, Priller and Sterzer2015, Reference Schmack, Rothkirch, Priller and Sterzer2017) posit that conflicting results may be reconciled by considering a hierarchy of priors, broadly mirroring the predictive processing hierarchy (Hohwy, Reference Hohwy2013). This has rarely been tested empirically and has not been investigated across paradigms with large samples. Our meta-regression indicated that between-study heterogeneity could not be resolved by differences in the use of perceptual and cognitive priors. This perceptual-cognitive distinction is frequently invoked in predictive processing literature (e.g. Haarsma et al., Reference Haarsma, Knolle, Griffin, Taverne, Mada, Goodyer, Fletcher and Murray2020); therefore, our cross-study evaluation of this framework is theoretically relevant. However, this field lacks a clear delineation between these two prior types, with researchers often failing to reach a consensus on whether a given prior should be classified as perceptual or cognitive (Goodwin et al., Reference Goodwin, Diederen, Weilnhammer, Hird, Garrido and Knolle2026). This perhaps also reflects how a binary classification is likely a rudimentary model for describing a multi-level, graded hierarchy. Some of the included results also suggest that alternative, or additional, categories of priors could exist that may be differentially altered in psychosis. For example, Rohe et al. (Reference Rohe, Hesse, Ehlis and Noppeney2023) used different classifications to evidence that between-group differences depend on prior type. Patients demonstrated an over-reliance on ‘numeric priors’ (beliefs about the number of stimuli) but were comparable to controls in terms of reliance on ‘causal priors’ (beliefs about the relationship between stimuli). This highlights how tasks may target distinct computational objects (e.g. sensory expectations, causal beliefs). Furthermore, two studies Okruszek et al. (Reference Okruszek, Piejka, Wysokiński, Szczepocka and Manera2018, Reference Okruszek, Piejka, Wysokiński, Szczepocka and Manera2019) reported that patients display intact use of predictive cues (communicative gestures) for identifying biological motion relating to a second agent, despite lacking explicit recognition of these cues. Hence, impairments in predictive processing may depend upon the type of knowledge representation (i.e. explicit/implicit) required for the task. This finding highlights the possibility of alternative conceptualizations of the predictive processing hierarchy beyond the perceptual-cognitive framework. An implicit-explicit stratification could parallel the predictive processing hierarchy invoked in metacognition research, where the explicit evaluation of performance occurs as a second-order computation to performance (Fleming & Daw, Reference Fleming and Daw2017). Future work could explore a broader variety of prior types, including implicit priors developed across the lifespan, and psychosis-related alterations in Bayesian inference in cognitive and metacognitive tasks.
A challenge for predictive processing research is that different modelling frameworks can map parameters to priors in non-equivalent ways (Katthagen, Fromm, Wieland, & Schlagenhauf, Reference Katthagen, Fromm, Wieland and Schlagenhauf2022), potentially causing further discrepancies between study results.
This review included outcomes based on various computational and behavioral metrics, which contributed to the heterogeneity of results. For example, Fogelson et al. (Reference Fogelson, Ribolsi, Fernandez-Del-Olmo, Rubino, Romeo, Koch and Peled2011) reported prior-related between-group differences in reaction time, yet there was no effect of the prior on accuracy in either group. Analyses of multiple outcomes, or tracking how reliance on priors changes over time, could produce a more detailed evaluation than a single aggregate metric (Rohe et al., Reference Rohe, Hesse, Ehlis and Noppeney2023; Weintraub et al., Reference Weintraub, Ramage, Sutton, Ringdahl, Boren, Pasinski, Thaler, Haderlie, Allen and Snyder2012). For example, the dynamic updating of priors could be particularly important for paradigms involving the tracking of statistical regularities or serial dependence (Weintraub et al., Reference Weintraub, Ramage, Sutton, Ringdahl, Boren, Pasinski, Thaler, Haderlie, Allen and Snyder2012).
Our findings align with the outcome of a systematic review on schizophrenia patients’ susceptibility to visual illusions (Costa et al., Reference Costa, Costa, Pessoa, Caixeta and Maior2023). Although this previous study did not explicitly investigate the role of priors in illusory experiences, such phenomena are often deemed a product of top-down processing based on knowledge of natural scene statistics (de Lange, Heilbron, & Kok, Reference de Lange, Heilbron and Kok2018). Costa et al. (Reference Costa, Costa, Pessoa, Caixeta and Maior2023) did not indicate a general impairment for perceiving visual illusions in patients, and inconsistent findings were identified within each category of illusions. In place of a generalized deficit for perceiving illusions, the authors suggested that specific aspects of illusory tasks may be key to understanding anomalous processing in patients. Likewise, the present study observed conflicting results between tasks targeting the same cognitive domain (e.g. Chhabra et al., Reference Chhabra, Sowmya, Sreeraj, Kalmady, Shivakumar, Amaresha, Narayanaswamy and Venkatasubramanian2016; Daalman et al., Reference Daalman, Verkooijen, Derks, Aleman and Sommer2012) and even replications of the same paradigm (Gawęda & Moritz, Reference Gawęda and Moritz2021; Kowalski et al., Reference Kowalski, Dąbkowska, Aleksandrowicz, Jarkiewicz, Larøi and Gawęda2025). Further research is required to isolate task features that may potentially influence results and instigate differential processing in psychosis. One recurring theme identified by our review is the potential significance of uncertainty. Between-group differences may vary with sensory uncertainty and/or the precision of the prior. Cassidy et al. (Reference Cassidy, Balsam, Weinstein, Rosengard, Slifstein, Daw, Abi-Dargham and Horga2018) reported evidence that hallucination severity is associated with reduced uncertainty adjustment: the influence of context tones (the prior) on perception was not down-weighted as the variance of the tone sequence increased (i.e. as prior precision decreased). Sensory precision may also determine between-group differences. For example, Martin et al. (Reference Martin, Dezecache, Pressnitzer, Nuss, Dokic, Bruno, Pacherie and Franck2014) identified a greater hysteresis effect (i.e. stronger priors) in patients but, for emotional stimuli, this was only observed with a decreased signal-to-noise ratio (i.e. lower sensory precision). Meanwhile, both Bansal et al. (Reference Bansal, Bae, Robinson, Hahn, Waltz, Erickson, Leptourgos, Corlett, Luck and Gold2022) and Schmack et al. (Reference Schmack, Schnack, Priller and Sterzer2015) used random dot kinematograms to measure how motion perception is a function of previously encountered stimuli, yet these studies reported that psychosis is related to stronger and weaker priors, respectively. This discrepancy could be explained by differences in sensory uncertainty as Schmack et al. (Reference Schmack, Schnack, Priller and Sterzer2015) featured an ambiguous (bistable) stimulus, while Bansal et al. (Reference Bansal, Bae, Robinson, Hahn, Waltz, Erickson, Leptourgos, Corlett, Luck and Gold2022) used a coherent motion signal embedded in noise. Between-group differences may also depend on how closely the task pertains to symptoms. Numerous tasks in this review measured the detection or hallucination of voices in noise following exposure to priors including explicit task instructions (e.g. suggestions of the presence of voices) and experience with clearly-audible voice trials. From these, a number of results indicated that patients over-weight priors compared to controls (Chhabra et al., Reference Chhabra, Sowmya, Sreeraj, Kalmady, Shivakumar, Amaresha, Narayanaswamy and Venkatasubramanian2016; Colbert et al., Reference Colbert, Peters and Garety2010; Galdos et al., Reference Galdos, Simons, Fernandez-Rivas, Wichers, Peralta, Lataster, Amer, Myin-Germeys, Allardyce, Gonzalez-Torres and Van Os2011), indicating a possible target for future paradigms. It would also be important to investigate whether any psychosis-related expectation to perceive voices is causally related to illness or instead emerges following experience of symptoms (i.e. hallucinations).
While study selection for this review was performed against pre-registered inclusion criteria, conceptual difficulties concerning the definition of prior effects presented challenges. It remains possible that results included in the meta-analysis reflect mechanisms other than the use of priors. For example, patients’ altered audiovisual integration can be described by a preference for auditory stimuli (Pearl et al., Reference Pearl, Yodashkin-Porat, Katz, Valevski, Aizenberg, Sigler, Weizman and Kikinzon2009) rather than a dysfunctional weighting of priors. Moreover, there remain unresolved issues concerning how predictive processing operates, in particular the distinction between top-down and bottom-up processing. In this review, this was exemplified by contrasting effects observed in serial dependence tasks, where similar prior manipulations can induce either attractive effects (i.e. a bias toward perceiving the prior; Pascucci et al., Reference Pascucci, Roinishvili, Chkonia, Brand, Whitney, Herzog and Manassi2025) or repulsive effects (i.e. a bias away from perceiving the prior, due to neuronal adaptation; Thakkar et al., Reference Thakkar, Ghermezi, Silverstein, Slate, Yao, Achtyes and Brascamp2021). One Bayesian account posits that repulsive effects reflect changes in the likelihood function (i.e. sensory information; Stocker & Simoncelli, Reference Stocker, Simoncelli, Weiss, Schölkopf and Platt2005), which may be induced by prolonged exposure to high-contrast stimuli (Gekas & Mamassian, Reference Gekas and Mamassian2025). Relatedly, priming effects did not feature in this review given that these may be realized through bottom-up processing alone, although in some cases these may result from top-down or combined top-down and bottom-up processes (Rauss & Pourtois, Reference Rauss and Pourtois2013). Furthermore, Teufel and Fletcher (Reference Teufel and Fletcher2020) discussed that priors may be instantiated through bottom-up and top-down mechanisms: predictions representing spatio-temporally global regularities (i.e. priors at the lowest level) may be coded by bottom-up processing, while top-down processing is reserved for context-dependent (higher-level) predictive signaling. Overall, clearer definitions of different types of priors and their relationship to top-down and bottom-up processing, as well as neurophysiological work linking this conceptual framework with functional activation and connectivity, would facilitate the design and interpretation of predictive processing paradigms and aid investigations into the mechanisms of psychosis.
In conclusion, this meta-analysis offers no evidence for a theory of altered prior strength in psychosis that can be generalized across perceptual tasks or mechanistically explains symptoms. Most studies only examined predictive processing from a narrow perspective (i.e. using a single task) yet many attempted to draw broad conclusions, and only one study included more than 50 patients. In the future, the field would benefit from larger studies with multiple diverse paradigms conducted on the same patients, followed longitudinally across illness episodes where possible.
Supplementary material
The supplementary material for this article can be found at http://doi.org/10.1017/S0033291726105455.
Author contribution
Conceptualization: C.M.-S., T.M., F.de.B., D.S., G.K.M.; data curation: C.M.-S., K.M.; formal analysis: C.M.-S., B.J.G.I., G.K.M.; funding acquisition: C.M.-S., G.K.M.; investigation: C.M.-S., K.M., G.K.M.; methodology: C.M.-S., T.M., F.de.B., D.S., G.K.M.; project administration: C.M.-S.; resources: G.K.M.; software: C.M.-S.; supervision: G.K.M.; validation: C.M.-S., B.J.G.I., K.M., G.K.M.; visualization: C.M.-S.; writing (original draft; review and editing): C.M.-S.; writing (review and editing): B.J.G.I., T.M., F.de.B., D.S., G.K.M.
Funding statement
C.M.-S. is funded by the Medical Research Council Doctoral Training Programme and Pinsent-Darwin Scholarship. This research received support from UKRI (MR/W020025/1). All research in the Department of Psychiatry, University of Cambridge is supported by the NIHR Cambridge Biomedical Research Centre (NIHR203312) and NIHR Applied Research Collaboration East of England. The views expressed are those of the author(s) and not necessarily those of the NIHR or the Department of Health and Social Care.
Competing interests
All authors declare no conflicts of interest.





 Open access

