INTRODUCTION
Urea (CO(NH2)2) is the most important fertilizer worldwide, with a world market share of 57% in mineral nitrogen (N) fertilizer consumption (IFADATA 2015). In the presence of water, urea is quickly hydrolysed to ammonia (NH3), hydroxyl (OH−) ions and carbon dioxide by the ubiquitous enzyme urease (Zaman & Blennerhassett Reference Zaman and Blennerhassett2010). This hydrolysis reaction results in an elevated pH surrounding the fertilizer granule, which switches the ammonium (NH4 +)/NH3-equilibrium towards a higher NH3 concentration in the soil solution and induces high emissions of NH3 into the atmosphere (Sommer et al. Reference Sommer, Schjoerring and Denmead2004). Part of the emitted NH3 is deposited on vegetation surfaces, where it causes acidification and eutrophication on a regional scale. Its impact is great, especially when deposited in natural and semi-natural ecosystems, and can result in an ecological shift in species diversity (Van Breemen et al. Reference Van Breemen, Burrough, Velthorst, Van Dobben, De Wit, Ridder and Reijnders1982; Bouwman & Van Vuuren Reference Bouwman and Van Vuuren1999).
Among other things, the length and extent of the phase during which these losses occur depends on climatic parameters, such as temperature and precipitation (Ernst & Massey Reference Ernst and Massey1960; Black et al. Reference Black, Sherlock and Smith1987; Sherlock et al. Reference Sherlock, Freney, Bacon and Van Der Weerden1995; Sommer et al. Reference Sommer, Schjoerring and Denmead2004). On grassland, NH3 losses following urea application vary between 6 and 30% of applied N and occur within a period of 3–7 days, with the maximum rate being recorded on days 1–3 following fertilization (Black et al. Reference Black, Sherlock and Smith1987; Watson et al. Reference Watson, Poland, Miller, Allen, Garrett and Christianson1994; Sherlock et al. Reference Sherlock, Freney, Bacon and Van Der Weerden1995; Van Der Weerden & Jarvis Reference Van Der Weerden and Jarvis1997; Dawar et al. Reference Dawar, Zaman, Rowarth, Blennerhassett and Turnbull2011; Sanz-Cobena et al. Reference Sanz-Cobena, Misselbrook, Camp and Vallejo2011).
These losses of NH3 from urea can be inhibited by immediately incorporating the fertilizer into the soil (Sommer et al. Reference Sommer, Schjoerring and Denmead2004). However, when N is applied to grassland, mechanical incorporation into the soil usually disturbs the grass sward and is therefore not economically viable. One possibility for avoiding NH3 emissions following the application of urea to grassland is the use of a urease inhibitor (UI) (Saggar et al. Reference Saggar, Singh, Giltrap, Zaman, Luo, Rollo, Kim, Rys and Van Der Weerden2013). These inhibitors reversibly block the active centre of the enzyme urease, thus impeding the hydrolysis of urea (Medina & Radel Reference Medina, Radel, Bock and Kissel1988). Ideally, this effect should last until the next precipitation, which dilutes urea at the soil surface and moves it into the soil, where it is safe from being lost as NH3 (Watson Reference Watson2000).
Many UIs have been tested, which show greater or lesser effects on mitigation of NH3 emissions (Medina & Radel Reference Medina, Radel, Bock and Kissel1988; Watson Reference Watson2000). The most widely used UI is nBTPT or ‘Agrotain’, which is capable of reducing NH3 emissions following the application of granulated urea to grassland by 45–65% (Dawar et al. Reference Dawar, Zaman, Rowarth, Blennerhassett and Turnbull2011). However, nBTPT is not the active form and has to be converted into its oxygen analogue first, which can delay its efficiency by minutes, hours or even days (Saggar et al. Reference Saggar, Singh, Giltrap, Zaman, Luo, Rollo, Kim, Rys and Van Der Weerden2013). From 2001 to 2006, in two approved joint projects financed by the German Federal Ministry of Education and Research, Stickstoffwerke Piesteritz GmbH together with Humboldt Universität zu Berlin, Martin-Luther-Universität Halle-Wittenberg and Technische Universität München (Support code 0330202) developed and tested new UIs on their efficiency to reduce NH3 emissions following the application of granulated and liquid urea. N-(2-nitrophenyl) phosphoric triamide (2-NPT) turned out to be the most promising UI (Hucke et al. Reference Hucke, Niclas, Wozniak, Michel and Schuster2010). It is very stable during storage and has been shown to reduce NH3 emission from granulated urea applied to winter wheat by 26–83% (Ni et al. Reference Ni, Pacholski and Kage2014).
The present work now aims to evaluate the potential of this new UI 2-NPT to reduce NH3 emissions following the application of granulated urea to grassland.
MATERIALS AND METHODS
Experimental sites
In both years 2007 and 2008, field experiments were carried out from late May to late July. They were conducted on two permanent grassland sites in Southern Germany. In 2007, the experimental site was at Veitshof (48°24′N, 11°41′E, 446 m a.s.l.). To evaluate the efficiency of the UI 2-NPT on a second site, in 2008, experiments were conducted at Dürnast (48°40′N, 11°69′E, 485 m a.s.l.). Both sites consisted of an established sward of perennial ryegrass (Lolium perenne L.), which was cut four or five times per year, mainly for silage production.
Soils were Endofluvic Chernozem in 2007 and Cambisol in 2008, according to IUSS Working Group WRB (2007).
Soil analysis
Prior to the experiment, representative soil samples were taken from a depth of 0–0·15 m and analysed for the parameters listed in Table 1. Soil pH was determined following Schofield & Taylor (Reference Schofield and Taylor1955; 0·01 m CaCl2). Soil texture was analysed in compliance with Gee & Bauder (Reference Gee, Bauder and Klute1986), whereby organic matter first had to be removed by the use of hydrogen peroxide (H2O2). Urease activity was determined using a 0·01 m CaCl2 solution following the unbuffered method of Kandeler & Gerber (Reference Kandeler and Gerber1988) and cation exchange capacity following extraction into a buffered 0·1 m BaCl2 solution (pH 8·1). Organic carbon content (Corg) was calculated as (Corg = Ct − Ccarb), with the total C content (Ct) determined in a C/N-analyser (ANCA-NT system, Europa Scientific Ltd.) and the carbonatic carbon content (Ccarb) measured following the volumetric calcimeter method (Loeppert & Suarez Reference Loeppert, Suarez, Sparks, Page, Helmke, Loeppert, Soltanpour, Tabatabai, Johnston and Sumner1996).
Soil characteristics of the experimental sites

Corg, organic carbon; CEC, cation exchange capacity.
Experimental setup
In both years, the plots were 2 × 5 m2 in size. Per measurement period, 12 plots were installed in a random block design for simultaneous comparison of four fertilizer treatments with three replicates. Four measurement periods were carried out in 2007 and three in 2008.
A measurement period lasted at least 10 days and was stopped when suitable climatic conditions for the start of the next period were expected. Thus, experimental periods lasted between 10 and 21 days. However, for a better comparison of the course and extent of NH3 losses in the current work, all measurement periods are reported over 10 days.
All experimental periods were started after a period of precipitation and as soon as a warmer and rainless phase was forecast, which ensured moist conditions at the soil surface and thus a better dissolution of the granules. Warm temperatures enhanced conditions for high NH3 losses. The only exception was the first measurement period in 2007, where soil conditions at the time of fertilization were dry.
The day before fertilization, the grassland of the plots to be measured was cut down to a stubble height of 0·05 m with a plot grass harvester. The granulated fertilizer was surface-applied using an exact plot fertilizer spreader. Straight after fertilization, the NH3 emission measurement system was installed and started.
In all measurement periods there was a control treatment which received no N (0N), and a treatment consisting of granulated urea. In 2007, the two additional fertilizer treatments were granulated urea + 2-NPT in a concentration of 1·0 g/kg N and calcium ammonium nitrate (CAN). The CAN was chosen because it is the most widely used chemical fertilizer in Germany, where it accounts for 37% of N fertilizer consumption followed by urea with 21% (IFADATA 2015). Therefore, it is often used as a reference point when comparing fertilizer efficiency. As no NH3 losses following the application of CAN were detected in 2007, CAN was left out in 2008. In that year, the two additional fertilizer treatments consisted of urea + 2-NPT in two different concentrations of 0·75 and 1·5 g/kg N. For all experimental periods, mineral fertilizer rate was 80 kg N/ha, which is a common dose per cut for intensively used grassland in Germany (Wendland et al. Reference Wendland, Diepolder and Capriel2012).
CAN was obtained from the local distributor. Urea was provided by SKW Stickstoffwerke Piesteritz GmbH (Lutherstadt-Wittenberg, Germany). Application of the UI 2-NPT to the urea granule was carried out by SKW Stickstoffwerke Piesteritz GmbH and did not influence the granules' size of approximately 3 mm in diameter.
Harvesting of the experimental plots was performed using a plot grass harvester to determine biomass yields. Harvest dates were scheduled according to agronomic criteria, and in some cases had to be delayed due to climatic conditions. Therefore, harvesting took place 33–52 days after fertilization.
Instrumentation and measurement
A dynamic chamber system was used for NH3 measurements (Khalil et al. Reference Khalil, Buegger, Schraml, Gutser, Schmidhalter and Richards2009). The ‘open top’-chambers (Figs 1(a) and (b); area 0·125 m2, height 0·40 m, volume 0·05 m3) had a stainless steel ring on the bottom that was sunk into the soil by about 0·03 m. The chamber's body consisted of acrylic glass. Heating wires were wound around the chamber to prevent surface condensation, which would cause adsorption of emitted NH3. The chamber was covered to permit inside air to flow out while simultaneously inhibiting the entry of external air. There were two measuring stations in operation, each equipped with six chambers (Fig. 1(c)). Each of the 12 chambers was installed on one of the 12 plots. Over the measurement periods of 10 days, the chambers were relocated daily within the plot, both to avoid a ‘greenhouse’ effect, and to record actual climatic influences on the occurrence of NH3 emissions.
Scheme of the dynamic chamber (a) and its sampling unit in the tapered top (b). NH3 measurement system installed on the grassland experimental site Dürnast in 2008 (c).

Ventilators were used to collect ambient air 2 m above ground level and blow it tangentially into the chambers through 12 m of Teflon tubes (Fluorethylen-Propylen (FEP); inner diameter: 18 mm) at an average volumetric flow rate of 40 litres/min (inlet velocity: 3·3 m/s). The air took up the emitted gaseous N and spiralled upwards to the tapered top of the chamber, where the sample collection system was installed. This system continuously drew a sample out of the air stream (wind velocity: 0·005 m/s) at a constant flow rate of 4 litres/min from the chamber through 9 m of insulated (Foamed Polyurethane (PUR)) and heated (50 °C) Teflon tubing (FEP; inner diameter: 8 mm). Before entering the measurement device, an upstream distribution system consisting of magnetic valves ensured that the air samples of the six chambers per measurement system were processed one at a time. The sampling time for a chamber varied between 15 and 30 min depending on the expected NH3 concentration in the sampled air and on the expected difference in the NH3 concentration from the sample in the preceding chamber.
The measurement device for the detection of the nitric oxide (NO) content in the air (CLD 700 AL, EcoPhysics, Gürnten, Switzerland) was based on the chemiluminescent gas phase reaction of NO with ozone (O3). For this purpose, all NO x and NH3 had to be converted into NO first. For nitrogen dioxide (NO2), this conversion was performed by a molybdenum (Mo) thermal converter (3 NO2 + Mo → 3 NO + MoO3) at 375 °C. At a temperature of 600 °C, NH3 was converted into NO by the addition of O3 in a stainless steel converter. The two-chamber principle of the measuring device divided the sampled air into two streams. One stream passed only through the Mo converter ([NOx] = [NO] + [NO2]), and the other passed through both, first the steel converter and then the Mo-converter ([NOx amines] = [NOx] + [NH3]). The concentration of NO within these two streams was measured in the photomultiplier (PMT). Thereafter, the NH3 content was calculated by [NH3] = [NOx amines] − [NOx]. Samples were collected and analysed throughout the day, establishing the progression of NH3 emissions for every applied fertilizer treatment.
For every measurement day, the daily amount of NH3 emissions (g NH3-N/ha and d) was calculated for each chamber by:
 $$F {\rm (NH_{3})} = {\rho _{\rm N}}\Delta c\;Q\;A^{-1}$$
where F (NH3) is the NH3-flux (ng N/(m2 s)), ρ N the standard density of the nitrogen in NH3 (ng N/nl), Δc the concentration difference between sample and ambient air (ppbv = nl/l), Q the volume flow rate (Nl/s) and A the chamber area (0·125 m2). Daily emissions from each chamber were used for statistical evaluation. To determine the amount of N lost as NH3 following fertilizer application, average NH3 emissions detected on control plots were subtracted from average NH3 emissions measured on the fertilized plots.
Climatic data
For both sites, the long-time mean air temperature in the months of May, June and July is 12·4, 15·1 and 17·0 °C, respectively. Average precipitation in these months amounts to 77·5, 97·5 and 108·8 mm, respectively.
In 2007, the Deutscher Wetterdienst (DWD) provided data on precipitation from a nearby weather station (located 3 km northwest of the experimental site) at a daily resolution. Soil temperature was measured at a depth of 0·05 m at the experimental site (Th2-h, UMS GmbH, Munich, Germany), except during the first measurement period, where the measurement system failed, and air temperature had also to be obtained from the DWD at a daily resolution.
In 2008, both, air temperature and precipitation were recorded by the DWD at the same weather station (now located 400 m east of the experimental site) used in 2007 and were provided at a resolution of 30 min.
Statistical evaluation
All statistical evaluation was performed in R (R Development Core Team 2011).
For each measurement period, fertilizer treatments (independent variable) were compared according to their NH3 emissions (dependent variable). For this, daily NH3 emissions (see earlier for calculation) occurring over the measurement period of 10 days were added up for every fertilizer treatment. As data were normally distributed, sums of NH3 emissions of all four fertilizer treatments were submitted to a POLYANOVA analysis to evaluate possible differences. Subsequently, data were subjected to a mean value analysis using Fisher's least significant difference (LSD) procedure (P ⩽ 0·05). Grass yields were also subjected to an ANOVA.
Regression analyses were performed to investigate possible effects of climatic and soil factors on NH3 emissions. A multiple regression analysis could not be conducted, since only a few degrees of freedom were left.
RESULTS
Ammonia losses from the Veitshof site in 2007
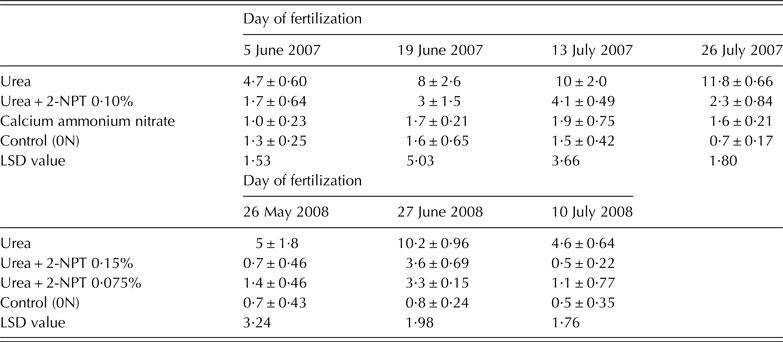
The temperature course and distribution of rainfall events in the months of May–July were typical for an average year. Ammonia losses over 10 days of measurement following the application of granulated urea varied between 4·7 and 11·8 kg NH3-N/ha (Table 2), corresponding to 4·2 up to 14·0% of the applied N. In all experiments, the emissions started immediately following fertilization and peaked on the second day (Figs 2(a)–(d)).
Courses of NH3 emissions (ppmv) within 10 days following fertilization of urea, urea + 2-NPT at a concentration of 1·0 g/kg N, CAN and control (0N) at the Veitshof experimental site in 2007 during four measurement periods (a–d). Precipitation (a–d), air temperature (a) and course of soil temperature (b–d) are also indicated.

Ammonia emissions (g NH3-N/ha) occurring within 10 days following the application of different fertilizer treatments in 2007 and 2008. Sums in NH3 emission, standard errors and LSD values are indicated

In the first experimental period, fertilizer was applied to dry soil, which resulted in comparatively low losses of 4·2% of the applied N (Table 2), even though the temperatures during the loss phase were similar to the other experiments, with an average of 19·7 °C, and even though the loss phase lasted for about 6 days longer than during the other 10-day measurement periods (Fig. 2(a)).
In the following experimental periods, fertilizer was applied following periods of precipitation. High moisture contents at the time of fertilization enabled a rapid dissolution of urea granules. In the absence of subsequent precipitation, more than 80% of the NH3 losses occurred within 3 days (Fig. 2(c)). Precipitation considerably reduced (Fig. 2(b)) or even terminated (Fig. 2(d)) the NH3 emissions.
In 2007, highly significant differences (P ⩽ 0·001) and significant differences (P ⩽ 0·05) were detected between fertilizer treatments and application dates, respectively. However, no significant interaction was observed between treatments and application dates. In all experiments, the addition of the UI 2-NPT at a concentration of 1·0 g/kg N resulted in lower courses of NH3 volatilization. The UI reduced NH3 emissions by 69–88%. Except for the second measurement, this reduction was significant (P ⩽ 0·01 for the first and third and P ⩽ 0·001 for the fourth measurement, respectively). Unlike urea, CAN was not significantly different from the control or 2-NPT treatment. NH3-N losses varied between 0 and 1·2% of the fertilized N (Table 2).
No significant differences in yield were detected between fertilizer treatments, including the control. Therefore, yield data are not displayed and results are not discussed further.
Ammonia losses from the Dürnast site in 2008
In 2008, the first two 10-day measurement periods were performed during phases of above-average soil temperatures (by 5 and 3 °C, respectively). As in 2007, fertilization was performed following a period of precipitation. The last experimental period was characterized by high rainfall of 22·0 mm on the second day of measurement.
Ammonia losses following the application of granulated urea varied between 4·6 and 10·2 kg NH3-N/ha and reached a maximum loss of 11·6% of the fertilized N. Similar to measurements in 2007, the emissions started immediately following fertilization and peaked on the second day (Figs 3(a)–(c)). In the absence of rainfall, 80% of the NH3 losses also occurred within 3 days (Fig. 3(a)). The second and third NH3 emission periods were prematurely terminated due to high rainfall events of 32·5 mm on the fourth day after fertilization and 22·0 mm on the second day after fertilization, respectively (Figs 3(b) and (c)).
Courses of NH3 emissions (ppmv) within 10 days following fertilization of urea, urea + 2-NPT in concentrations of 0·75 and 1·5 g/kg N and control (0N) at the Dürnast experimental site in 2008 during three measurement periods (a–c). Precipitation and courses of air temperature are also indicated.

In 2008, highly significant differences were detected between treatments (P ⩽ 0·001) and application dates (P ⩽ 0·001), and a significant interaction was observed between treatments and application dates (P ⩽ 0·05). In all measurements, the addition of 2-NPT in both concentrations of 1·5 g/kg N (P ⩽ 0·05 for the first and P ⩽ 0·001 for the second and third measurement period) and 0·75 g/kg N (P ⩽ 0·05, ⩽ 0·001 and ⩽ 0·01 for the first, second and third measurement periods, respectively) significantly mitigated NH3 losses from granulated urea (Table 2). These reductions ranged from 70 to 100% and from 74 to 84% for UI concentrations of 1·5 and 0·75 g/kg N, respectively.
In contrast to measurements conducted in 2007, fertilization significantly increased grass yield (P ⩽ 0·05). Again, no differences in yield were detected between fertilizer treatments (data not shown).
DISCUSSION
Ammonia emissions from urea-treated plots
All experimental periods except the first one were initiated at the beginning of an expected warmer and rainless phase after a period of precipitation. Following the fertilization of granulated urea, an increase in NH3 emissions could be detected immediately after fertilization. The highest emission values were detected on the second day, which is in line with common findings in the literature of emission peaks occurring 1–3 days after fertilization (Black et al. Reference Black, Sherlock and Smith1987; Watson et al. Reference Watson, Poland, Miller, Allen, Garrett and Christianson1994; Sherlock et al. Reference Sherlock, Freney, Bacon and Van Der Weerden1995; Van Der Weerden & Jarvis Reference Van Der Weerden and Jarvis1997; Dawar et al. Reference Dawar, Zaman, Rowarth, Blennerhassett and Turnbull2011; Sanz-Cobena et al. Reference Sanz-Cobena, Misselbrook, Camp and Vallejo2011). At 3–6 days, the duration of the loss phase also was comparable to periods of 3–7 days described in the literature (Black et al. Reference Black, Sherlock and Smith1987; Dawar et al. Reference Dawar, Zaman, Rowarth, Blennerhassett and Turnbull2011; Sanz-Cobena et al. Reference Sanz-Cobena, Misselbrook, Camp and Vallejo2011). A comparison of sums of NH3 emissions measured within 10 or even 7 days showed no differences and thus indicated that measurement periods of 7 days might be sufficient.
Environmental conditions
The key factors affecting NH3 emissions from urea-fertilized grassland have been reported in the literature as being temperature, precipitation and top-soil water content at the time of fertilization (Sommer et al. Reference Sommer, Schjoerring and Denmead2004). Similar to observations by Black et al. (Reference Black, Sherlock and Smith1987), the dry soil surface at the start of the first experiment in 2007 resulted in reduced NH3 losses, which amounted only to 3·3% of the applied N until the first precipitation event 6 days after fertilization on 11 June 2007. In the following measurement periods, fertilization was always performed immediately after a period of precipitation to ensure high soil moisture content, and, corresponding to statements by Black et al. (Reference Black, Sherlock and Smith1987) and Van Der Weerden & Jarvis (Reference Van Der Weerden and Jarvis1997), a rapid dissolution of the fertilizer granules and consequent hydrolysis of urea. As a result, at temperatures similar to those of the first measurement period in 2007 the NH3 emissions were considerably higher in the following experiments.
The progress of NH3 emissions is known to be directly influenced by temperature (Ernst & Massey Reference Ernst and Massey1960; Sherlock et al. Reference Sherlock, Freney, Bacon and Van Der Weerden1995). In both years, this effect can be seen as daily NH3 emission peaks from urea coinciding with the daily temperature peak. However, observations by Van Der Weerden & Jarvis (Reference Van Der Weerden and Jarvis1997) are also supported by these experiments, i.e., the influence of the soil surface humidity at time of fertilization was greater than the temperature effect.
Furthermore, precipitation occurring after the application of granulated urea played a decisive role in the progress of NH3 emissions. Generally, the results of Black et al. (Reference Black, Sherlock and Smith1987) could be confirmed, that the nearer the precipitation event occurred after the date of fertilization, the higher was its emission-terminating or reducing effect. This effect could be observed during the second experiment of 2007 and the third experiment of 2008, where precipitation amounts of 3·8 and 22·0 mm, respectively, on the second day dramatically reduced NH3 emissions. In the second measurement in 2008, a precipitation of 32·5 mm on 27 June terminated high emissions. The enhancement effect of low precipitation on NH3 losses (Van Der Weerden & Jarvis Reference Van Der Weerden and Jarvis1997) was observed during the fourth experiment in 2007, where a precipitation of 0·9 mm on day 2 induced further peaks in NH3 emissions. Black et al. (Reference Black, Sherlock and Smith1987) and Zhu et al. (Reference Zhu, Pattey and Desjardins2000) observed in pasture and in maize, respectively, that after fertilization onto an initially dry soil, a late precipitation permitted a further dissolution and hydrolysis of additional urea, and allowed the volatilization of NH3 to start. This effect was also observed during the first measurement period in 2007, where an emission peak occurred 6 days after fertilization induced by precipitation of 3·8 mm on the previous day. Comparatively low NH3 losses of 4·2% of the fertilized N supported observations made by Zhu et al. (Reference Zhu, Pattey and Desjardins2000) that a delay in NH3 emissions, caused by dry soil conditions at the time of fertilization, led to lower NH3 losses. In the current work, these losses were also clearly lower than those detected immediately after fertilization.
Even though effects of climatic and soil factors on NH3 emissions were observed as described above, no significant relationships between NH3 emissions and air temperature, soil temperature, soil humidity, maximum temperature or precipitation could be detected.
Effect of N-(2-nitrophenyl) phosphoric triamide on ammonia volatilization
The use of urea as a chemical fertilizer to grassland is generally considered not to be efficient because high amounts of the fertilized N can be lost as NH3. In the current work, urea was applied to grassland under favourable conditions for high NH3 losses to evaluate the potential of the UI 2-NPT. Watson (Reference Watson2000) summarized the major importance of a UI as: ‘slowing the hydrolysis of urea and thus allowing more time for the urea to diffuse away from the application site or for rain or irrigation to dilute urea and NH4 + concentration at the soil surface and increase its dispersion into the soil.’ The UI 2-NPT in a concentration of 1·0 g/kg N successfully reduced urea hydrolysis for 7 days after fertilization, until precipitation of 8·4 mm terminated the loss phase. When adding 2-NPT to granulated urea at concentrations of 0·75, 1·0 and 1·5 g/kg N, no delay in the effectiveness of 2-NPT could be detected. Ammonia emissions were reduced right from the start. This can be explained by the fact that the UI 2-NPT is added to the urea granule in its active form, and thus does not have to be converted to that form first. The UI did not delay the time of the maximum loss, but reliably mitigated NH3 emissions throughout the whole loss period. The progression of NH3 emissions from urea + 2-NPT was similarly influenced by precipitation and the daily course of temperature, as described above for urea alone, but it remained at a lower level. The addition of 2-NPT successfully inhibited the hydrolysis of urea and abated NH3 losses by 74–84% for a UI concentration of 0·75 g/kg N, by 69–88% for a concentration of 1·0 g/kg N, and by 70–100% for a concentration of 1·5 g/kg N, indicating that already 0·75 g/kg N would be an optimum level.
The addition of 2-NPT at a concentration of 1·0 g/kg N achieved a reduction in NH3 emissions to a level not significantly different from that following the application of CAN. In absolute numbers, however, NH3 volatilization following the application of CAN was still clearly lower and congruent with observations made by Watson et al. (Reference Watson, Stevens and Laughlin1990) and by Van Der Weerden & Jarvis (Reference Van Der Weerden and Jarvis1997), who detected losses at the same magnitude of 0·1–0·8% of the fertilized N applied as CAN.
Impact of the measurement technique
Following the application of urea to grassland, total NH3 losses of 6 up to 30% of the fertilized N have been reported in the literature (Watson et al. Reference Watson, Poland, Miller, Allen, Garrett and Christianson1994; Van Der Weerden & Jarvis Reference Van Der Weerden and Jarvis1997; Dawar et al. Reference Dawar, Zaman, Rowarth, Blennerhassett and Turnbull2011; Sanz-Cobena et al. Reference Sanz-Cobena, Misselbrook, Camp and Vallejo2011). Although climatic and soil conditions at the time of fertilization were chosen to ensure high NH3 losses in the current experiments, cumulative NH3 emissions were comparatively low, averaging 9·1% in 2007 and 7·2% in 2008 with maximum losses of 14 and 11·6% of the applied N, respectively. Closed measurement systems may generally underestimate losses (Pihlatie et al. Reference Pihlatie, Christiansen, Aaltonen, Korhonen, Nordbo, Rasilo, Benanti, Giebels, Helmy, Sheehy, Jones, Juszczak, Kiefoth, Lobo-Do-Vale, Rosa, Schreiber, Serca, Vicca, Wolf and Pumpanen2013) because the air exchange rates used in the ventilated enclosures (in the current case 0·8 volume changes/min) may not fully mimic real field conditions. The measurement system used in the current work was mainly used for comparative studies between different forms of fertilizer or fertilization strategies. Results should be interpreted with care regarding absolute values; however, as was also stated by Misselbrook et al. (Reference Misselbrook, Nicholson, Chambers and Johnson2005), the results are reliable regarding the comparison of relative differences in NH3 emissions between different fertilizers or fertilization strategies.
CONCLUSIONS
Ammonia losses following the application of granulated urea are known to be higher on grassland than on arable land. However, the extent of volatilization is highly dependent on diverse climatic parameters. When urea is chosen as a chemical fertilizer based on agronomic consideration and the incorporation of the fertilizer is not feasible, the addition of a UI is an alternative for reducing NH3 emissions.
The addition of 2-NPT successfully inhibited the hydrolysis of urea and abated NH3 losses by 74–84% for a UI concentration of 0·75 g/kg N, by 69–88% for a concentration of 1·0 g/kg N, and by 70–100% for a concentration of 1·5 g/kg N.
We thank SKW Stickstoffwerke Piesteritz GmbH for financially supporting this project, Josef Glas, Rudolf Heigl, Reinhold Manhart and Christine Haas for their assistance in field and laboratory work, as well as Markus Dolic for his assistance in proofreading.