I. INTRODUCTION
Exhibiting high mobility, transparency in the visible spectrum, and compatibility with large area, flexible, and low temperature deposition methods, zinc oxide (ZnO)-based semiconductors have become a major research focus over the past decade. Recently, the display community has shown great interest in ZnO-based devices as the successor of amorphous and polycrystalline silicon currently used in many thin-film applications. For example, next generation Active Matrix Liquid Crystal high resolution displays with 4000×2000 pixels, a high frame rate (>240 Hz), and sized larger than 70 inches require a thin-film semiconductor with mobility above 3 cm2/vs.Reference Kwon, Lee and Kim1 Amorphous silicon (a-Si) cannot achieve this value. Low Temperature Polysilicon (LTPS) has the mobility performance, but the high thermal budget makes this a poor candidate for flexible and novel substrates. In addition, silicon is opaque and sensitive to visible light.Reference Conley2 As a result, ZnO-based thin-film semiconductors have been heavily researched. The integration of high dielectric constant (high-k) insulators in ZnO thin-film transistors (TFTs) has demonstrated performance advantages including reduced operating voltage, increased I on/I off ratios, and larger transconductance.Reference Bayraktaroglu, Leedy and Neihard3, Reference Siddiqui, Phillips, Leedy and Bayraktaroglu4 HfO2 has emerged as a high-k dielectric of choice for both silicon microelectronics and thin-film electronics due to the high dielectric constant (εr ∼ 25ε0), low leakage current, and low synthesis temperature.
It is important to investigate device stability to gain understanding about the material system and improve transistor performance. Active matrix organic light-emitting diodes are currently driven by LTPS in small screen applications like hand-held devices, but electrical uniformity issues preclude LTPS from large area applications and correction circuits have to be used even for modest mobile screen sizes.Reference Kwon, Lee and Kim1 ZnO-based thin films can be used for this application as the switching transistor and driving transistor. In both cases, threshold voltage stability is an important issue as driving transistor threshold voltage instability of only 0.1 V could result in 20% change in luminance.Reference Jeong5 It is clear that illumination stability is a critical issue as ZnO is a likely candidate for many future transparent and display applications where TFTs will be directly exposed to light in the visible spectrum.
Prior work on ZnO-based semiconductor TFT bias illumination instability has indicated that illumination typically causes or enhances negative threshold voltage shifts.Reference Shin, Lee, Hwang, Park, Cheong, Ryu, Byun, Lee and Chu6–Reference Yang, Cho, Ryu, Park, Hwang, Jang and Jeong8 Three mechanisms have been reported as governing these instabilities: photo generated interface/dielectric hole trapping,Reference Shin, Lee, Hwang, Park, Cheong, Ryu, Byun, Lee and Chu6 photodesorption of oxygen-related molecules,Reference Yang, Cho, Ryu, Park, Hwang, Jang and Jeong8 and creation of photo-excited donor states.Reference Kwon, Jung, Son, Lee, Park, Kim, Park, Choi, Jeong, Koo and Lee9 In addition, reports have shown a dielectric dependence on light-induced instabilities of ZnO-based amorphous semiconductors.Reference Ji, Kim, Mo, Jeong, Yang, Hwang, Park, Ryu, Lee and Jeong7, Reference Kwon, Jung, Son, Lee, Park, Kim, Park, Choi, Jeong, Koo and Lee9 The light-induced instabilities of nanocrystalline ZnO with HfO2 gate dielectrics have not been investigated to date and are reported in this work.
II. EXPERIMENT
ZnO TFTs with HfO2 gate dielectric thin films deposited on p++ Si substrates were investigated. Amorphous HfO2 dielectrics with a thickness of 30 nm were deposited by atomic layer deposition at 250 °C with an O2 plasma power of 300 W. Polycrystalline ZnO was deposited by pulsed laser deposition with laser energy of 2.6 J/cm2 (λ = 248 nm) and a repetition rate of 30 Hz. During the deposition, the substrate temperature was 200 °C and O2 partial pressure was 10 mTorr. Details of the HfO2 and ZnO thin-film material properties have been reported elsewhere.Reference Bayraktaroglu, Leedy and Neihard3 TFTs with gate length of 5 μm and width of 500 μm were fabricated using standard photolithography, etching, and metal liftoff processes. Ohmic contacts to ZnO were formed using Ti/Au (500/3500 Å). Active device regions were defined by mesa isolation using dilute HCl. The device structure and optical microscope image of a typical TFT have been reported previously.Reference Siddiqui, Phillips, Leedy and Bayraktaroglu4
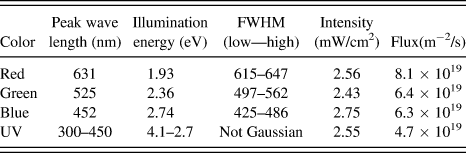
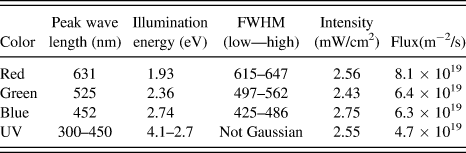
TFT I–V parametric testing and photoconductivity studies were carried out using a 4200 SCS (Keithley Instruments, Inc., Cleveland, OH) and a probe station (MicroManipulator, Carson City, NV) with temperature-controlled chuck. Light sources used were three light-emitting diodes with Gaussian wave length profiles and a BLAK-RAY brand ultraviolet (UV) light source fitted with a violet low-pass filter. Wave length content can be found in Table I.
Light source information.
Typical, as-processed, TFTs exhibit square law behavior above the threshold voltage (V TH), where V TH and μFE are extracted from the linear region of the  versus V G curve based on the relation:

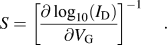
where C OX is the gate insulator capacitance per unit area, and W and L are the TFT channel width and length, respectively. A constant current window (I EVAL) is used to extract V TH and μFE to accommodate shifts in the transfer characteristics with time. I OFF is the I D off-state current, which is extracted by taking the minimum value of I D. Subthreshold slope (S) is extracted from a 2-decade range in the subthreshold region of the log10(I D) versus V G curve and calculated according to Eq. (2). The range minimum is typically 0.5 decades above I OFF.
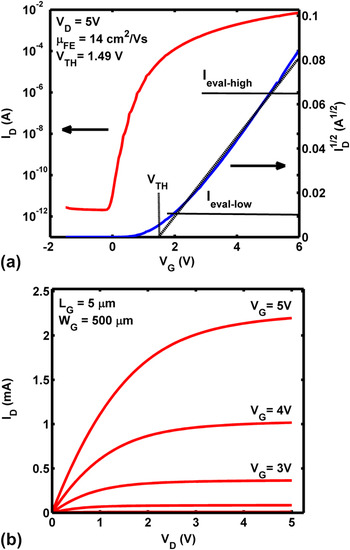
Representative transfer curves measured at room temperature are shown in Fig. 1, with extracted values of V TH = 1.5 V, μFE = 14 cm2/Vs, S = 144 mV/decade, and I OFF = 1 × 10⁻¹² A.
Representative (a) I D–V G transfer curves used to extract TFT threshold voltage, mobility, and subthreshold slope and (b) I D–V D output characteristics of ZnO/HfO2 TFTs before illumination testing.

III. LIGHT-INDUCED TFT INSTABILITIES: ZnO WITH HfO2 GATE DIELECTRIC
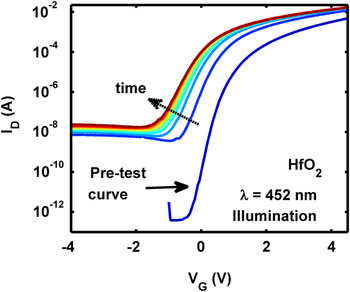
In this section, we investigate the effects of illumination on TFT stability. TFTs were biased at V GS = 0 V and V DS = 0 V with a chuck temperature of 300 K. An initial “dark” I D–V G curve is taken; then, the device was illuminated at a given wave length and repeatedly remeasured over the course of 8 × 10³ s. A typical family of curves can be seen in Fig. 2. For all wave lengths, each family of curves showed a negative ΔV TH, positive ΔI OFF, and positive ΔS.
Family of TFT curves taken over the course of illumination study.

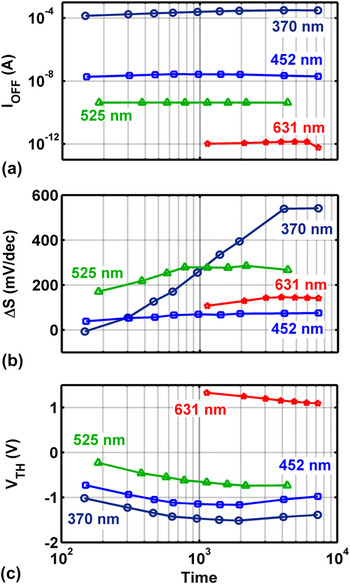
Figure 3(a) shows the trend in I OFF, with wave length. I OFF gently increases over the first many hundreds of seconds and levels off at a value that increases with radiation energy. Figure 3(b) shows ΔS versus time where subthreshold slope is evaluated over a different current range for each wave length. This was necessary due to I OFF values often above typical subthreshold slope evaluation windows. Each curve shows a logarithmic-like initial increase and then a leveling off. No trend is seen with energy. Figure 3(c) shows the trend in V TH with wave length showing an initial exponential decay with similar logarithmic time slopes and increasing magnitudes with radiation energy.
TFT data for polycrystalline ZnO TFTs under various wave length illumination.

IV. POSTILLUMINATION RECOVERY: ZnO TFTs WITH HfO2 DIELECTRICS
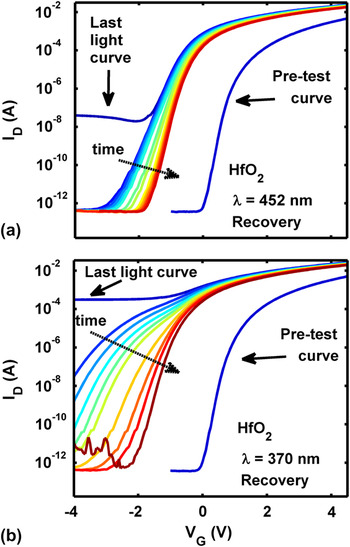
After illumination, each TFT was left in the dark, and transfer characteristics were periodically measured to record recovery characteristics. Figure 4 shows two families of recovery curves including the last illumination and preillumination curves, for comparison.
Recovery characteristics can be seen in family of TFT I D–V G curves for blue (a) and UV (b) illumination.

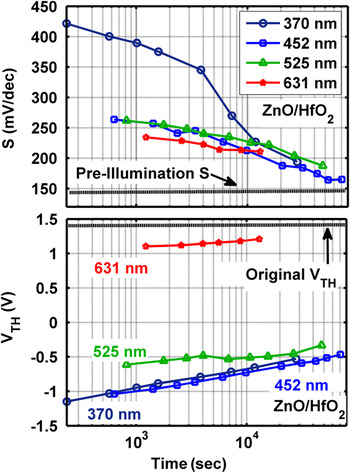
V TH and S recovered partially over the measurement period with a logarithmic shape, while I OFF recovered fully and immediately as seen in Fig. 4(a). Figure 5(a) shows subthreshold slope recovery data. Independent of energy, subthreshold slope values converge to nearly preillumination values. Figure 5(b) shows the trend in V TH recovery with time and wave length. Each case shows a logarithmic increase as V TH begins to recover, but only a fraction (less than 50% in all cases and 10% for 525-nm case) of the total is recovered in an order of magnitude more time than the illumination period.
Recovery characteristics for S and V TH.

V. ANALYSIS
A. I OFF
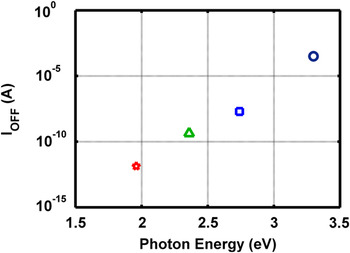
The UV case is the only illumination source with energy above the ZnO band gap. As a result, I OFF energy dependence indicates that there are subband gap states that allow light with subband gap energies (<3.37 eV) to interact with carriers. Increasing I OFF with increasing radiation energy indicates states are distributed throughout the band gap. Figure 6 shows a plot of I OFF versus radiation energy. I OFF with radiation energy is consistent with subband gap absorption decreasing exponentially below the band edge due to band tail states. It should be noted that data were taken at constant optical power density (W/cm2), not constant flux density [(# photons/s/m2)], which, as a result, is decreasing with increasing energy. The curve in Fig. 6 would be steeper for the case of constant flux.
I OFF versus photon energy.

B. Threshold voltage
Threshold voltage characteristics have an initial trend of linear increase of −ΔV TH with logarithmic time. In the case of energies above 1.96 eV, the slope levels off at time values above 1 × 10³ s. Linear increase with logarithmic time is indicative of charge trapping in a TFT system.Reference Siddiqui, Phillips, Leedy and Bayraktaroglu4 Elements in the system that could contribute to threshold voltage are increased carriers, interface charge, surface charges, and traps in the semiconductor
From I OFF data, we know that there are an increased number of carriers in the system due to photo generation. Increased carrier concentration lowers V TH, but because I OFF recovers very quickly and V TH does not, increased carrier concentration cannot be the sole mechanism responsible for ΔV TH.
Interface-trapped charges need to be considered in the illuminated ZnO/HfO2 system as increased positive charge would contribute to −ΔV TH. Three reasons exist indicating that interface states are not the governing mechanism for ΔV TH: first, there is no gate voltage influencing channel minority carriers toward the interface or dielectric. Second, the recovery temporal characteristics of V TH are slow, but interface-trapped charge is expected to recover quickly, in seconds or minutes.Reference Cross and De Souza10 While charge at the interface or in the dielectric could play a role in ΔV TH, we do not see strong evidence of this in our data.
Since our devices are not passivated, it is necessary to consider effects due to the exposed backside semiconductor surface. Photodesorption of oxygen and water molecules from the surface of ZnO-based semiconductors has been reported to cause negative threshold voltage shifts.Reference Kwon, Lee and Kim1 Conversely, there have been reports of negative threshold voltage shifts, which are independent of oxygen ambient or, despite unpassivated surfaces, governed by a different mechanism.Reference Kwon, Jung, Son, Lee, Park, Kim, Park, Choi, Jeong, Koo and Lee9 We do not report on the dependence of surface charges in this work but do show strong evidence that ΔV TH is, at least partially, governed by grain boundary trap states, as discussed in the next several paragraphs.
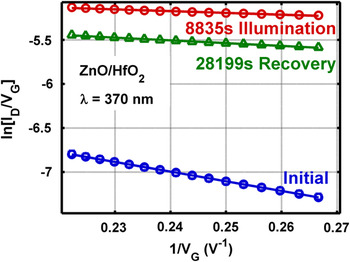
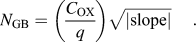
Aside from interface trap charges, dielectric trap charges, and surface states, grain boundary-trapped areal charge density (N GB cm−2) could be present influencing ΔV TH. If grain boundary trap states play a role, one would expect ΔN GB to correlate with ΔV TH. N GB in polycrystalline ZnO can be determined from the square root of the slope of ln(I D/V G) versus 1/V G as described by Levinson et al.Reference Gupta, Yoo, Lee and Hong11, Reference Levinson, Shepherd, Scanlon, Westwood, Este and Rider12Figure 7 shows a representative plot used to extract N GB from the range of I D–V G near maximum V G.
Plot of ln(I D/V G) versus 1/V G for three time points in the UV illumination/recovery study. Circle, triangle, and square markers represent data and the solid lines are the fit used to extract the slope used in Eq. (3).

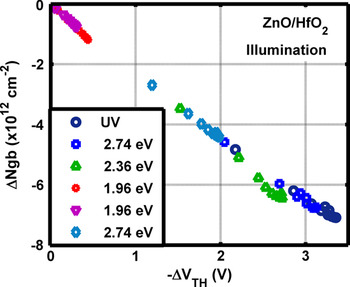
Figure 8 shows the strong correlation between the decrease in N GB and increase in negative threshold voltage shift for all radiation energies. Figure 9 shows a strong correlation with recovery as well. This result indicates there is a link in the mechanism reducing N GB and shifting threshold voltage. This correlation can be described by the conduction model developed for polycrystalline semiconductors based on thermionic emission above grain boundary barriers, shown in Eq. (4)

Change in grain boundary-trapped charge density versus change in V TH for all illumination cases.

Change in grain boundary-trapped charge density versus change in V TH.

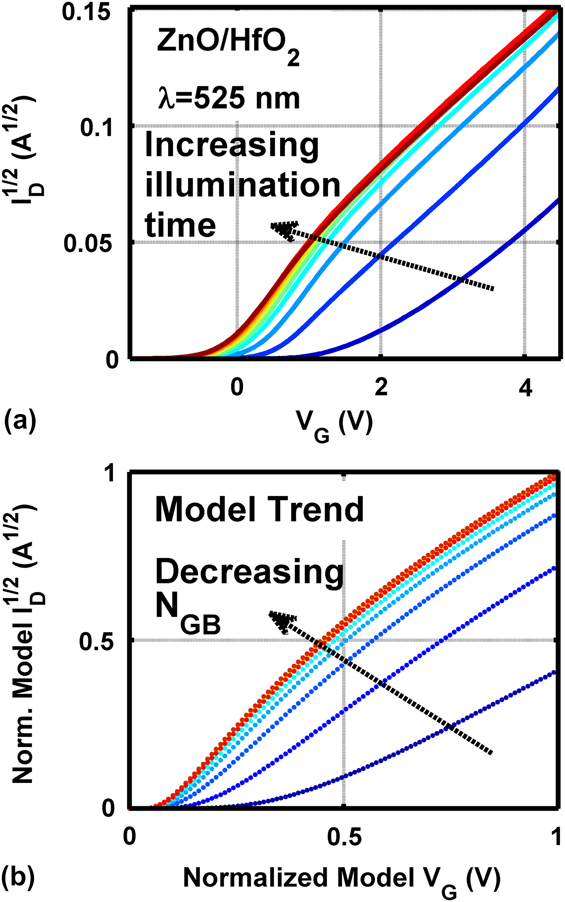
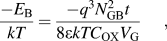
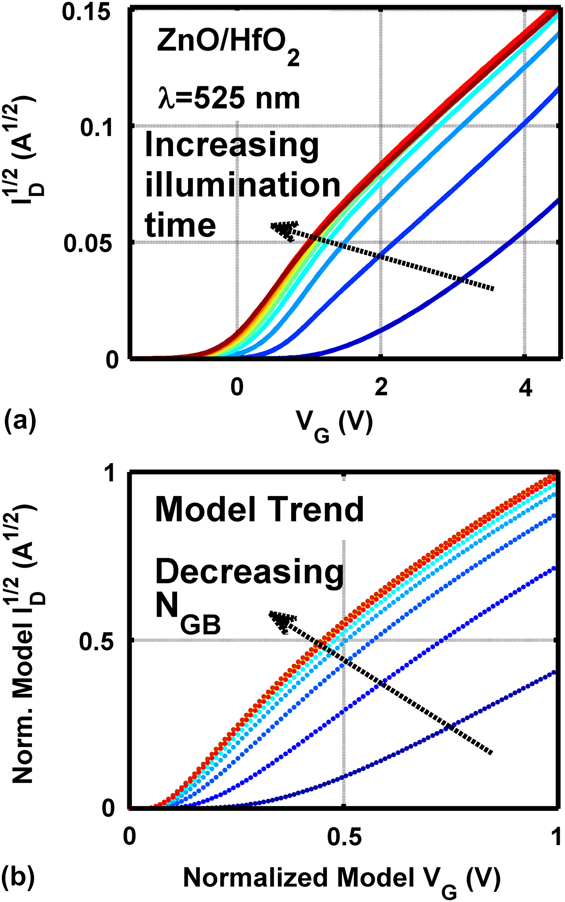
where w and l are gate width and length, μb is the scattering adjusted grain barrier mobility, and t is the semiconductor thickness.Reference Levinson, Shepherd, Scanlon, Westwood, Este and Rider12Equation (4) is based on the assumption that there are partially depleted grains, which is valid for this system. Figure 10(a) shows √I D–V G experimental data; each curve represents a different illumination time. Figure 10(b) shows simulated data, using Eq. (4), where each curve assumes a different grain barrier trap density. The N GB value inputs were extracted from the experimental data plotted in Fig. 10(a). The simulation is plotted in normalized units to show the good agreement in the shape and trend with N GB between the experimental and modeled curves. It can also be seen that varying N GB as observed experimentally is responsible for changes in I D–V G curves, which lead to shifts in extracted threshold voltage (via the method described in Sec. II). It is clear that a reduction in N GB can cause the negative ΔV TH witnessed experimentally.
(a) Experimental data exhibiting characteristics of polycrystalline TFT dominated by thermionic emission above grain barrier. (b) Model data using Eq. (4). The N GB values extracted from (a) are the inputs into (b).
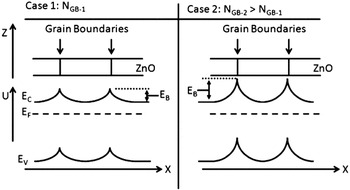
With respect to the illumination dependence and effect, one assumption made in the development of Eq. (4) is that traps are assumed to be initially neutral and become charged by trapping a carrier. Since ZnO is intrinsically n-type, we assume that the neutral traps are already filled in the as-processed case. Therefore, upon illumination, a photon can give its energy to a trapped carrier exciting it out of the trap and reducing the overall charge density, thus influencing the system according to the discussion above. The band structure of a semiconductor with N GB-1 compared with a semiconductor with N GB-2, where N GB-2 > N GB-1 can be seen in Fig. 11.
Band diagram view of polycrystalline grain boundaries limiting conduction to thermionic emission over barriers of height E B, which is proportional to  . (Adopted from Levinson et al.)Reference Levinson, Shepherd, Scanlon, Westwood, Este and Rider12

VI. SUMMARY
In this work, we have investigated instabilities of polycrystalline ZnO TFTs with high-k HfO2 gate dielectrics via temporal characteristics of TFT curves under illumination. Illumination of TFT devices biased at zero V G shows an increase in I OFF, subthreshold slope, and −ΔV TH. I OFF characteristics indicate subband gap trap states exist throughout the ZnO band gap. We see a negative threshold voltage shift without gate bias exhibiting temporal characteristics indicating an extremely strong correlation between −ΔV TH and −ΔN GB. This indicates that illumination-enhanced carrier emission from grain boundary traps reduce total N GB and thus the grain boundary potential barriers. We have observed that reduction in modeled N GB (and thus lowered potential barriers) has a direct effect on extracted ΔV TH with trends matching experimental data. We conclude that, while we do not have a definitive answer for complete governance of ΔV TH, experimental data suggest that grain boundary-trapped charge density has a strong influence.