1. Introduction
The response measures implemented to combat the Coronavirus 2019 (COVID-19) pandemic have created an unprecedented situation in which countries worldwide are forced to temporarily reduce their economic activities, which means reducing the creation of income and, as a consequence, environmental pollution (Helm, 2020; Le Quéré et al., Reference Laborde, Martin, Swinnen and Vos2020; Sarkodie and Owusu, Reference Ratha, De, Kim, Plaza, Seshan and Yameogo2020). An important issue becomes an understanding of what the magnitude the economic impacts of the lockdown are, as well as understanding the economic and environmental impact of counteracting economic policies to combat and cushion the economy during recovery. South Africa, which is an emerging economy, presents an interesting case to analyse as the country is vulnerable to economic shocks, while the degree of environmental pollution is relatively high (Ntombela et al., Reference Ntombela, Kalaba and Bohlmann2019; Ahmad and Khattak, Reference Aguiar, Chepeliev, Corong, McDougall and van der Mensbrugghe2020; Ndiili, 2020). The country has one of the highest income inequalities, as measured by the Gini coefficient. Close to half the population is living below the poverty line, while a quarter of the population lives below the food poverty line.
South Africa is amongst the 20 largest carbon dioxide (CO2) emitting countries worldwide and has one of the highest per capita emissions in the developing world. This is a result of a domestic economy that is heavily reliant on coal-fired energy and liquid fuels (UNEP, Reference Sarkodie and Owusu2004; Ahmad and Khattak, Reference Aguiar, Chepeliev, Corong, McDougall and van der Mensbrugghe2020). The National Climate Change Act of 2018 encompasses the country's Nationally Determined Contribution, consistent with its pledge under the Copenhagen Accord, in which South Africa voluntarily pledged to reduce its emissions by 34 per cent by 2020 and 42 per cent by 2025 from business-as-usual (National Treasury, Reference Matete and Hassan2010). Furthermore, South Africa suffers from chronic water shortages, with an annual supply of about 15 billion cubic meters (about 50 per cent of the world average). The main water supply constraints are low levels of seasonal rainfall, insufficient aquifers, and a dependency on water transfers between basins and from other countriesFootnote 1 (Matete and Hassan, Reference Maliszewska, Mattoo and van der Mensbrugghe2006; Letsoalo et al., Reference Le Quéré, Jackson, Jones, Smith, Abernethy, Andrew, De-Gol, Willis, Shan, Canadell, Friedlingstein, Creutzig and Peters2007). Water demand is high, with an average consumption of about 235 litres per capita per day, compared to a world average of 185 litres per capita per day (Department of Water and Sanitation, 2017).
The COVID-19 pandemic has brought to the fore the tensions posed between climate policy and livelihoods in South Africa. The environmental benefit of the lockdown lies in slowing down emissions from the decrease in international and domestic travelling and in reduced pollution as industry grinds to a halt. However, economic livelihoods will be severely compromised the longer the lockdown persists. The balancing act of managing COVID-19 while also addressing environmental policies is especially challenging in the context of the country's extreme inequality, unemployment and poverty. There are therefore many trade-offs which make clear-cut conclusions difficult if not impossible and, as a result, a simulation model may shed some light on the issue.
In this paper we use a dynamic computable general equilibrium (CGE) model to evaluate the impacts of the COVID-19 lockdown and the South African fiscal policies to counteract the economic damages on economic actors (income and equality) and on the environment (greenhouse gas emissions and water usage). We extend the recent work on COVID-19 for South Africa and Africa as a whole (see, for example, Zidouemba et al., Reference van Seventer, Bold, Gabriel and Davies2020; Chitiga-Mabugu et al., Reference Burger, Coetzee, Kreuser and Rankin2021; van Heerden and Roos, 2021) by evaluating the likely environmental implications of the pandemic and recovery policies. The strengths of models in the CGE tradition, in the context of studying the COVID-19 pandemic effects, lie in the fact that they help to quantify policy options by identifying the economic channels through which such effects of the pandemic get transmitted. This can advance the way in which we understand the pandemic's effects, particularly on the environment, thereby providing information to consider when designing environmental policies harnessing the positive environmental impacts of COVID-19, while reducing inequality and poverty. Our model does not address radical behavioural and technological changes associated with COVID-19.
2. Methodology
2.1 Model
A dynamic CGE model, capable of addressing certain environmental issues associated with the ongoing COVID-19 pandemic, is used to evaluate the impacts of the COVID-19-induced lockdown and the government's fiscal package to support the economy. As highlighted above, CGE models are appropriate tools to use in this case because they can represent the whole economy, which enables us to capture the different impacts of COVID-19 (international and domestic impacts) on the different institutions, as well as the government's attempt to mitigate the impacts of the pandemic. The models can capture direct as well as indirect impacts of the shock. The use of a dynamic model makes it possible to capture the impacts of COVID-19 and the policies put in place in both the short and long term. The model used builds from the PEP 1-t model developed by Decaluwé et al. (Reference Chitiga-Mabugu, Henseler, Mabugu and Maisonnave2013) and modifies several assumptions in order to represent the realities of South Africa.
A total of 51 activities and 79 commodities are included in the model, with each activity using capital, labour (skilled and unskilled) and intermediate goods consumption to produce output. The model distinguishes four different institutions, namely: households, firms, government, and the rest of the world. Households are disaggregated per decile of income. They receive their income from labour, capital and transfers. Households at the bottom of the distribution receive mainly transfers from the government (69 per cent of their income) and unskilled labour income, while the richest households receive mainly income from highly skilled labour income and dividends.
Households use their income to pay taxes and transfers to other institutions, and for consumption and saving. On the consumption side, household behaviour is modelled as a linear expenditure system and subject to its budget constraint. Firms mainly derive their income from capital and transfers from other institutions. They pay income tax and transfers to other institutions (dividends) and save the remainder. Government's income is derived from direct taxes paid by households and firms, indirect taxes on domestic sales, import tariffs, transfers from other institutions, and a share of capital income. Government savings is equal to government income less its consumption and transfers paid to other institutions (child support grant, pensions, etc.).
To link South Africa and the rest of the world, the traditional CGE modelling approach is used, whereby trade is modelled based on the assumption of imperfect substitutability of commodities given their origin (the Armington assumption). On the exports side, it is assumed that export demand has a finite elasticity, reflecting the competitiveness of local producers on the international markets. This implies that South African producers need to be more competitive than other producers in order to increase their world market shares.
South Africa faces a very high unemployment rate and, to model it, we follow Blanchflower and Oswald (Reference Bhorat, Köhler, Oosthuizen, Stanwix, Steenkamp and Thornton1995) in assuming that there is a negative slope between unemployment rates and wage rates. Kingdon and Knight (Reference Kerr and Thornton2006) show that the elasticity of wages to local unemployment rates in South Africa is similar to that found in other countries by Blanchflower and Oswald (Reference Bhorat, Köhler, Oosthuizen, Stanwix, Steenkamp and Thornton1995). Labour is mobile across sectors whereas capital is sector specific. The stock of labour rises at the population growth rate each year, while the stock of capital of each sector depends on the new investments made in the sector. The allocation of new investment follows the accumulation equation of Jung and Thorbecke (Reference Helm2003).
To measure the development of environmental impacts, indicators for greenhouse gas emissions and usage of water by industries and households are computed. A greenhouse gas balance for the base year 2015 is constructed with emission levels for the simulated years extrapolated by the relative change of the model variable of production volume to capture resulting greenhouse gas emissions. Intermediate water demand and water consumption by households in the model are used as indicators for water usage.
In terms of closure rules, the nominal exchange rate is the numeraire. The rest of the world's savings is assumed fixed. Finally, South Africa takes world prices as given, which follows from the assumption that the country is a small open country.
2.2 Data
The database used for the CGE model is a 2015 social accounting matrix (SAM) based on that of van Seventer et al. (Reference Van Heerden and Roos2019). Additional data, such as income elasticity from Burger et al. (Reference Blanchflower and Oswald2017) and trade elasticities from Ntombela et al. (Reference Ndiili2018), are used to further operationalise the model. Data from the GHG National Inventory Report for South Africa 2000–2015 (Department of Environmental Affairs, Reference Decaluwé, Lemelin, Robichaud and Maisonnave2016) is used to estimate a greenhouse gas balance, and emissions are disaggregated according to the sectors represented in the CGE model. The sectoral disaggregation uses data provided by the GTAP10 Database (Aguiar et al., Reference Aguiar, Chepeliev, Corong, McDougall and van der Mensbrugghe2019).
3. Scenarios design
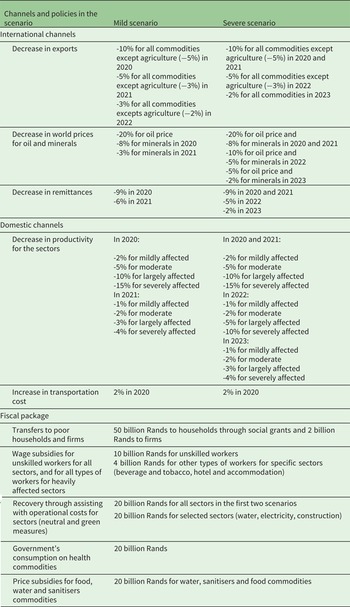
The COVID-19 pandemic is affecting the South African economy in many ways through international and domestic channels of transmission and, therefore, impacts its levels of CO2 emissions and water consumption. In order to mitigate the negative impacts of the pandemic on the economy, the government implemented a fiscal package to prevent the collapse of the economy. We are interested to know whether the implemented policies will be able to sufficiently help the South African economy, and the extent to which the measures will impact CO2 emissions and water usage. In other words, would the expected decline in CO2 and water usage during the lockdown be reversed by the recovery of the economy or not? At present, there is very little clarity on how the global economy will emerge from this crisis, as second and third waves have appeared in most of the countries in the world, leading to new lockdowns. Moreover, it is reasonable to expect that the effects will not have faded by next year and it is not clear whether the economy will return to its pre-crisis level in two years or more. Therefore, we build a mild and a severe scenario that are different in terms of the amplitude of the shocks as well as their duration. For 2020, we assume the same magnitudes for both mild and severe scenarios. In the mild scenario, we assume that the shocks will gradually decrease and the economy will be back to its business-as-usual (BAU) values in 2023. In the severe scenario, we apply the same magnitudes in 2021 as in 2020, and then the shocks are gradually reduced until 2024 (see table 1). The severe scenario could be viewed as a sensitivity analysis showing what would happen if recovery is slower than assumed in the mild scenario.
Assumptions of the simulated scenario

To evaluate the impacts of COVID-19, it is assumed that South Africa is affected through international and national channels. These channels have been identified in other worldwide studies (Laborde et al., Reference Kingdon and Knight2020; Maliszewska et al., Reference Letsoalo, Blignaut, de Wet, de Wit, Hess, Tol and van Heerden2020) and specifically in South Africa (Chitiga-Mabugu et al., Reference Burger, Coetzee, Kreuser and Rankin2021; van Heerden and Roos, 2021). Under the international channels, the country faces a decrease in demand for its exports given the economic situation in trading partners. Indeed, China and European countries which are major trade partners for South Africa face a lockdown or a severe slowdown of their economies, and therefore reduce their demand for imports from South Africa. Moreover, there is a drop in oil price and mineral prices on the international markets. South Africa is a net oil importer but exports many different minerals. Mineral exports represent 20 per cent of the country's total exports. Finally, on the international transmission channel, South African households receive remittances from the rest of the world (e.g., relatives or friends residing and working overseas). It is assumed that during the COVID-19 scourge, this source of income dries up due to the economic situation overseas. This situation is identified by the World Bank which estimates that the remittances will decrease by 9 per cent in 2020 and 6 per cent in 2021 in Sub-Saharan countries (Ratha et al., Reference Ranchhod and Daniels2020). In South Africa, 62 per cent of total remittances are received by the top decile household. However, this amount represents around 1 per cent of their total income. On the domestic channels, the country is affected in many ways. First, because of the lockdown, the majority of the population is staying at home and, when possible, is teleworking. However, this telework is not an option that is feasible for many workers, especially the low-skilled workers (Kerr and Thornton, Reference Jung and Thorbecke2020). Being at home, workers are not using the capital in the factories, which becomes unutilised. The decrease in the productivity of labour and capital has an impact on the production of all sectors, but some are more affected than others. Following Arndt et al. (Reference Ahmad and Khattak2020) and Bhorat et al. (Reference Arndt, Davies, Gabriel, Harris, Makrelov, Modise, Robinson, Simbanegavi, van Seventer and Anderson2020), the sectors of the economy are classified according to their degree of exposure to the shock. Indeed, not all the sectors are affected in the same way, as some are classified as essential and therefore can stay open, while other sectors are not classified as essential and therefore have to stay closed. For example, the agricultural sector is considered as mildly affected, as farmers are continuing to provide food as an essential sector, while the tourism or the transport sectors are considered as severely affected. For the severely affected, they are negatively affected given the national and international COVID-19-induced restrictions, limited flights, and no tourists arriving in the country. Second, we consider an increase in the transport costs for commodities given the situation of the pandemic; haulage trucks are no longer operating at optimal capacity due, for example, to the fact that it now takes longer to fill up a truck trailer, etc.
The South African government put in place a set of measures, as counteracting policies, to support the different sectors and economic institutions through a fiscal package. The three main thrusts of the COVID-19 response centred on financing the public health response to the pandemic (most of it is on health products, sanitisers, additional hospital wards and beds, and on other health-related services like chemicals, plastics), expanding the social grant net needed to fund relief to the poor (already vulnerable at the best of times and now having to bear an even greater economic burden), and providing support to cash-constrained businesses so that they do not become insolvent and shed jobs in an economy already plagued by high unemployment rates.
It is also assumed that in the year after the beginning of COVID-19, given the social distancing at work measures and the likelihood of the continuation of telework, there will be a decrease in the productivity of the sectors. In the mild scenario, we assume that the major trading economies will take more time to recover and therefore demand for South African commodities will continue to be affected until 2023, while in the severe scenario, the ‘back to normal’ situation will be in 2024. Finally, we have modelled what we refer to as a ‘green’ recovery scenario that includes interventions that relate to the implementation of proposed policies and strategies aimed at boosting general economic recovery and revival in the short to medium term, including the environment. We have used key insights contained in the Government's Economic Reconstruction and Recovery Plan of 2020 (Government of South Africa, 2020) and the earlier National Climate Change Act of 2018 to choose the policies simulated. We have designed a ‘green’ recovery scenario based on: (a) assumptions of COVID-19 impact scenarios (mild and severe as described above), and then (b) on top of that, we now introduce a recovery policy based on investing in sustainability measures in the water, electricity and construction sectors. We model this as a fiscal package directed only at the water, electricity and construction sectors. The rationale for this, from an environmental and economic standpoint, is that investing in water and energy is informed by the concern on water and greenhouse gas emissions as drivers of environmental problems. Therefore, a policy that invests in these sectors does not just boost the economy given the sectors' size, but importantly does so targeting green investments. On the other hand, investing in construction acknowledges the importance of the sector, not just as a key investment driver, but also as a major energy consumer, as outlined in the Government Economic Reconstruction and Recovery Plan launched in 2020.
All these scenarios (Mild, Severe and Mild and Severe recovery oriented) will be compared to a BAU scenario, which gives the path of the economy without COVID-19 and the level of emissions the economy would have reached without COVID-19 and the fiscal package. The BAU is calibrated using the actual and forecasted real GDP growth rates from the National Treasury (2017). Table 1 summarises the assumptions of the simulated scenario.
4. Results
4.1 Macro results
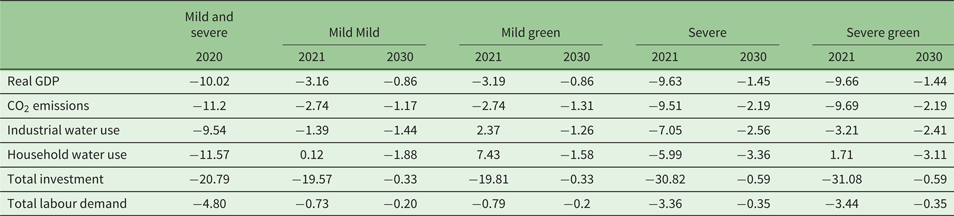
In the short term, the impacts of the COVID-19 pandemic are quite harsh on the economy. Indeed, the economy is simultaneously affected by a supply and a demand shock. On the supply side, the lockdown leads to a decrease in production as machines are largely unused and workers are at home, while on the demand side there is a decrease in demand from the rest of the world, as well as a drop in international prices for minerals and oil. The combined effect is a reduction in GDP by 10 per cent (table 2) in 2020. After the implementation of the government's fiscal package, and given the fact that some effects of the pandemic are still being felt (lower productivity due to social distancing measures, reduced demand for imports from trading partners that are themselves in recession), real GDP is still decreasing by 3.16 per cent in the mild scenario, and by 9.63 per cent in the severe scenario. If a specific target toward greener sectors is implemented in the fiscal package (Sustainability Measures), we find that real GDP is decreasing as well around the same magnitude. In the long run, the economy is unable to return to its initial trajectory and GDP is lower than it would have been without the pandemic and any of the fiscal or greener plans. The reduction in total production also leads to a fall in total labour demand, especially before the implementation of the fiscal package.
Impacts on macroeconomic variables (in per cent) compared to the BAU

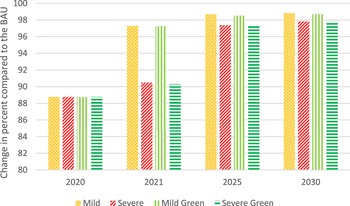
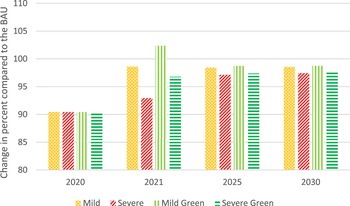
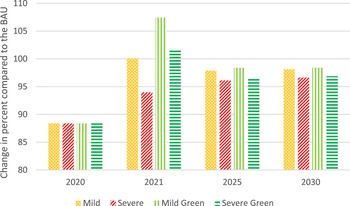
In 2020, greenhouse gas emissions decrease significantly, by 13.9 per cent, but pick up in the next year, when the industries increase their economic activities. However, the emissions remain slightly below the level of the BAU until 2030. For the water usage by industry and households, the reduction accounts for 10 per cent and, similar to the CO2 emissions, the demand increases close to back-to-normal after 2021.
The negative impacts of greenhouse gas emissions result from an accumulation in the atmosphere over time (i.e., global warming and climate change) and the usage of water contributes to the depletion and pollution of water resources over time. Figures 1–3 illustrate that the decrease in annual emissions and water demand in 2020 is significant at around 10 per cent, but it drops in 2025 and 2030 to a decrease of only 1 to 3 per cent. The results of the environmental indicators reflect the expectations that the significant short-term reduction in environmental pollution contributes a small share to the cumulated reduction in the long run (Helm, 2020; Le Quéré et al., Reference Laborde, Martin, Swinnen and Vos2020; Sarkodie and Owusu, Reference Ratha, De, Kim, Plaza, Seshan and Yameogo2020). This suggests the need for continued environmental policies even though the COVID-19-induced reduction of emissions and pollution could inadvertently be assisting with addressing the environmental problem as shown by the environmental indicators just discussed.
Development of cumulated GHG emissions in the BAU and in the scenarios (BAU = 100).

Development of water demand by industry in the BAU and in the scenarios (BAU = 100).

Development of water demand by households in the BAU and in the scenarios (BAU = 100).

4.2 Sectoral and distributional results
Sectors are affected differently depending on whether they are characterised as essential or non-essential, or whether export-oriented or not. Thus, the sectors that are directly negatively affected will reduce their production, retrench workers and reduce their intermediate consumption, impacting other sectors of the economy. As a result of the indirect effects, sectors that were not initially identified as being severely affected will find themselves heavily impacted by the resultant decline in the activity of other sectors. As an example, the food sector, which was not identified as a heavily impacted sector ex-ante sees its production declining by 3.88 per cent in 2020. However, given the fiscal package, the sector benefits from an increase in consumer demand and reacts with an increase in production by 2.45 per cent in 2021 in the mild scenario, and 2.35 per cent in the mild greener scenario. Under the severe scenario, the increase in production is much lower (0.21 per cent in 2021) despite the fiscal package. In the long run, for all scenarios, the production of this sector is decreasing, by 0.43 per cent in the mild scenarios and 0.74 per cent in the severe scenarios.
The usage of industrial water is reduced significantly for the mining sectors (21 per cent), the beverage industry (13 per cent) and the water sector (8 per cent), which supply all industries and households, who reduce their demand for water. The sectors with the highest emissions are the energy sector, the transport sectors, construction and manufacturing industries. During the lockdown in 2020, the energy, construction and transport sectors significantly reduce their emissions. In 2021 these sectors increase their emissions but remain slightly below the emissions expected for the BAU until 2030. As indicated above, the part of the fiscal package focussed on the water sector allows this sector to expand and demands more water than without special fiscal support. This suggests the importance of imposing specific conditions on the use of the fiscal package, for example, for expanding renewable water reservoirs or investing in water demand management strategies.
The drop in production in all the sectors in the short term leads to a drop in total labour demand, and to an increase in unemployment rates. The drop in labour demand is not uniform across the different categories of workers. Indeed, the unemployment increase is particularly severe for unskilled labour which rises by 8 percentage point for workers with less than primary education. This result is consistent with Ranchhod and Daniels (Reference Ntombela, Bohlmann and Kalaba2021) who found that COVID-19 disproportionately affected the least educated. Interestingly, the government fiscal package helps to contain the rise in unemployment. Indeed, under the mild scenario, in 2021, unemployment rates are increasing by 1.14 percentage points for unskilled workers and by 1.09 percentage points under the greener scenario. Under the severe scenario in 2021, the increase in unemployment rate reaches 5.86 percentage points for unskilled workers under the fiscal package and 5.82 percentage points in the greener scenario. The fact that a part of the greener fiscal package is targeted to the three sectors that are intensive in unskilled labour explains the improvement in their situation. In the long run the unemployment rates are almost at the BAU levels.
The impacts on labour demand and unemployment affect households' income. In the short run, households' incomes are decreasing for all categories but, interestingly, the poorest households experience a lower decrease given that a big share of their income comes from social transfers which were kept constant by the government. In 2020 (without any fiscal program), the poorest households see their income dropping by 3.43 per cent against a drop of 7.77 per cent for the richest. South Africa's policy of supporting the poorest during the pandemic even reduces inequalities between household categories. Indeed, looking at the inter-decile gap (D9/D1) or the Palma index, which compares the income gap between the richest 10 per cent and the poorest 40 per cent, it can be seen that these two indicators are narrowing as a result of the government's fiscal package. It is interesting to point out that both indicators are narrowing slightly, more under the greener scenario. However, in the long term, the gap for these two indicators increases. Firms' income is decreasing throughout the period, and so is its savings. Government's income is decreasing during the pandemic given the reduction in the receipts in direct and indirect taxes. Indeed, given the decrease in their income, households reduce their consumption and pay less in taxes (direct and indirect). Moreover, as we pointed out, firms' income is decreasing and so are its direct taxes.
With an increase of 3.06 per cent in the government's spending for both fiscal packages in 2021, and a decrease in its income, the government's deficit is widening. The greater the severity of the scenario, the greater the magnitude of the drop. This drop in government savings has a crowding out effect on private investment which explains why the economy does not go back to its BAU levels in the long run as observed earlier.
Overall, the results show that the impact of the greener fiscal package on GDP is similar compared to the neutral investment policy, shown in table 2, and relatively better in terms of lower CO2 emissions, unemployment and poverty. While this is a promising outcome, it is important to point out that the model analysis does not consider all possible future developments. Thus, interpreting these results requires consideration of the possibility that future development could also include a stronger rebound by economic activities which will increase future emission and pollution levels likely to be higher than the BAU (Helm, 2020; Le Quéré et al., Reference Laborde, Martin, Swinnen and Vos2020; Sarkodie and Owusu, Reference Ratha, De, Kim, Plaza, Seshan and Yameogo2020). The significance of the results in this paper is that they lend some empirical credence to emphasising climate and environmentally-friendly policies as part of an integrated government response to mitigate and recover from the economic effects of the COVID-19 pandemic.
5. Conclusion
This study uses a recursive dynamic CGE model for South Africa to evaluate the effects of the COVID-19 pandemic and counteract government policies on the economy and the environment. The model is operationalised using a SAM coupled with a greenhouse gas balance and emissions data disaggregated according to the sectors represented in the model. We find that while the economy is harshly impacted, the fiscal support package ameliorates and cushions the negative effects on households. An adaptation of the fiscal package is made in this paper to target three specific sectors (water, electricity and construction) to see whether a ‘greener’ policy could be an alternative to a neutral fiscal plan. Environmental indicators improve in the short run due to the economic slowdown and the improvement persists at least to 2030. These results can be used as decision support for policy makers on how to orient the post COVID-19 policies to be pro-poor and pro-environment. While greening policies would still be required in order to reach environmental targets as defined by the South African Department of Environmental Affairs, the slowdown in emissions induced by COVID-19 presents a unique opportunity to consolidate the environmental gains by using the fiscal support package to cushion poor households. Thus, this starting point to reduce environmental impacts could represent a motivation to ‘seize the moment’ and to consider the design and implementation of further environmental policies additionally or as a follow up to the COVID-19 fiscal package.
Caution about the extent of the results obtained in this paper, as with any modelling exercise, needs to be exercised. Indeed, on the one hand, though we have implemented mild and severe scenarios, it is still very difficult to have precise data on the magnitude of the shocks, and consequently assumptions about the magnitude of the shocks have to be made at this stage. Secondly, we do not know with any precision how the situation will evolve, for both South Africa and the rest of the world. Here again, choices had to be made about how to model how the economy returns to normality. Finally, the tool we use does not allow us to model the full range of all the green policies available, so it is necessary to keep in mind, when reading the results, that what has been modelled is a partial fiscal response by government.