


Takotsubo syndrome is an acute and potentially reversible cause of left ventricular dysfunction. Reference Dias, Núñez Gil and Santoro1 It clinically mimics an acute coronary syndrome with sudden myocardial damage, myocardial stunning, and acute cardiac dysfunction, classically occurring in association with a stress-related catecholamine surge. Reference Dias, Núñez Gil and Santoro1 Sympathomimetic drugs, including norepinephrine, epinephrine, and dobutamine, have been associated with Takotsubo syndrome onset. Reference Dias, Núñez Gil and Santoro1
Dobutamine stress echocardiography can be utilised to assess for coronary artery vasculopathy after heart transplant, with high specificity in adult patients. Reference Elkaryoni, Abu-Sheasha, Altibi, Hassan, Ellakany and Nanda2 Experience in children remains limited. Herein, we describe the first case of dobutamine-induced Takotsubo syndrome in a paediatric patient.
Case presentation
We present a 14-year-old African American male with a history of pulmonary artery atresia with intact ventricular septum and right-ventricular-dependent coronary circulation, palliated via bidirectional cavopulmonary anastomosis and Fontan completion at 3 years of age. He developed medically refractory protein-losing enteropathy and underwent orthotopic heart transplantation at 11 years of age. The donor was a similar-aged male who suffered an out-of-hospital cardiac arrest due to a respiratory cause.
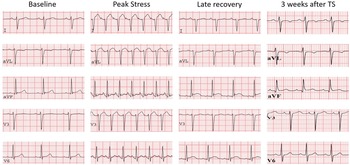
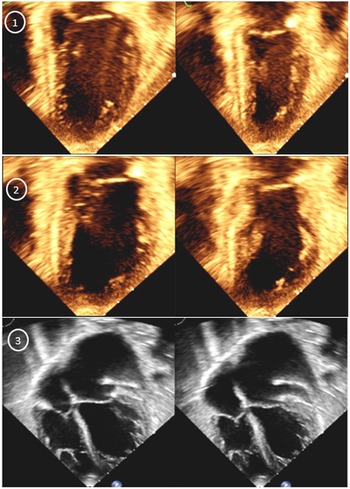
For his second annual evaluation (24 months post-transplant), he was on no cardiac medications, and immunosuppression was monotherapy with sirolimus. Baseline transthoracic echocardiography showed a normal left ventricular size (left ventricular end-diastolic diameter 45 mm (z-score = 0.8); left ventricular end-systolic diameter 28 mm (z-score = 0.1)) with ejection fraction of 61% by M-mode, trivial mitral valve regurgitation, and borderline right ventricular size with normal systolic function. Cardiac catheterisation was performed with normal coronary angiography (International Society of Heart and Lung Transplantation Coronary Artery Vasculopathy grade 0), normal cardiac output via Fick estimate, and left ventricular end-diastolic pressure of 11 mmHg. Endomyocardial biopsy was performed, ultimately demonstrating no evidence for antibody- or cell-mediated rejection. He then proceeded to dobutamine stress echocardiography according to an institutional research protocol, recently published by Fine et al. Reference Fine, Greenway and Mulvagh3 Resting electrocardiogram and echocardiogram were normal. Dobutamine was titrated according to protocol, Reference Fine, Greenway and Mulvagh3 starting at a dose of 5 μg/kg/minute, followed by 3-minute stages of increasing doses of 10, 20, and 30 to a maximal dose of 40 μg/kg/minute, to achieve 75% of the age-predicted maximal target heart rate, calculated as 220 minus age in years. Atropine (2 mg) was used to achieve target heart rate. Maximal achieved peak heart rate was 162 beats per minute. At peak stress (40 mcg/kg/minute), ventricular ectopy developed, and dobutamine was immediately discontinued. This was followed by >1 mm ST-segment elevation in anterolateral leads, and ST-segment elevation in inferolateral leads at late recovery (Figure 1). Echocardiography demonstrated left ventricular mid-ventricular hypokinesis and apical akinesis at peak stress, with increased end-systolic volume and acute reduction in the ejection fraction to 35%. At late recovery, left ventricular end-systolic volume further increased, with ejection fraction decreasing to 25% with progression to left ventricular apical and mid-ventricular akinesis (Figure 2; Supplementary Video S1). Emergent catheterisation was performed with coronary angiography demonstrating no coronary artery dissection, vasospasm, or occlusion. Left ventricular end-diastolic pressure was now severely elevated at 28 mmHg with no outflow tract obstruction.
Electrocardiographic abnormalities progression in leads I, aVF, V1, V3 and V6. ECG was normal at baseline. At peak stress, there is ST-segment elevation in leads I, aVL and V3, followed by ST-segment elevation in aVF and V6 at late recovery. Note that corrected QT-segment was normal throughout the study (411 msec at peak stress and 423 msec at late recovery). At 3 weeks after DSE, there is only T-wave inversion in lead I and aVL.

Images were obtained from the apical 4-chamber view at end-diastole (left) and end-systole (right). Note progressive decrease in left ventricular ejection fraction and increase in end-systolic volumes from baseline (1) to peak stress (2) and late recovery (3).

The patient was admitted to the paediatric ICU with mild shortness of breath and bilateral rales on exam. Oxygen saturation was 96%, while on nasal cannula at 2 L/minutes. Chest x-ray was concerning for pulmonary oedema, and echocardiogram 6 hours after dobutamine stress echocardiography showed normal left ventricular size (left ventricular end-diastolic diameter 43 mm (z-score = 0)) with reduced systolic function (left ventricular end-systolic diameter 34mm (z-score = 2.9); ejection fraction of 37% by M-mode (35% by Simpson’s monoplane method), mild mitral valve regurgitation, normal right ventricular size with moderately decrease systolic function, and no pericardial effusion. Troponin-T levels peaked to 610 ng/L (normal ≤15 ng/L) 6 hours after dobutamine stress echocardiography. Given concern for dobutamine-induced Takotsubo syndrome, inotropes were avoided, and the patient was managed conservatively for acute systolic/diastolic heart failure with intermittent intravenous furosemide (1 mg/kg/dose) and nasal continuous positive airway pressure.
Over the ensuing 24 hours, Troponin-T levels decreased to 96 ng/L, chest x-ray findings nearly resolved after one dose of Furosemide, and positive pressure was discontinued. Repeat echocardiogram in the following day demonstrated a normal left ventricular size (left ventricular end-diastolic diameter 43 mm (z-score = 0; left ventricular end-systolic diameter 30 mm (z-score = 1.0)), ejection fraction of 51% (M-mode), dyskinetic left ventricular inferior wall, and significantly improved right ventricular systolic function. The patient was discharged on his home medication regimen 2 days after dobutamine stress echocardiography. Echocardiogram normalised 6 days later, and electrocardiogram 3 weeks after dobutamine stress echocardiography documented regression of ST-segment elevation and T-wave inversion in anterolateral leads (Figure 1).
Discussion
We report the first dobutamine-induced Takotsubo syndrome in a paediatric patient, and the first occurring in a paediatric heart transplant patient. In the paediatric population, Takotsubo syndrome is extremely rare, Reference Urbinati, Pellicori, Guerra, Capucci and Clark4 traditionally presenting with loss of consciousness, nausea/vomiting, and/or heart failure. It is usually observed in children with underlying neurological or psychiatric conditions, such as intracranial bleeding or brain cancer. Reference Urbinati, Pellicori, Guerra, Capucci and Clark4
Takotsubo syndrome classically presents in postmenopausal women after an emotional/physical trigger. Reference Dias, Núñez Gil and Santoro1 Its typical form (70–85% of cases) includes left ventricular apical ballooning with mid-ventricular dys/akinesis and basal hypercontractility. Reference Dias, Núñez Gil and Santoro1 Atypical forms sparing the left ventricular apex are less frequent. Reference Dias, Núñez Gil and Santoro1 Right ventricular involvement is common but clinically evident in about a third of cases. Reference Dias, Núñez Gil and Santoro1 Classic electrocardiographic changes include ST-segment elevation, followed by diffuse ST-segment inversion and QT prolongation. Reference Dias, Núñez Gil and Santoro5 In children, atypical forms with basal wall motion abnormalities are more frequent (46%), and left ventricle is globally affected in over 20% of cases. Reference Urbinati, Pellicori, Guerra, Capucci and Clark4 In our case, myocardial involvement was typical, starting at peak stress and worsening into late recovery.
Inotropic support with milrinone and dobutamine was undertaken in over 50% of reported paediatric Takotsubo syndrome cases. Reference Urbinati, Pellicori, Guerra, Capucci and Clark4 Conversely, inotropic support was avoided in our case to limit continuous sympathetic activation. Dias et al Reference Dias, Núñez Gil and Santoro5 recommended weaning inotropic support in Takotsubo syndrome patients without cardiogenic shock; and in case of cardiogenic shock and/or severe biventricular dysfunction, levosimendan, β-blockers, or mechanical support should be implemented. Reference Dias, Núñez Gil and Santoro5
It is important to mention that post-transplant coronary microvasculopathy should also be considered as a differential diagnosis in this setting of acute cardiac dysfunction in a heart transplant recipient. Reference Hiemann, Wellnhofer and Knosalla6 However, the temporal association of cardiac dysfunction onset with dobutamine infusion, its echocardiographic expression with apical involvement, and clinical improvement with conservative measurements support Takotsubo as the diagnosis in this case.
Cardiac denervation and Takotsubo syndrome
Takotsubo syndrome has been reported in adults after heart transplantation, Reference Behnes, Baumann, Borggrefe and Haghi7,Reference Gastwirth, Yang, Steidley, Scott and Chandrasekaran8 including one case secondary to dobutamine stress echocardiography, Reference Chinali, Formigari and Grutter9 raising concern that the lack of parasympathetic innervation post-transplant can result in an exaggerated response to catecholamines. Heart transplantation surgically denervates the heart, interrupting vagal neurons and post-ganglionic sympathetic nerves. Reference Awad, Czer and Hou10 Cardiac reinnervation is variable, with sympathetic reinnervation beginning 6–12 months and parasympathetic reinnervation beginning 1–3 years after transplant. Reference Awad, Czer and Hou10 Hence, these observations support how dobutamine-induced Takotsubo syndrome in heart transplant patients could be facilitated by the absence of inhibitory parasympathetic afferents within 2 years post-transplant.
Conclusion
Cardiac denervation and possible reinnervation cannot be dismissed when analysing dobutamine-induced Takotsubo syndrome after heart transplantation. We highlight the need to identify Takotsubo syndrome and avoid inotropes in the context of acute myocardial dysfunction with concerning features of Takotsubo syndrome. Identification of this condition requires knowledge of a disease process rarely encountered in children. Further research is warranted to continue the search for safe and accurate alternatives to coronary angiography when assessing for post-transplant coronary vasculopathy.
Supplementary material
To view supplementary material for this article, please visit https://doi.org/10.1017/S1047951122002311
Acknowledgements
None.
Financial support
This research received no specific grant from any funding agency, commercial, or not-for-profit sectors.
Conflicts of interest
None.
Ethical standards
Not applicable.