I. INTRODUCTION
MgCuZn ferrite is one of the important magnetic materials for many high frequency applications. This is because of its better properties at high frequencies such as high resistivity, high Curie temperature, environmental stability, low cost, and lower densification temperature than that of NiCuZn ferrites. Reference Murthy1–Reference Rezlescu, Rezlescu, Popa, Craus and Rezlescu3 In high frequency applications for Mg-based polycrystalline ferrites, porosity and resistivity are the main problems. These problems can be solved by the addition of additives. The proper selection of additives will also promote low-temperature sintering. The most commonly used additives are the low melting compounds such as CaO, Na2O, ZrO2, PbO, Ta2O5, V2O5 etc. Reference Hsu, Ko, Shen and Chen4–Reference Hsu, Ko and Chen6 In the present investigation, the additive chosen is Ta2O5.
Ta2O5 has been studied intensively as capacitor materials due to its high dielectric constant and a high degree of compatibility with microelectronics manufacturing. It is considered as a promising dielectric material for the next generation of high density dynamic random access memories (DRAMs). Reference Kwon, Park, Han, Kim, Ahn and Lee7–Reference Salam, Konish, Mizuno, Fukuda and Nomura10 It is also observed that the addition of Ta2O5 gives the fine grained microstructure. Reference Zdinarsic, Limpel and Drofenik11 Keeping these points in view, we have undertaken a study of the effect of Ta2O5 on electrical, dielectric, and magnetic properties of MgCuZn ferrites.
II. EXPERIMENTAL METHOD
Pure (99.99%) chemicals of magnesium nitrate [Mg(NO3)2·6H2O], copper nitrate [Cu(NO3)2·3H2O], zinc nitrate [Zn(NO3)2·6H2O], iron nitrate [Fe(NO3)2·9H2O], and tantalum (V) ethylate (C10H25O5Ta) were dissolved in 50 mL of deionized water. The molar ratio of powders was adjusted to obtain composition Mg0.2Cu0.3Zn0.5Fe2O4. The nonmagnetic ions of Ta2O5 are added separately in the range of 0.2, 0.4, and 0.6 wt%.
An aqueous NaOH solution was added to the prepared solution until the desired pH (∼9.12) value was obtained. The mixture was then treated with Teflon-lined vessel using a microwave digestion system, which uses 2.45 GHz microwaves and can operate at 0–100% full power (630 ± 50 W). The system is controlled by pressure and can attain maximum pressure of 200 psi, which is equivalent to 194 °C, based on steam tables. In the present investigation, all the samples were synthesized at 160 °C. The reaction vessel is connected to a pressure transducer that monitors and controls the pressure during synthesis. The time, pressure, and power were computer controlled. The products obtained were filtered, and then washed repeatedly with deionized water, followed by freeze-drying overnight. The prepared powders were weighed and the percentage yields were calculated from the expected total amount based on the solution concentration and volume and the amount that was actually crystallized.
All the synthesized powders were characterized using x-ray diffraction (XRD), their particle size and morphology were determined using transmission electron microscopy (TEM; Model JEM-2010, JEOL Ltd., Tokyo, Japan). The surface area of ferrite samples was measured via multipoint BET nitrogen absorption method. In the present investigation, ferrites with high surface ∼92 cm2 were synthesized.
The obtained ferrite powders were mixed with 2 wt% polyvinyl alcohol as a binder and uniaxially pressed at a pressure of 1500 kg/cm2 to form pellet and toroidal shape specimens. The prepared samples were divided into two batches: one batch of samples were conventionally sintered at 900 °C/4 h in air atmosphere and the another batch of samples were microwave sintered at 900 °C/30 min. For convenience, the conventionally sintered samples were called as pure Mg0.2Cu0.3Zn0.5Fe2O4 (CS 1), 0.2 wt% Ta2O5 added Mg0.2Cu0.3Zn0.5Fe2O4 (CS 2), 0.4 wt% Ta2O5 added Mg0.2Cu0.3Zn0.5Fe2O4 (CS 3), 0.6 wt% Ta2O5 added Mg0.2Cu0.3Zn0.5Fe2O4 (CS 4). The microwave sintered samples were named as pure Mg0.2Cu0.3Zn0.5Fe2O4 (MW 1), 0.2 wt% Ta2O5 added Mg0.2Cu0.3Zn0.5Fe2O4 (MW 2), 0.4 wt% Ta2O5 added Mg0.2Cu0.3Zn0.5Fe2O4 (MW 3), 0.6 wt% Ta2O5 added Mg0.2Cu0.3Zn0.5Fe2O4 (MW 4).
All the Ta2O5 added MgCuZn ferrites sintered conventionally at 900 °C/4 h in air atmosphere and the samples microwave sintered at 900 °C/30 min were characterized by the XRD patterns and SEM images were recorded on a Philips SEM/EDAX, XL-30 (Holland). The d.c. resistivity and temperature variation of permeability of conventional and microwave sintered Ta2O5 added MgCuZn ferrite samples have been measured in the temperature range of 25–400 °C. The measurement of complex permittivity and complex permeability spectra has been carried out in two steps: (i) for low frequency from 10 kHz to 1 MHz, an LCR meter, Zentech-3305 (Taipei Taiwan) (ii) the other frequency from 1 MHz to 1.8 GHz, Agilent 4291B impedance/material analyzer (Santa Clara, CA) was used.
III. RESULTS AND DISCUSSION
All the synthesized Ta2O5 added MgCuZn ferrite powders were identified as a single phase of spinel MgCuZn ferrites. TEM analysis revealed that nanophase ferrites ∼10–20 nm in size could be synthesized at 160 °C. These nanophase ferrites exhibited more or less spherical morphology and uniform size. Reference Krishnaveni, Murthy, Gao, Lu and Komarneni12
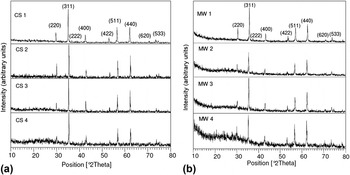
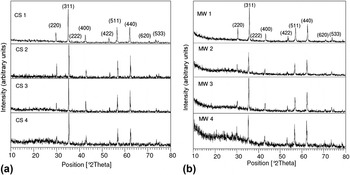
The XRD patterns of conventional and microwave sintered Ta2O5 added MgCuZn ferrite samples are presented in Figs. 1(a) and 1(b). XRD patterns show that all the samples have spinel phase, showing the absence of any other impurity phase. The line widths observed in the XRD pattern are smaller than that of the line widths of the corresponding nanopowders. The existence of cubic spinel in the synthesized powders may be associated with the synthesis process.
(a) XRD patterns of conventionally sintered Ta2O5 added MgCuZn ferrites. (b) XRD patterns of microwave sintered Ta2O5 added MgCuZn ferrites.
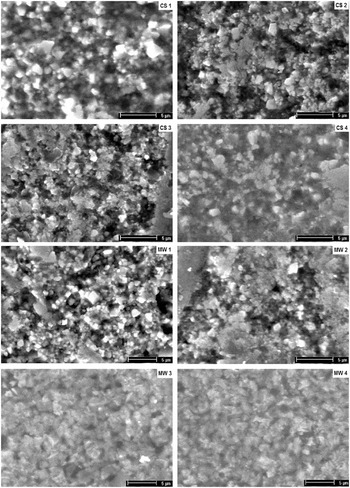
SEM images recorded for the present samples are shown in Fig. 2. It can be seen from the figures that with an addition of Ta2O5 small and faceted shape particles are formed. With an addition of Ta2O5, the microstructure of the ferrite has become finer and the particle size is smaller than the pure (no additive) sample. There is a small variation in the case of conventional sintered samples and microwave sintered samples, the microwave sintered samples exhibit fine and uniform microstructures due to the small soaking times, i.e., 30 min.
SEM images of Ta2O5 added MgCuZn ferrites.
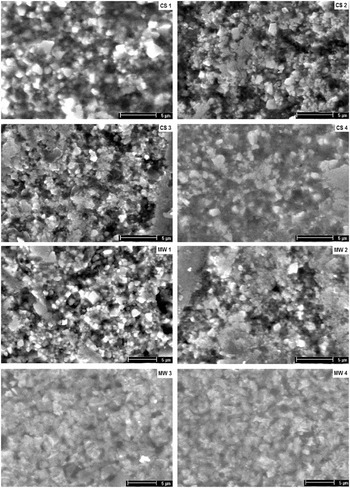
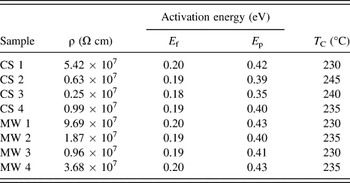
Table I gives the d.c. electrical resistivity (ρ) values for the presently investigated, conventional and microwave sintered Ta2O5 added MgCuZn ferrites at room temperature of 25 °C. It can be seen from the table that with an addition of Ta2O5 to MgCuZn ferrites, resistivity decreases without grain growth. According to the mechanism proposed by Yamamoto et al., Reference Yamamoto, Makino and Nikaidou13 the decrease in ‘ρ’ in the Ta-doped ferrites can be related to the creation of the cation vacancies to maintain the electrical neutrality. These vacancies lead to the increase of electrons as a result of dissociation of oxygen in the vicinity of cation vacancies.
Data of d.c. resistivity for Ta2O5 added MgCuZn ferrites.
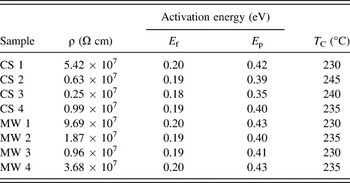
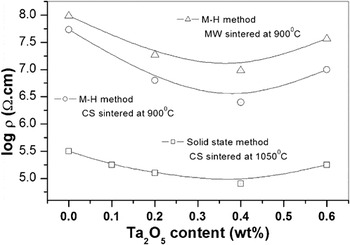
Figure 3 shows the plot for ρ versus Ta2O5 concentration in MgCuZn ferrite. In the same figure, we have plotted the resistivities of present ferrite systems (conventional and microwave sintered samples) that were compared with the ferrite samples one prepared using conventional solid state sintering method. Reference Rezlescu, Sachelarie, Rezlescu and Popa5 It can be observed from the figure that the resistivity of the presently investigated ferrites possesses higher values by two orders of magnitude than that of samples prepared by conventional solid state method. Comparatively higher values of ρ were observed in the case of microwave sintering method only. This is due to the formation of finer grains that provide a large grain boundary area in the microwave sintered ferrites.
Variation of log ρ with an addition of Ta2O5 to MgCuZn ferrites.
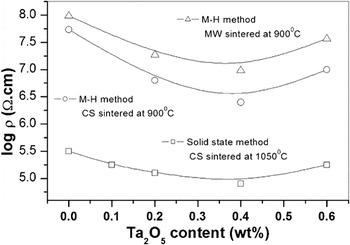
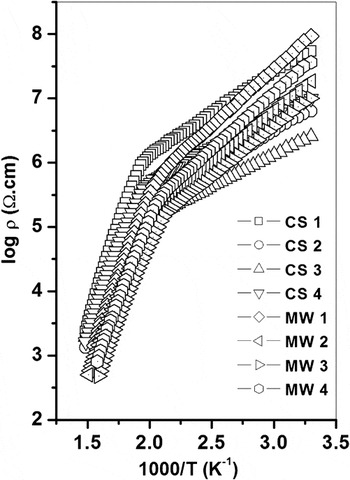
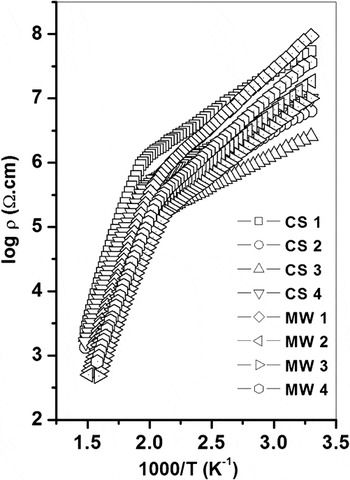
Figure 4 shows the temperature (T) dependence of ‘ρ’ for all the conventional sintered MgCuZn ferrites under investigation. It can be seen from the figure that for all ferrites the value of ρ decreases with an increase in temperature, T. This could be attributed to the increase in the drift mobility of electric charge which is thermally activated on increasing the temperature. In fact, this decrease in ρ due to temperature increase is the normal behavior of semiconductors which is controlled by the Arrhenius relation: ρ = ρ0 exp[E/kT], where ρ0 is the pre-exponential constant of resistivity at infinitely high temperatures and k is the Boltzmann constant. Figure 4 shows a straight line for each composition, the line was broken at the Curie temperature T C as expected theoretically. Reference Naik and Power14–Reference Reddy, Pratap and Rao17 This is the Curie temperature T C above which the ferrimagnetic materials will transform to paramagnetic. The activation energy for electric conduction in the ferrimagnetic E f and paramagnetic E p regions was calculated from the slopes of broken lines on both sides of the Curie temperature.
Temperature dependence of log ρ for Ta2O5 added MgCuZn ferrites.
The composition dependence of the activation energies for the electrical conduction in the paramagnetic and ferrimagnetic regions (E p and E f) and Curie temperature T C are presented in Table I. The activation energy for electric conduction in the paramagnetic region E p was found to be higher than that of the ferrimagnetic region E f. This could be attributed to the disordered states of the paramagnetic region and ordered states of the ferrimagnetic region. The activation energies of electric conduction were found to decrease with an addition of Ta2O5 to MgCuZn ferrite.
Figure 4 also shows the variance of log ρ as a function of reciprocal temperature (T) for the microwave sintered samples under investigation. It can be seen from the figure that the values of ρ for all the samples under investigation decrease with an increase in temperature and show a change in slope at a certain temperature T 1 (230–240 °C) as observed in the case of conventional sintered samples. This temperature T 1 value is also in good agreement with the Curie temperature (T C) of the corresponding sample showing that the kink in each case has occurred at the Curie point.
It can be seen from the figure that the ρ decreased by about four orders of magnitude in the investigated temperature range. This sharp decrease in ρ with temperature is mainly due to the thermally activated mobility of the charge carriers, but not due to the thermally activated creation of these carriers as described by Rezlescu et al. Reference Rezlescu, Sachelarie, Rezlescu and Popa5 The activation energies in the ferrimagnetic and paramagnetic regions are calculated from the plots of ρ versus 103/T and are presented in Table I for microwave sintered samples. It can be seen from the table that the activation energy in the paramagnetic region is higher than that in the ferrimagnetic region. It may also be noted that the activation energy varies from 0.19 to 0.43 eV and high activation energy goes hand in hand with low conductivity of the ferrites. The small value of activation energies for the present ferrites confirms the electronic character of the conduction process that consists in the hopping of electrons between Fe2+ and Fe3+ ions, statistically situated on octahedral spinel sites. Reference Islam, Ahmad, Abbas and Chaudhry18–Reference Kishiro, Inoue, Chen and Yoshimaru22
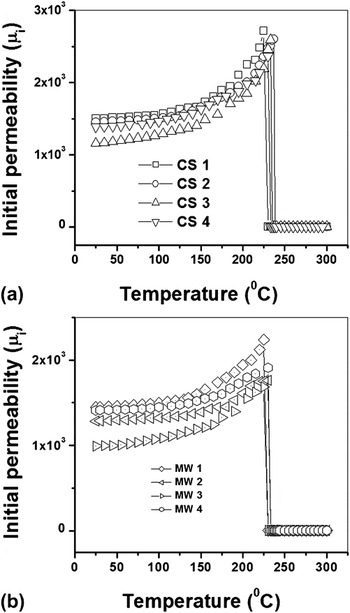
Thermal variation of initial permeability (μi) for all the conventional and microwave sintered Ta2O5 added MgCuZn ferrites under investigation has been measured and obtained results are shown in Fig. 5. It can be seen from the figure that the value of μi for all the ferrites under investigation is generally increasing with increasing temperature (T) and suddenly drops to a small value ∼2 at certain temperatures.
Temperature dependence of initial permeability for MgCuZn ferrites.
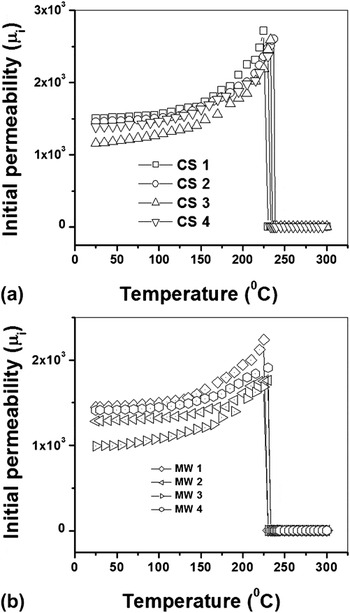
It is well known that for the ferrimagnetic materials, the initial permeability drops to a small value at a temperature called Curie temperature. After this temperature, the ferrimagnetic sample becomes paramagnetic sample. No hysteresis has been observed for the presently investigated samples in cooling from high temperature. Thus, for the presently investigated ferrites, the Curie temperature (T C) is taken at a temperature where μi drops to a small value. For the present ferrites, the values of T C are in between 230 and 237 °C.
It is clear from the figure that the temperature dependence of permeability is also influenced by an addition of Ta2O5. For an addition of 0.2 wt%, the T C is slightly improved than the pure sample and for further addition of Ta2O5, T C slightly decreased. Permeability increases continuously by increasing the temperature and shows a maximum at the T C. The increase in permeability in ferrite with temperature can be related to the difference between the variation of saturation magnetization and magnetic anisotropy. The decrease in magnetic anisotropy is larger than that of saturation magnetization near T C, hence the permeability increases with increasing temperature up to the T C and has a maximum. Reference Bhosale, Choudari, Sawant and Bakare23 The µi–T curves do not show any secondary maxima, which occur due to excess formation of Fe2+ ions, thereby indicating the single-phase formation of the samples. Good temperature dependence of the permeability is also exhibited by the microwave sintered Ta2O5 added MgCuZn ferrites. The variation of μi with temperature can be explained using the similar results in the case of conventional sintered Ta2O5 added MgCuZn ferrites.
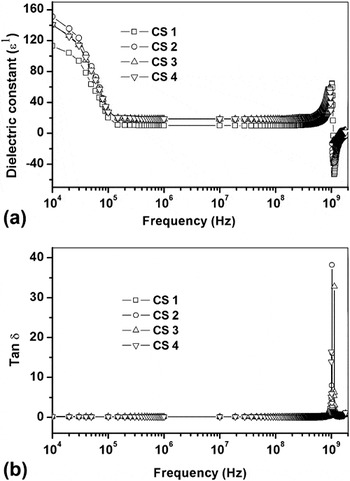
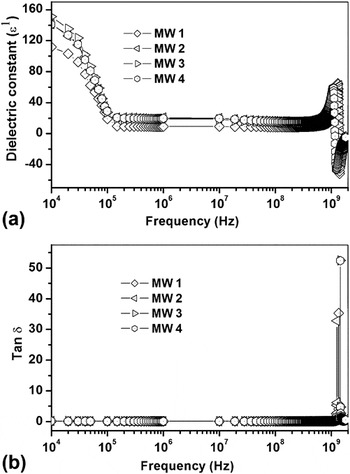
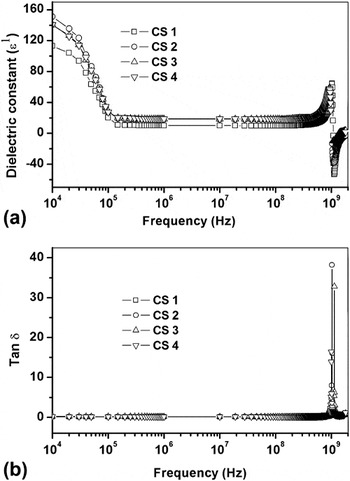
Figures 6(a) and 6(b) and Figs. 7(a) and 7(b) show the frequency variation of dielectric constant (ε′) and dielectric loss (tan δ) for conventional and microwave sintered Ta2O5 added MgCuZn ferrites at room temperature. From the figure it can be seen that all the ferrites show dielectric dispersion. The value of ε′ and tan δ decreases from 10 to 100 kHz and almost remains constant up to 300 MHz and increases by further increasing the frequency up to 1 GHz.
(a) Dielectric constant and (b) tan δ for conventionally sintered samples.
(a) Dielectric constant and (b) tan δ for microwave sintered samples.
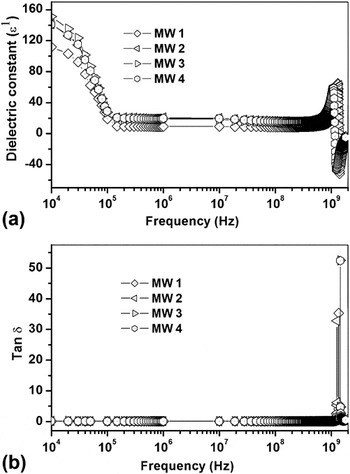
It can be seen from Fig. 6(a) that in the presently investigated ferrites the value of ε′ decreases from ∼150 to ∼18 for the 0.6 wt% Ta2O5 added MgCuZn ferrite (CS 4) with an increase in frequency from 10 to 100 kHz and almost remains constant at a value ∼18 upto 300 MHz. With further increase in frequency, the value of ε′ also increases and reaches to a value ∼60 at about 1 GHz. A similar behavior is observed in all ferrites under investigation. It is also observed that at a particular frequency the value of ε′ increases with an addition of Ta2O5 to MgCuZn ferrite. The variation of ε′ in Ta-doped ferrites can be related to the creation of the cation vacancies to maintain the electrical neutrality. These vacancies lead to increase the number of electrons, as a result, dissociation of oxygen takes place in the vicinity of cation vacancies. It causes reduction of resistivity and leads to high polarization. Reference Liu, Chang, Chen, Chen, Lee and Liaw24 The dielectric constant in the case of microwave sintered samples is lower than that of conventional sintered samples. This is due to the formation of small grains that provide large grain boundary area.
The dielectric constant of any material, in general, is due to dipolar, electronic, ionic, and interfacial polarizations. At low frequencies, dipolar and interfacial polarizations are known to play the most important role. Reference Zaima, Furuta and Yasuda25 The decrease in dielectric constant with frequency can be explained on the basis of electron hopping conduction. In MgCuZn ferrite, the B sites are occupied by Mg, Fe, and Cu ions. Mg ions have a stable valence of +2, whereas Fe and Cu ions have variable valences, +3/+2 for Fe and +1/+2 for Cu. The multiple valence ions can facilitate electron hopping on the B sites. Reference Nakamura26 In ferrites, it is well known that the samples consist of well-conducting grains separated by poorly conducting grain boundaries. Reference Koops27 The electrons reach the grain boundary through hopping and if the resistance of the grain boundary is high enough, electrons pile up at the grain boundaries and produce polarization. Koops explained this by considering the heterogeneous structure of polycrystalline ferrites as equivalent to a series-parallel combination of resistors and capacitors.
However, as the frequency of the applied field increases, the electrons reverse their direction of motion more often. This decreases the probability of electrons reaching the grain boundary and as a result the polarization decreases. Therefore, the dielectric constant decreases with increasing frequency of the applied field. Ultimately, as the field frequency increases, the dipoles will barely have started to move before the field reverses, and try to move the other way. At this stage, the field is producing virtually no polarization of the dielectric. This process is generally called relaxation and the frequency beyond which the polarization no longer follows the field. Relaxation arises from the inertia of the system of charges and restoring force acting on the charges which oppose the force due to the applied electric field. Thus, these systems combine inertia and restoring force, whereby resonance is possible rather than relaxation. Resonance causes an increase in the displacements of the charges so that the alternating polarization, and therefore the permittivity at first rise in value. As the applied field frequency rises above the resonant frequency, it passes through an antiphase condition, where it opposes the vibrations of the charges, and the polarization falls to a very low value. Finally, as the frequency is raised still further, complete relaxation occurs and the polarization resumes a steady value in which the particular mechanism is no longer operative. This process gives the characteristic resonance shape to the permittivity curves for ionic and electronic polarization mechanisms. Reference Bhosale, Choudari, Sawant and Bakare23
Dielectric loss (tan δ) for the Ta2O5 added MgCuZn ferrites is in the order of 0.05–0.17 at 100 kHz. The dielectric losses in ferrites are generally reflected in the resistivity, materials with low resistivity exhibiting high dielectric loss and vice versa. For conventionally sintered sample CS 4, the value of tan δ decreases from 0.23 to 0.17 with an increase in frequency from 10 kHz to 100 kHz and almost remains constant at a value ∼0.17 upto a frequency of 70 MHz. With further increase in frequency, the value of tan δ increases to a value of 1 at about a frequency of 1 GHz. A similar behavior has been observed for all other ferrites under investigation. The frequency variation of tan δ can be explained on the basis of Koop's model. Reference Koops27 The resonance peak around 1 GHz can be explained as when the hopping frequency of electrons is equal to the applied field frequency, maximum electrical energy is transferred to the oscillating ions and power loss shoots up, thereby resulting in resonance.
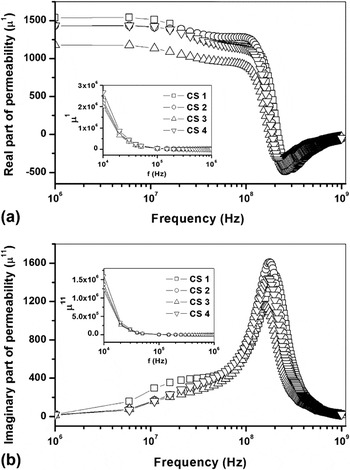
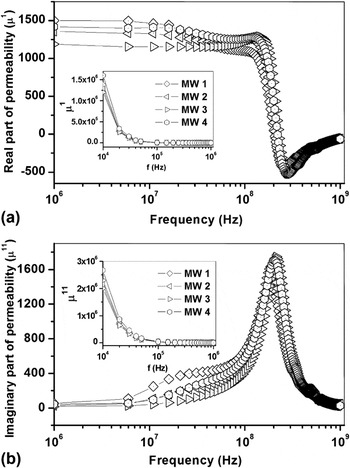
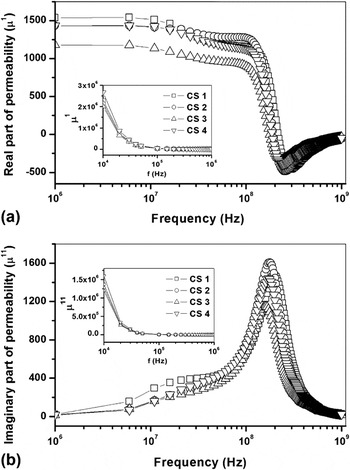
Figures 8(a) and 8(b) and Figs. 9(a) and 9(b) show the complex permeability spectra for conventional and microwave sintered Ta2O5 added MgCuZn ferrites in the frequency range from 10 kHz to 1 MHz and from 1 MHz to 1 GHz respectively, at room temperature. It can be seen from the figures that the permeability of the present ferrites is influenced by the addition of Ta2O5. With an addition of Ta2O5, real part of permeability of the ferrites decreased than the pure samples. In the case of conventionally sintered samples, for an addition of 0.2 wt% of Ta2O5, permeability decreased from 1655 to 1521; for 0.4 wt% of Ta2O5, it decreased to 1179; and for 0.6 wt% of Ta2O5, it increased to 1433. These changes in the permeability are attributed to the variation of grain size.
Complex permeability spectra of conventionally sintered samples.
Complex permeability spectra of microwave sintered samples.
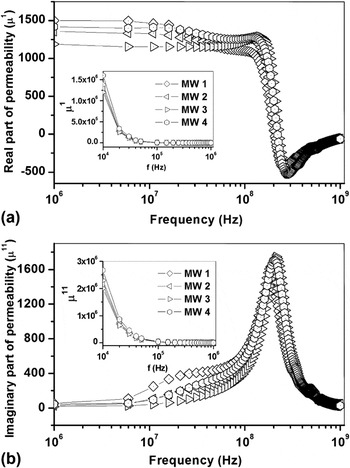
The value of the real part of permeability (µ′) for present ferrites is more than 1000 in the frequency range of 10 kHz to 50 MHz. Then the values of permeability are found to decrease with an increase in frequency up to 180 MHz. Finally, frequency dispersion occurred at 200 MHz. But it can be noticed that the resonance frequencies are shifted slightly toward higher frequencies. These changes in the permeability are attributed to the variation of grain size. The imaginary part of permeability (μ″) for the present ferrites is found to decrease with an increase in frequency up to 4 MHz; above this frequency μ″ increases with frequency and shows a peak around 200 MHz. This type of behavior is generally observed in the case of many ferrites due to the domain wall motion. Reference Snoek28,Reference Rado29
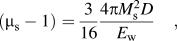
The magnetic spectra, i.e., complex permeability variation with frequency in ferrites are explained with the help of two types of magnetizing mechanisms. Reference Nakamura26 They are (i) the spin rotational magnetization and (ii) domain wall motion. To account for the first mechanism, Globus Reference Globus30 have developed a model in which a single 180° Bloch wall is pinned circularly at the grain boundary, collinearly with the applied field. Under the action of the low energy alternating field, the wall reversibly bulges; the static susceptibility (μs − 1) and the relaxation frequency f r corresponding to the maximum of the imaginary part of the complex permeability μ′′ are then given by Eqs. (1) and (2), respectively.
 $$\left( {\mu _{\rm{s}} - 1} \right) = {3 \over {16}}{{4\pi M_{\rm{s}}^2 D} \over {E_{\rm{w}} }}\quad {\rm{,}}$$
and
 $${f_{\rm{r}}} = {{16{E_{\rm{w}}}} \over {\pi \beta {D^2}}}\quad {\rm{,}}$$
where E w is the wall energy, β the damping coefficient, M s the saturation magnetization, and D the grain diameter.
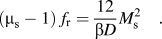 $$\left( {{\mu _{\rm{s}}} - 1} \right)\;{f_{\rm{r}}} = {{12} \over {\beta D}}M_{\rm{s}}^2\quad {\rm{.}}$$
According to this model, the relaxation frequency, the static permeability, and their product are microstructure dependent. Large grain size leads to high permeability and low relaxation frequency. The smaller the grain size, the higher the (μs − 1) f r product up to a critical size for which the grains become monodomain.
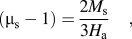
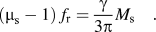
On the contrary, Snoek's model Reference Snoek28 assumes that the permeability is only related to spin rotations. The magnetic anisotropy is assumed to be uniaxial and demagnetizing effects are neglected. In this model, the static permeability (μs − 1) and the resonance frequency f r are given by Eqs. (4) and (5), respectively.
 $$\left( {{\mu _{\rm{s}}} - 1} \right) = {{2{M_{\rm{s}}}} \over {3{H_{\rm{a}}}}}\quad {\rm{,}}$$
and
 $${f_{\rm{r}}} = {\gamma \over {2\pi }}{H_{\rm{a}}}\quad {\rm{,}}$$
where γ is the gyromagnetic ratio, H a the anisotropy field, and M s the saturation magnetization; therefore,
 $$\left( {{\mu _{\rm{s}}} - 1} \right)\;{f_{\rm{r}}} = {\gamma \over {3\pi }}{M_{\rm{s}}}\quad {\rm{.}}$$
The (μs − 1) f r product depends only on M s. So, according to this model, grain size is not a relevant parameter for a polycrystalline ferrite.
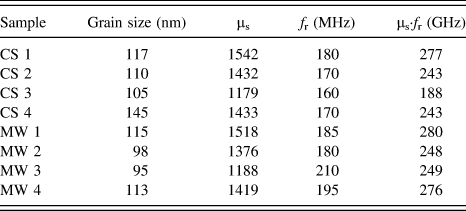
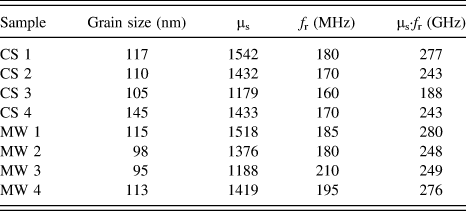
Table II gives the values of static permeability (μs), the relaxation frequency (f r), and μs·f r products for presently investigated samples. These values are obtained using Eqs. (3) and (6) on our data of frequency dependence of complex permeability spectra. We have taken μs = μ′ at 1 MHz because in these ferrites μ′ is practically constant at this frequency. It can be seen from Table II that for a particular composition, the μs·f r product seem to be particle size dependent. This is higher for microwave sintered samples. Moreover, for all the samples, the μs·f r product decreases with an addition of Ta2O5, thus a magnetocrystalline anisotropy increases.
Complex permeability data of Ta2O5 added MgCuZn ferrites.
The magnetic properties of polycrystalline ferrites depend on the counterplay of local magnetic anisotropy energy and ferromagnetic exchange energy. In the case of small grains, the effective anisotropy for the magnetic behavior is an average over several grains and, hence, cut down in magnitude. Reference Herzer31–Reference Tsakaloudi, Kogias and Zaspalis35 These results suggest that small particles lead either to small domain walls, which could have better high frequency properties or to an increase of the rotational part of the permeability. This is achieved by synthesizing polycrystalline ferrites with small grains.
IV. CONCLUSION
An addition of Ta2O5 caused a decrease in resistivity; the decrease in ‘ρ’ in the Ta-doped ferrites can be related to the creation of the cation vacancies to maintain the electrical neutrality. The value of ‘ρ’ is slightly higher in the case of microwave sintered samples than compared to the conventional sintered samples. This is due to its ample grain boundary provided by the fine-microstructure.
Grain size plays a major role in the permeability spectra; the present ferrites exhibited high values of permeability (>1000) in the frequency range of 10 kHz to 50 MHz. The high frequency properties of Ta2O5 added MgCuZn ferrites can be improved by enhancing the spin rotation mechanism to the determinant of domain wall motion mechanisms. This is achieved by using nanocrystalline ferrites.
ACKNOWLEDGMENTS
The author is very much thankful to Professor S.R. Murthy of Osmania University, Dr. Raghava Cherabuddi (Chairman, CVR College of Engineering), and Dr. C. Madhusudana Reddy (Advisor, CVR College of Engineering) for their encouragement.