

Introduction
About two months after an election that was not so close when the vote tally was finished, rioters attacked the institutions that had run it. Encouraged by a defiant election loser whose many appeals to many tribunals had been unsuccessful and incubated in a stew of online conspiracy theories, the rioters attacked symbolic institutions and said they planned to win back what had been stolen from the people. This was Indonesia in early 2019.
Something similar would happen about 18 months later, on January 6th, in the United States. In both countries, violence in the weeks after a bitter election was a coda to what many commentators saw as years of growing polarization. The 2020 and 2016 elections in the US were highly polarizing, and the mobilization of resentments was central to that dynamic (Cramer Reference Cramer2016; Sides, Tesler, and Vavreck Reference Sides, Tesler and Vavreck2019). In Indonesia, similar concerns about polarization were constant even before the violent finale of the 2019 presidential election (Diprose, McRae, and Hadiz Reference Diprose, McRae and Hadiz2019; Mietzner and Muhtadi Reference Mietzner, Muhtadi, Fealy and Ricci2019; Tapsell Reference Tapsell2021). Well-studied in the US, resentment is a useful lens through which to analyze the relationship between political anger and political polarization (Cramer Reference Cramer2020; Kam and Burge Reference Kam and Burge2019).
Resentment is the belief that less-deserving social others are profiting at one's expense (Kinder and Sanders Reference Kinder and Sanders1996). Resentment is conceptually distinct from dissatisfaction with the status quo. Rather than a general sense that the country is headed in the wrong direction or a personal dislike of some political figure, resentment involves a belief that out-groups are receiving symbolic or material benefits that should rightfully have been given to more-deserving in-groups. How does resentment relate to polarization in Indonesia, a country with low partisan identification? Who is resentful? And what can this tell us about possible futures for resentment and political polarization?
To answer these questions, we adapted the US racial resentment framework into four distinct resentment indices, each derived from features of the Indonesian political context. These indices measured different kinds of resentment, some of which were directly mobilized by the 2019 election campaigns, and others of which have historically been important to Indonesian politics but are not today common features of political discourse. The currently mobilized resentments we study are resentment of ethnically Chinese Indonesians (anti-Chinese resentment) and resentment of non-Muslims (religious resentment). The historically mobilized resentments studied are resentment of better-off areas of the country (regional resentment) and resentment of Java (anti-Java resentment). We placed these questions on a nationally representative, face-to-face survey conducted in early 2019, shortly before the national election.
To understand the relationship between resentment and polarization, we measure the relationship between each of the resentment indices and support for Prabowo Subianto, the candidate who most openly mobilized resentments. We find that all four resentments were associated with support for Prabowo, but those most directly mobilized by his campaign were most strongly correlated. We interpret this as evidence that resentment is an important correlate of partisan preference, and therefore can be a basis on which persistent polarization is built.
To understand who holds resentments, we examine a series of demographic covariates that have been proposed by scholars and journalists as causes of the specific resentments we study. We test whether these covariates are associated with the resentments they are purported to explain and whether that association is exclusive to that specific resentment. While we make no claim to causal identification, we demonstrate evidence consistent with the idea that different resentments are mobilized among different people reached in different ways.
Religious resentment is highly concentrated among associates of specific organizations that have been instrumental to the mobilization of religious resentment—and rare outside of this group. This is consistent with scholarship on the role of the hardline Islamist FPI organization specifically in mobilizing resentment (Mietzner, Muhtadi, and Halida Reference Mietzner, Muhtadi and Halida2018). Anti-Chinese resentment is especially common among heavy social media users, even after adjusting for their young average age. This is consistent with research showing that social media is the primary vector for anti-Chinese conspiracy theories (Lim Reference Lim2017; Setijadi Reference Setijadi, Fealy and Ricci2019).
Regional resentment was higher among rural Indonesians. More interestingly, the very lowest levels of regional resentment were concentrated not among urban Indonesians in general, but among residents of district seats—the type of community that most directly benefited from Indonesia's decentralization policies (which were intended to reduce regional resentment). Anti-Java resentment was concentrated among the oldest non-Javanese respondents—the only people old enough to remember the Java versus non-Java conflicts of Indonesia's early independence years.
Age is an important predictor of some resentments, but not others. Having experienced early adulthood at a time when a resentment was mobilized makes a respondent more likely to hold that resentment.
Our results suggest a consistent relationship between resentment and support for Indonesia's political right, which suggests that years of polarized vote returns have their roots in longstanding and perhaps permanent cleavage lines. Our results also suggest that resentments can come and go. Once-fundamental divides, like the bitter conflicts over Java's demographic weight and consequent domination of politics, appear to be in terminal decline. Policy interventions can sometimes ameliorate these resentments. The urban–rural divide in regional resentment is almost entirely accounted for by the very low levels of regional resentment among respondents living in the district seats who benefited from decentralization. Bitter conflicts can leave their mark in the electorate—resentment of Java and regional resentment are declining, but in the age cohorts who experienced early adulthood at the height of these conflicts, greater levels of resentment linger.
The path of no-longer-mobilized resentments suggests that the future of resentment depends on whether mobilization continues and whether institutions push against them. Crackdowns on religious organizations that mobilize religious resentment may have reduced its salience in future elections. But anti-Chinese resentment is not so dependent on specific organizations. Absent a major intervention to reduce it, anti-Chinese resentment is likely to remain a potent part of politics, and to the extent that it is embraced by a political faction, will be a powerful instrument of mobilization.
Party Identification, Polarization, and Resentment in Indonesia: An Overview
Our study focuses on the role of resentment in shaping Indonesians' partisan preferences and considers whether it can contribute to polarization. But viewing Indonesia's voters as polarized or potentially polarized is a break with party-focused scholarship on Indonesian politics. This scholarship emphasizes that few voters identify with specific political parties while parties constantly collude across ideological cleavage lines. In the context of the literature on Indonesian party politics, our contribution is to show how resentments in the electorate can be consistent with voter-level polarization even as partisan identity remains low and party leadership continues to collude. In the broader context of resentment studies, our contribution is to make resentment a portable framework and demonstrate its efficacy outside of its original, high partisan-identification context.
To better explain why resentment is a useful addition to the study of polarization in Indonesia, we first address the literature on ideology and polarization in the country and recent claims that polarization has increased. We then discuss how the scholarship on resentment understands what resentment is and develops its measurements. We then turn to literature on cleavage lines in Indonesia to identify the kernels around which resentment might form.
Prior to the 2014 elections, Indonesia was regarded by many observers as relatively depolarized. This depolarization flowed from a collusive party elite that neutralized ideological differences by incorporating opposition parties into the cabinet and preserving wide access to rents (Aspinall Reference Aspinall2015; Slater Reference Slater2018). Wide collusion complicated efforts to identify ideological throughlines in national politics—while parties' backgrounds had ideological components, their behavior in parliament was most consistent with a patronage logic (Mietzner Reference Mietzner2013). Without clear partisan lines around which to build political identities, polarization in the electorate seemed unlikely to emerge.
Consistent with a lack of political polarization, partisan identity in Indonesia's adult population has consistently dropped since public opinion polling began in 1999. By 2014, only 9 percent of Indonesians said they felt close to any political party, down from the roughly half who had indicated such closeness in the early 2000s (Mujani, Liddle, and Ambardi Reference Mujani, Liddle and Ambardi2018, 188). Low identification continued through the end of 2021, when Indikator Politik Indonesia (2021) again found that only 9 percent of their respondents who felt some degree of partisan attachment to a political party. Changes to electoral institutions, including a shift to open-list PR elections and the slow collapse of the former ruling party may be partly to blame (Fossati Reference Fossati2020; Ufen Reference Ufen2008).
Yet while partisan identity is low, congruence between parties and voters' ideology is fairly high, at least on one issue: religion (Fossati et al. Reference Fossati, Aspinall, Muhtadi and Warburton2020). Voters rarely think of themselves as partisans, but in at least one issue area, voters reliably sort themselves into the parties that align with their values.
One reason for the recent congruence between party and voter ideology on religious issues may be that polarization in the electorate is being driven by the mobilization efforts of high-profile politicians on opposite sides of the religious divide. The two highest-profile of these have been President Joko Widodo and his longtime rival, Prabowo Subianto. In 2014, Jakarta governor Joko Widodo, known as Jokowi, defeated the former general and son-in-law of Suharto, Prabowo in the race for the presidency. The race was divisive, with Prabowo mounting a populist campaign that leveraged Islamist militants and worked diligently to spread rumors (Mietzner Reference Mietzner2014). The rumors focused on conspiracy theories that Jokowi was secretly a Christian and controlled by a shadowy group of Chinese tycoons. When Prabowo lost, the rumors continued, now focusing on election fraud.
The mobilization of religion plus a strong anti-Chinese message were key elements of the country's next high-profile election: the 2016–2017 race for Jakarta governor (Lim Reference Lim2017). Mobilizing a constituency the scholar-turned-politician had once studied, challenger Anies Baswedan used Islamist toughs, clerics, and anti-Chinese sentiment to bring thousands to the streets before defeating the incumbent, Ahok, an ethnically Chinese Christian politician, by a wide margin (Mietzner, Muhtadi, and Halida Reference Mietzner, Muhtadi and Halida2018). Mobilization of religious and anti-Chinese resentments had thus been important to the two best-covered elections prior to 2019.
Two years later, Prabowo again faced a now-incumbent Jokowi in the presidential election. As before, Prabowo's proxies argued that democracy and Islam were at stake in the election, laid the groundwork for claims of fraud, spread rumors about Chinese tycoons on TV and online, and continued their outreach to conservative Islamic forces (Sukmana Reference Sukmana2018; Talk Show tvOne 2019). Over five years and three nationally watched elections, mobilization around religious and ethnic identity were key themes, and Islamic organizations played prominent roles. Not surprisingly, attitudes about these organizations and the ideas they advocated became strong predictors of national political attitudes (Mietzner, Muhtadi, and Halida Reference Mietzner, Muhtadi and Halida2018).
Did this intense mobilization mean that the electorate was becoming polarized? Or did it reflect the dominance of a few political personalities and the special concerns of the (Jakarta-based) national media? If the latter, then what looked like polarization would be transient and limited to actively mobilized resentments. Tapsell's careful studies of Indonesian media suggested this latter view. As Indonesian news became increasingly obsessed with “berita hoaks”—fake news—and fears of polarization, he saw the concerns of Indonesia's educated, online elite projected onto the nation as a whole (Tapsell Reference Tapsell2019).
Warburton saw the divide differently. In her analysis, social media chatter “reflect[ed] the terms on which the election was actually being fought”—voters really did disagree in fundamental ways about the political figures, questions of tolerance, and regime goals that were at stake in the national election (Warburton Reference Warburton2019a, Reference Warburton, Carothers and O'Donohue2019b). If campaigns are mobilizing voters around resentments, it would be strange for political discussions on social media not to reflect this.
We seek to resolve this debate by looking in more detail at the sources of resentment in Indonesia, the relationship between resentment and vote choice, and the groups in which these resentments are expressed. If resentments are closely tied to political preferences, this is a sign that the divisions in the electorate are connected to deeper beliefs that are likely to matter in politics for some time. And if the resentments that marked campaign rhetoric are important to the electorate as a whole, this is a sign that polarization goes beyond a class of online people who get outsized attention from the national media.
What is resentment?
Resentment is an approach to measuring political attitudes associated with anger and blame attribution across preexisting social cleavage lines. At its most basic, resentment is the perception that an outgroup has received unfair advantages. Resentment studies in public opinion began with the study of racial resentment in the United States and have since expanded to include gender and place-based resentment measures. A generalized resentment framework emphasizes deservingness and a sense of being wronged across identity lines. How this sense of being wronged manifests and across which identity lines is context specific.
Resentment's origin as a psychometric measure lies in the study of racial prejudice in the United States. Recognizing that questions which framed race in biological terms might not elicit honest answers, Kinder and Sanders (Reference Kinder and Sanders1996) developed an index of what they called “racial resentment.” Their framework understood racial attitudes in terms of beliefs about deservingness, merit, and fairness.
Racial resentment has turned out to be a powerful tool in the study of US public opinion. It predicts affective partisanship (Abramowitz and Webster Reference Abramowitz and Webster2018), party preference (Westwood and Peterson Reference Westwood and Peterson2020), political polarization (Abramowitz and McCoy Reference Abramowitz and McCoy2019), and political preferences within minority populations (Kam and Burge Reference Kam and Burge2017, Reference Kam and Burge2019). The principal critiques of racial resentment measures disagree with their interpretation, but not with their predictive utility (Carmines, Sniderman, and Easter Reference Carmines, Sniderman and Easter2011; Feldman and Huddy Reference Feldman and Huddy2005). The racial resentment index has been particularly useful for identifying the partisan lean of voters who do not indicate a partisan preference. This makes it an attractive tool for studying polarization in Indonesia's low partisan self-identification context.
Generalizing resentment
To use resentment as a measurement tool in Indonesia requires altering a US-specific measure to fit into Indonesia's very different political context. Resentment has proven to be a portable construct, able to identify the same kinds of sentiments across new identity divides and, in turn, predicting similar political behaviors across contexts. Resentment scholars have found resentments built around gender (Kalaf-Hughes and Leiter Reference Kalaf-Hughes and Leiter2020; Schaffner, Macwilliams, and Nteta Reference Schaffner, Macwilliams and Nteta2018; Valentino, Wayne, and Oceno Reference Valentino, Wayne and Oceno2018) and place (Cramer Reference Cramer2016; Munis Reference Munis2020) effectively predict a similar set of beliefs and attitudes in the United States. Outside of the United States, scholars of European and Australian politics have explicitly linked resentment of immigrants to the rise of populist right-wing parties (Betz Reference Betz1993; Ivarsflaten Reference Ivarsflaten2008; Mughan and Paxton Reference Mughan and Paxton2006). Far from being limited to racial division in the United States, resentments can form around many different social identity lines in many different places. The proven extensibility of this type of resentment framework means that we can reasonably expect that a properly contextualized resentment measure should be useful in Indonesia.
A useful example of extending the resentment framework to a new social divide comes from Cramer, who writes of a resentful rural outlook with three elements: “(1) a belief that rural areas are ignored by decision makers, including policy makers, (2) a perception that rural areas do not get their fair share of resources, and (3) a sense that rural folks have fundamentally distinct values and lifestyles, which are misunderstood and disrespected by city folks” (Cramer Reference Cramer2016, 12). Cramer's approach was then operationalized in a public opinion study as “place resentment”: the sense that other places are treated better than one's own (Munis Reference Munis2020). Cramer's description of a rural resentful outlook and Munis's subsequent generalization of it into a more generic place-based resentment are examples of the kind of work needed to contextualize resentment for a specific place or set of social relationships. Our adaptation of resentment to the Indonesian context follows a similar logic.
A generic resentment measure would focus on fairness, resources, and respect across an identifiable social identity line. Importantly, the implied in-group would not necessarily need to be disadvantaged, it would only need to believe that it is. Place, race, and religion have been common resentment divides in many contexts, and in adapting resentment to Indonesia, we consider each of these.
Mobilized and un-mobilized resentments
There may be differences in the intensity and predictive power of different resentments as they apply to distinct social divides in a single context. This is because the feelings that compose resentment can exist separately from a specific political identity. To the extent that a resentment is currently being mobilized by a well-defined political faction or actor, that resentment ought to be highly correlated with support for that actor. Yet other resentments, those that are present in the population but not currently being mobilized, might be detectable in a survey while having limited power to predict political preferences. In our study, we include both mobilized and un-mobilized resentments, allowing us to check whether only those resentments that are currently mobilized can indicate political preferences, or instead, whether even resentments that have rarely been mobilized in recent years can still provide insights into current political preferences.
Un-mobilized resentments are a useful lens through which to explore the depth of resentment's roots. In particular, the groups in which an un-mobilized resentment can be found suggest pathways through which resentment might be formed or sustained. If mobilization expands resentment's reach, then un-mobilized resentments should be more common among people whose experience of politics included periods during which the resentment in question was mobilized. This would generally mean either specific cohorts socialized into politics when a particular divide was salient, or a secular trend of older voters scoring higher on that resentment measure than younger voters. Resentments that are echoes of past politics might contain clues as to the politics of the future.
Resentments in Indonesia
To identify resentments relevant to Indonesia requires identifying divisions around which resentments could exist.
The first resentments we consider in Indonesia are the frequently mobilized and well-studied phenomena of religious resentment—more specifically resentment of Indonesia's minority Christian population—and resentment directed at ethnically Chinese Indonesians (Mietzner and Muhtadi Reference Mietzner, Muhtadi, Fealy and Ricci2019; Setijadi Reference Setijadi, Fealy and Ricci2019). Both of these resentments have a long history in Indonesian politics and have featured prominently in recent political campaigns. These are clear examples of currently mobilized resentments.
We identify two currently un-mobilized resentments by examining episodes of sectional anger in Indonesian history. These are, first, resentment of the island of Java, and second, a more generic resentment of better-off places, which we term, “regional resentment.” Resentment of Java and regional resentments were important parts of Indonesia's early democratic politics but have been more muted in contemporary politics. We note that our resentment measure is focused on the role of Java island, motivated by the historic imbalance of power between Java and the Outer Islands. An alternative approach would be to focus on resentment of ethnically Javanese people, the national plurality ethnic group.
There are number of additional possible resentments that we did not test in this survey, but that could be worth exploring. These include resentment of elites (Levitsky and Ziblatt Reference Levitsky and Ziblatt2018), gender-based resentment—especially given the gender gap in voting at the national level (Indikator Politik Indonesia 2019), and anti-immigrant sentiment (Hadiz Reference Hadiz2016; Pepinsky Reference Pepinsky2020).
Resentment of ethnically Chinese Indonesians
Anti-Chinese sentiment has a long history in Indonesian politics. It is often intertwined with religious anger and broader battles over immigration and ethnic hierarchy. Under Dutch colonial rule, de jure racial divisions shaped the emerging capitalist economy, with key parts of the financial system reserved for ethnically Chinese residents of the archipelago (Anderson Reference Anderson1983; Carey Reference Carey2007). The system placed the archipelago's Chinese population into a precarious position: forced to remain distinctive, holding a major role in moneylending, and dependent on sovereigns for protection.
In the early twentieth century, the mass migration of people from Southern China to Southeast Asia led to the emergence of the “pribumi discourse” in which Malay ethnicity and Muslim faith were defined as closely related attributes of true Indonesians—a classification that excluded Chinese people (Setijadi Reference Setijadi, Fealy and Ricci2019; Sidel Reference Sidel2008).
Anti-Chinese sentiment continued to shape politics through the post-independence liberal democracy (1949–57) and Guided Democracy (1957–65) periods. During the subsequent New Order dictatorship (1965–98), President Suharto cultivated a handful of Chinese business people as, in effect, private national champions—part of a strategy to ensure the business elite was dependent on him (Friend Reference Friend2005; Sidel Reference Sidel2008).
While state restrictions on Chinese Indonesians loosened after Indonesia democratized in 1998, anti-Chinese sentiment continued to shape politics. In the 2014 presidential election, the candidate Prabowo Subianto—who had strong links to Islamic conservatives—circulated rumors that his opponent, the eventual winner Jokowi was a puppet of Chinese business interests (Mietzner Reference Mietzner2014). In 2016 and 2017, Islamist organizers staged massive rallies in Jakarta against the city's governor, the ethnically Chinese politician Basuki Tjahaja Purnama, better known as “Ahok.” These rallies were replete with conspiracies about Chinese influence on politics (Mietzner and Muhtadi Reference Mietzner, Muhtadi, Fealy and Ricci2019). The same discourse returned in the 2018–19 presidential election campaign.
Psychometric measures of anti-Chinese sentiment have already been used in previous surveys (Fossati, Hui, and Negara Reference Fossati, Hui and Negara2017; Mietzner and Muhtadi Reference Mietzner, Muhtadi, Fealy and Ricci2019). Our measures differ from those in focusing on the perception that Chinese Indonesians receive advantages unavailable to others.
Resentment of non-Muslim minorities
All Indonesians must indicate on their identity card adherence to one of six recognized religions. Eighty-eight percent of Indonesians classify themselves as Muslim (BPS 2010). Nearly all nationally known public figures, with the exceptions of a few ethnically Chinese tycoons and a few politicians whose careers began in majority non-Muslim areas, are Muslim. Since resentment involves beliefs about an out-group receiving an unfair share of social opportunity or government attention, resentment of non-Muslims would involve beliefs that non-Muslims receive advantages not available to the Muslim majority.
Previous research on attitudes towards non-Muslims found that most Indonesians do not believe Muslims are at a disadvantage in Indonesian society. However, that same research found that those who do believe Muslims are treated unfairly also tend to display a specific cluster of political beliefs (Mietzner and Muhtadi Reference Mietzner, Muhtadi, Fealy and Ricci2019). These beliefs include support for anti-pluralist politicians and low tolerance for non-Muslims in political and social life. Resentment of non-Muslims is an especially common feature of the discourse of Islamist groups like the Islamic Defenders' Front (FPI), which played a major role in mobilizations against Ahok, the Christian (and ethnically Chinese) former governor of Jakarta. Our instrument for measuring resentment of non-Muslims consists of agreement scales measuring responses to a series of propositions about the power of non-Muslims in society relative to the power of non-Muslims.
Resentment of Java
Accounts of Indonesia's politics in the years close to independence nearly always noted that tensions between Java and the so-called Outer Islands were a highly salient dimension of politics (Glassburner Reference Glassburner1962; Schmitt Reference Schmitt1963). While the balance between Java and the Outer Islands was contested in the past, it is less common today for national political figures to mobilize around the Java–Outer Island divide. Because of its long history in Indonesian politics, however, resentment of Java may remain a feature of public opinion.
The island of Java is central to Indonesian history for, above all else, demographic reasons. The majority of the country's population lives on the island. Since independence, every Indonesian president has been not only from Java, but also of the Javanese ethnic group. Outer Islanders, as the non-Javanese are often called, have long feared the possibility of Javanese domination.
This is exactly what happened after independence. And, as political scientists have noted, it generated resentment. Fisher wrote of the “growing resentment in the outer islands which by 1955 provided 88 per cent of the country's exports but were themselves starved of funds for urgently needed rehabilitation and new capital investment” (Reference Fisher1972, 158).
This imbalance persisted under Suharto's New Order dictatorship and did not end with his fall in 1998. Resentment of Java was widely believed to be at the root of the regional conflagrations that characterized the early reformasi years (Fitrani, Hofman, and Kaiser Reference Fitrani, Hofman and Kaiser2005). Three changes, however, mean that resentment of Java is today uncommon in politics. First, the Suharto administration aggressively repressed anti-Java sentiment on the grounds that it “threatened national unity” (membahayakan persatuan), the most important of the Pancasila principles. Second, the 1999 “big bang” decentralization was meant to appease potentially schismatic regional governments by giving them greater control over local spending and increasing the share of GDP going to the Outer Islands (Hofman and Kaiser Reference Hofman, Kaiser, Alm, Martinez-Vazquez and Indrawati2004). Finally, the advent of national presidential elections has made expression of anti-Java sentiment an electorally destructive strategy.
Resentment of Java might not solely operate through a sense of material unfairness. The cultural power of Java might also be a source of resentment. The Indonesian state has frequently equated traditional Javanese values with the values of the whole archipelago, as in the case of the Pancasila, or “five principles,” which serve as the national ideology (Ward Reference Ward, Fealy and Aspinall2010) and the Javanization” policy, in which laborers from Java were sent to other islands to, hopefully, model correct behavior (Hoey Reference Hoey2003).
A third way in which Java's role in politics may come to be resented is through the semi-official status given to Muslim organizations that advocate for Javanese Islamic practices (Barton and Fealy Reference Barton and Fealy1996; Menchik Reference Menchik2019). We therefore believe that, in addition to material and cultural resentment of Java, there is a religious dimension to resentment of Java. Our Java resentment index is designed to capture each of these elements.
Regional resentment
A key driver of anti-Java resentment has been the longstanding concern that Java would use its demographic weight to plunder the Outer Islands. But being taken advantage of by other regions is something that is not exclusive to the Outer Islands. Resentment of such a status quo could exist within Java, and within the outer islands as well. Given the long history of concerns about the distribution of natural resources across and within regions of Indonesia, we develop a measure of regional resentment.
The differences in living standards within and across the islands of the Indonesian archipelago are well-documented. Nearly all of the country's population earning more than 500 USD per month lives in the Jakarta metro area on the island of Java. Just 100 kilometers away, also on Java, Pandeglang District sits on the central government's list of “left-behind areas” eligible for additional development assistance. These vast regional disparities, which grow even more acute when comparing the largest metro areas to more remote parts of the eastern archipelago, may be fertile grounds for resentment.
Post-Suharto decentralization has reduced inter-regional inequality, though overall regional inequality remains high (Akita, Kurniawan, and Miyata Reference Akita, Kurniawan and Miyata2011; Hofman et al. Reference Hofman, Kaiser, Kadjatmiko and Sjahrir2006). These conditions suggest that regional resentment ought to be an important political force in places that might have a claim on being disadvantaged—and that these should be present not only in the Outer Islands, but also in poor regions of Java.
If decentralization has had an impact on this form of resentment, we should expect to see the highest resentment in communities bypassed by decentralization, but lower resentment in places that clearly benefited. The district seats of remote regencies have benefited most from the decade-long “blooming” of new districts that took place after 1999 (Pierskalla Reference Pierskalla2016). Our measures of regional resentment are designed to measure whether respondents believe that places other than their own receive more than their fair share of attention and resources from the government.
Survey Design
The purpose of identifying the four resentments—towards non-Muslims, towards ethnically Chinese Indonesians, towards Java, and towards regions other than one's own—is to contextualize resentment for Indonesian politics. Doing so allows us to answer two questions. First, do resentments correlate with political preferences such that resentments might be a base on which more lasting polarization could be built? And second, which parts of the Indonesian voting-age population feel resentments most strongly? The frequency of resentments and the intensity of resentment among those who express it, can indicate whether resentments might be the basis of future resentment-based mobilization.
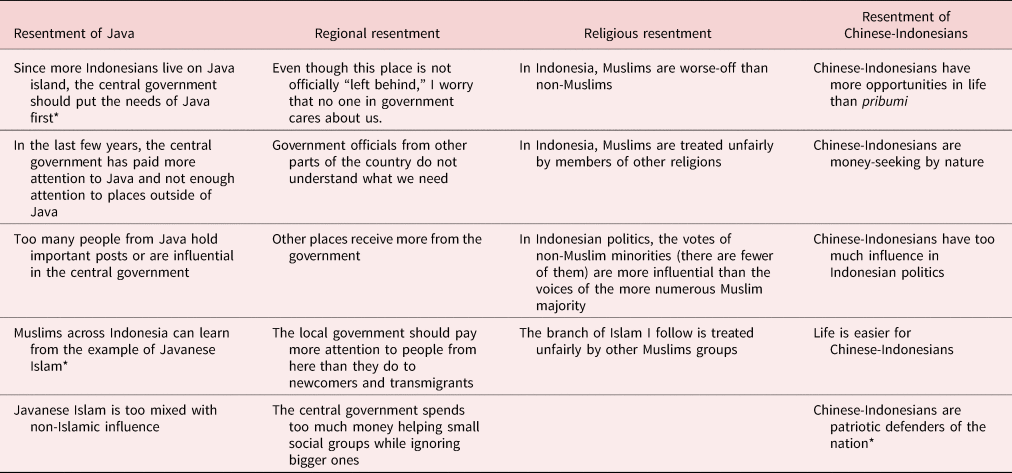
We developed a survey instrument to measure levels of the four resentments in the Indonesian voting-age population. Our four resentment batteries correspond to religious, anti-Chinese, regional, and Java resentment. The Java resentment measure, regional resentment measure, anti-Chinese resentment, and religious resentment batteries are original to the survey, though some questions in the religious resentment and anti-Chinese resentment batteries have appeared in other surveys. The racial resentment scale used in the United States relies on five-level agreement scale questions, and our resentment measures follow this pattern. Our questions on resentment of Java attempt to capture the political, cultural, and religious components of resentment of Java.
The resentment questions appeared as a block of 19 questions in a nationally representative survey of 1,520 voting-aged Indonesians fielded in February 2019 (two months before the national election) by Indikator Politik Indonesia. The survey used a two-stage random sampling procedure and interviews were conducted face-to-face. Twenty percent of the sample was re-contacted as a quality control check (Table 1).
Questions in the four resentment indices

* Indicates reverse coding; all questions are five-level agreement scales.
Questions were coded according to a five-level agreement scale with “strongly disagree” coded as one and “strongly agree” coded as five. On three questions, noted in the list above, this coding is reversed to ensure that across all questions, higher scores indicate higher levels of resentment.
Validity
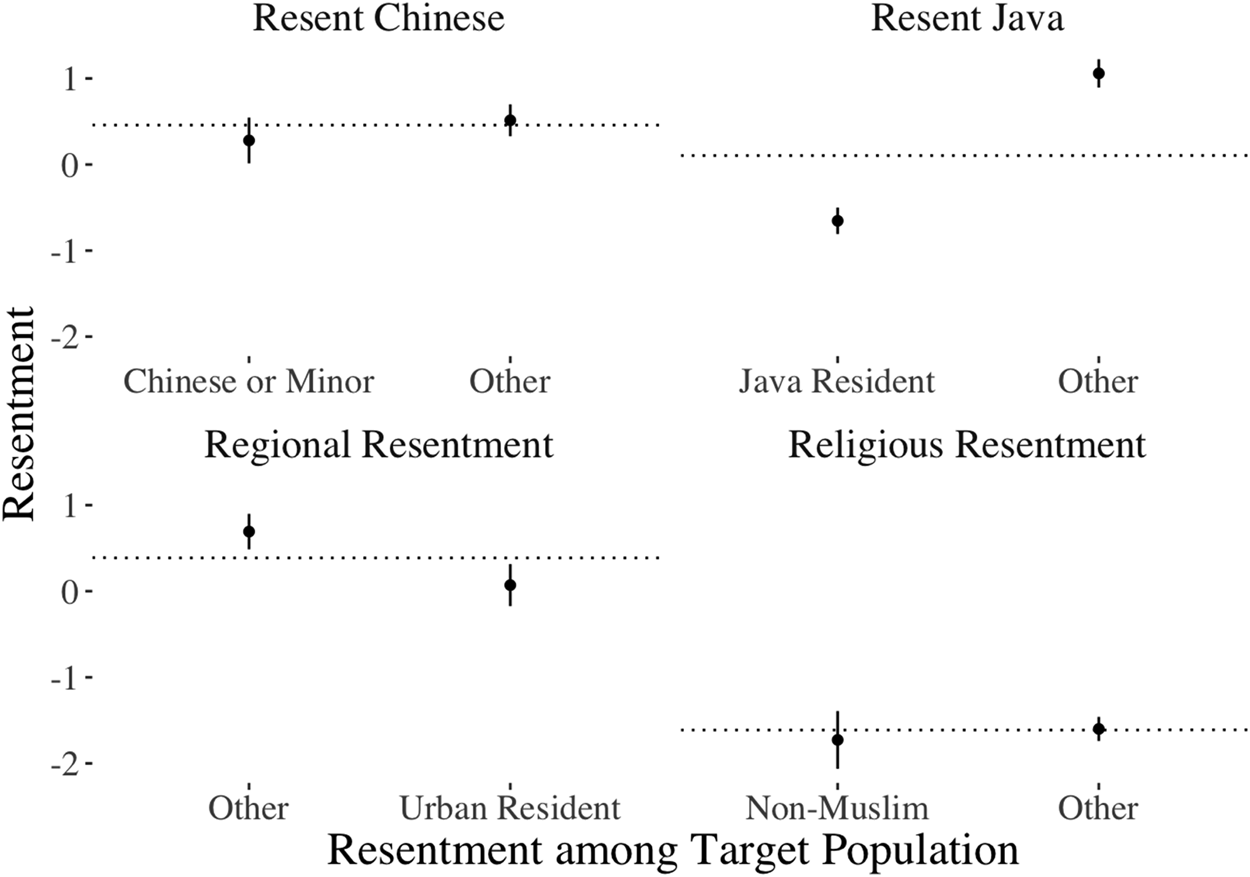
As a first check on the validity of the resentment measures, we compare whether, on average, members of a resentment's target group (such as respondents from Java when asked whether they resent Java) report lower levels of resentment towards their in-group when compared to out-group respondents. If the resentment measures capture what they are supposed to capture, each resentment measure should be lower among members of the resentment's target group (Figure 1).
Average resentment levels for respondents from populations targeted by resentment measures compared to average resentment for respondents not in target populations.

The figure shows that resentment scores are lower among members of the resentment indices' respective targets. Differences are largest for Java resentment, which is very low among people who live on Java and well above the average for people who live elsewhere. Regional resentment is presented here with the target group as urban and the source group as rural voters. The comparison of religious resentment is of Muslims and non-Muslims. The Chinese resentment variable compares members of the eight largest ethnic groups in the country to an “other” category in the survey's ethnicity question—most respondents who chose other are ethnically Chinese, however, based on surveys that use a more-detailed ethnicity question, we estimate that about one-third of respondents in the “other” category are not ethnically Chinese. These figures show that resentment is more common among out-groups than among the implicit targets of resentment. The intensity of those divides differs from group to group.
Hypotheses and Empirical Strategy
Since the goal of this inquiry is to test whether resentments, both mobilized and un-mobilized, are associated with political preferences in ways that might facilitate polarization, we first test whether resentments map onto political preferences. We then examine whether mobilized resentments matter more for political preferences, and which subsets of the population report the highest levels of resentment.
To operationalize the relationship between resentment and political preferences, we look at the relationship between resentment scores and support for the presidential candidate Prabowo Subianto. We present the relationship between support for Prabowo and resentment with adjustments for a standard demographic battery—religion (a binary variable indicating Muslim or non-Muslim), ethnicity, education, age, and income with province-level fixed-effects. This allows us to account for the important differences in resentment levels across these groups—differences that we explore further in a subsequent section of the paper.
We focus on support for Prabowo because his campaign most actively mobilized religious and anti-Chinese resentment. We hypothesize that higher resentment scores will be associated with greater odds of supporting Prabowo. We expect this relationship to hold across all four resentments. Statistical significance, however, is not the only result that matters. We also expect that the magnitude of the relationship will be larger for the two mobilized resentments (anti-Chinese resentment and religious resentment) than for the two un-mobilized resentments (regional resentment and resentment of Java).
We care about both the significance and the magnitude of the relationship because a higher magnitude for mobilized resentments indicates that mobilization of resentment makes resentment a reason to support (or oppose) a particular candidate. Un-mobilized resentments that correlate with support for a candidate could be a base for future polarization; mobilized resentments are part of present polarization. Regardless of the direction of the relationship, a strong relationship between resentment and support for candidates or parties suggests resentment as a basis for polarization.
To better understand where resentments might come from, we explore the connections between demographics and social ties and resentment levels. This allows us to test some propositions about the sources of resentment. These, in turn, allow us to understand whether the relationships between resentment and political preferences are epiphenomena of other important political variables. We hypothesize that lower-income respondents will score higher on measures of resentment than higher-income people, as lower-income respondents have greater material basis for resentment.
If partisan polarization is emerging due to recent political changes, and if resentment is connected to it, then we ought to observe higher levels of resentment among younger respondents, whose experience of politics has been largely shaped by the recent arguably polarized politics. If, however, resentments are residues of older conflicts, they will be concentrated among older respondents. Thus, we expect currently activated resentments to be especially common among younger people, while the un-mobilized resentments linger among people who can remember periods when they were mobilized. Specifically, we expect anti-Chinese and religious resentment to be highest among younger respondents, but resentment of Java and regional resentment to be highest among older respondents whose entry into adulthood occurred during times of greater conflict on these dimensions.
The role of religious organizations and social media are explored in Appendices A1 and A2, respectively.
Finally, we expect that regional resentments will be concentrated among people in rural areas and in areas outside of regional capitals.
Resentment and Votes for Prabowo
To understand whether resentment matters for political preferences, and thus could contribute to polarization, we model support for 2019 presidential candidates as a function of resentment. We are especially interested in Prabowo support as an outcome because Prabowo was the candidate who most openly mobilized religious and anti-Chinese resentment. We focus on both the significance and magnitude of each resentment score's correlation with Prabowo support, as we are interested in whether resentment matters and whether it is more predictive when resentments are being actively mobilized by a specific candidate relative to when they are not. We then explore the demographic subgroups within which resentment is concentrated. This provides an approach through which to understand what, if anything, might be responsible for each resentment.
Resentment predicts support for Prabowo, the resentment mobilizer
We find that resentments are strongly predictive of political preferences. Across all four measures, higher resentment was associated with greater probability of supporting Prabowo. This holds even after adjusting for respondents' religion, ethnicity, age, income, education level, and province of residence. The same relationship is observed using party identification, though the much lower rates of party identification limit the power of these tests. This relationship indicates that resentment has an independent role in shaping vote intention.
Resentments of Chinese-Indonesians, of the role of Java, and of non-Muslims are similarly predictive of support for Prabowo. Because the mean level of religious resentment is much lower, the high-resentment respondents in this category represent a smaller share of respondents than the high resentment respondents in the anti-Java and anti-China indices. Not surprisingly, then, the smaller share of respondents with positive scores on the religious resentment index were among the most likely to vote for Prabowo.
We were concerned that higher-resentment respondents might be more likely to refuse to answer questions about their political preferences. We found, however, that resentment was not predictive of refusal, with one exception. Only resentment of Java was associated with increased probability of not responding to the vote preference question.
Note that because each response to a resentment question is coded as either positive (agreement with a resentful statement) or negative (disagreement), the indices generate values between negative five and positive five (or four, in the case of the religious resentment index). A score of negative five means that the respondent disagreed with all of the propositions in the resentment index, while a positive five indicates agreement with all of the propositions (Figure 2).
Probability of vote choice for each candidate by resentment score with controls. Error bars are 80 percent predictive intervals.

While there is a clear strong relationship between resentment and support for Prabowo (who mobilized two of the resentments), this could be related to voters' view of the presidential candidates' personalities rather than reflecting more encompassing political preferences. To understand whether resentment is connected to additional political preferences, we checked whether resentment is associated with party vote intention. In our sample, about seventy percent of respondents indicated a party they intended to vote for in the legislative ballot (far larger than the share of respondents who indicated they viewed themselves as members of a party). We divided the party groups based on whether they had joined the Jokowi (“government”) or Prabowo (“opposition”) nominating coalitions. A stated intention to vote for PDI-P, Golkar, PPP, Hanura, NasDem, PKB, PBB, PKPI, Perindo, or PSI was treated as a “government” vote, while an intention to vote for Gerindra, PKS, PAN, Demokrat, or Berkarya was treated as support for the “opposition” coalition (Figure 3).
Probability of vote choice for each coalition by resentment score with controls. Error bars are 80 percent predictive intervals.

We find that with both measures, resentment is associated with preferences for Prabowo and the group of parties that nominated him. We find that regional resentment is less strongly predictive of vote choice than the others, though it is still fairly predictive. One reason for this weaker correlation may be that regional resentment is more conceptually diffuse. Another is that regional resentment may be closely connected to anti-incumbent sentiment, and that may implicate local authorities on more than one side of the polarized divide.
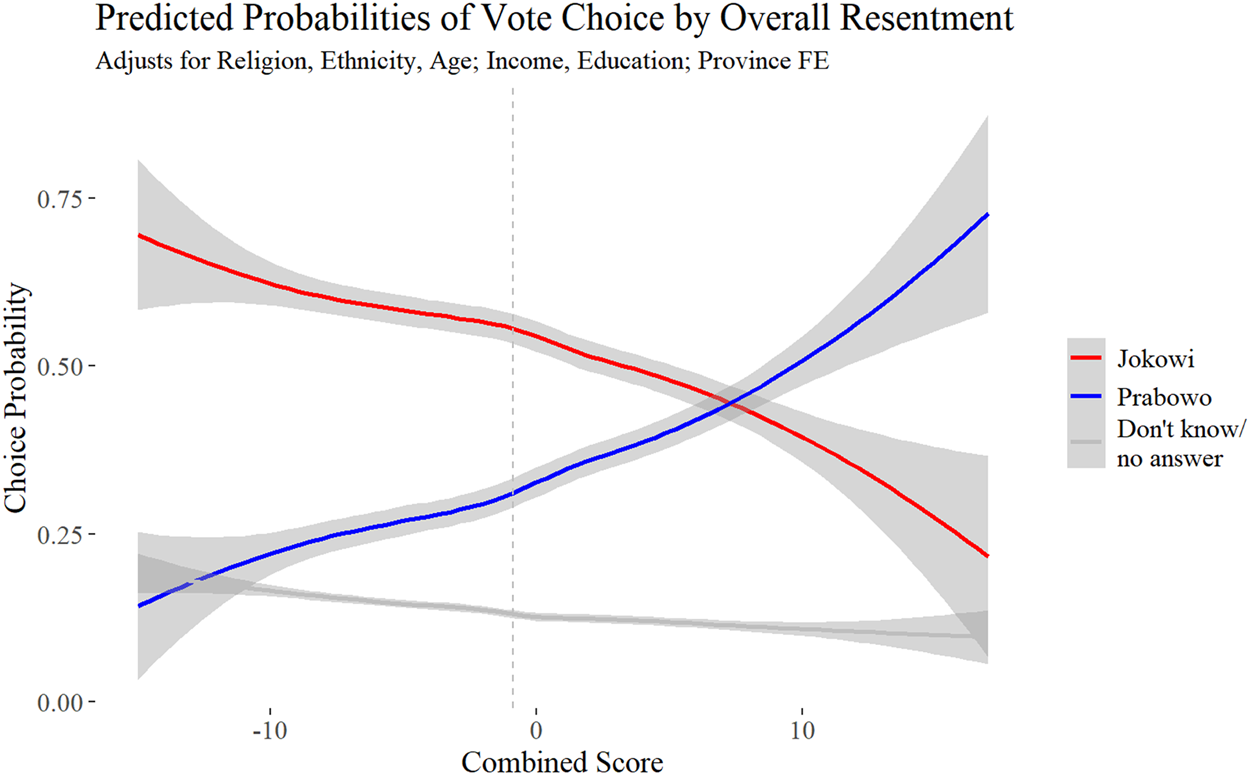
In addition to measuring the role of each resentment, we also combined the measures into a generalized resentment score. Since the four resentments are distinct constructs, combining them is not appropriate for all purposes. However, it is worth exploring whether resentments stack, and whether there might be a “resentful vote”—a group of people who score high on most resentment measures (Figure 4).
Combined Resentment. Error bars are 80 percent predictive intervals.

The combined resentment index shows that when pooled together, any increase in a respondent's resentment score was associated with an increase in the odds they intended to vote for Prabowo. Among the relatively small share of the population who scored high on more than two indices, the odds of reporting a vote for Prabowo were especially high.
These relationships suggest that resentments are partially responsible for partisan divisions in Indonesia. Who holds these attitudes, and what might that tell us about resentment and polarization?
Who is resentful?
Having established that both mobilized and un-mobilized resentments are correlated with vote choice even after adjusting for demographic factors, we turn to the question of who is resentful. We find that resentments are not evenly distributed across either the population as a whole or the in-group population. Instead, high levels of resentment are concentrated in specific sections of the populace. Some broad categories are weakly associated with resentment, as income (negatively correlated) and gender (women usually score higher). Narrower categories are especially strongly associated with specific resentments. Our goal in exploring these relationships is to understand whether resentment is a general phenomenon, or one connected to specific categories of people exposed to resentment mobilization at specific times.
We do this by considering a set of demographic variables to which different resentments have been attributed, comparing these demographics not just to the specific resentment associated with it in the literature, but to all four resentment indices. This allows us to test the plausibility of proposed relationships while also ensuring that the demographic variable proposed only operates on the kind of resentment it is supposed to operate on. The variables we consider are, first, income and gender, because these two variables have been consistent predictors of resentment in other contexts. We then consider age cohort, which is especially important for un-mobilized resentments that were once politically fraught, and the role of urban–rural splits, which is especially important for the regional resentment question. With the exception of regional resentment, the figures depict the sample data, rather than the results of models.
We find that un-mobilized resentments are largely confined to older age cohorts and religious resentment is strongest among affiliates or sympathizers to specific religious groups active in the mobilizing of resentment. As for regional resentment, one group of respondents report unusually low levels of regional resentment—residents of district seats.
These relationships are consistent with (though do not dispositively prove) a story in which resentments of different kinds are mobilized intermittently but leave lasting traces in attitudes while operating within subsets of the resentment in-group, rather than evenly across the entire in-group. In this section, we are largely concerned with simple sample properties. We visualize trends with confidence intervals. In the case of regional resentment, we present the result of a modeled relationship, but also present the simple sample properties in Appendix A7.
Some resentments are correlated with income; the relationship is strongly gendered
An enduring question in studies of resentment and political polarization is the relationship between both phenomena and income (or wealth). As we explore the demographic groups in which resentment is most (and least) common, the income and wealth of respondents is worth scrutinizing because material theories of resentment—or more specifically, grievance theories of political anger—have long proposed that lower-income people feel aggrieved by those who have more than they have (Runciman Reference Runciman1972). Although the resentment measures do not explicitly engage with wealth, income, or social class, each of the resentment measures is meant to detect when people feel they have been treated unfairly, which may be a more common sentiment among people who earn less. Indeed, a consistent claim around the anti-Chinese and anti-Christian mobilization of the 2017 Jakarta gubernatorial campaign was that the resentments on display were epiphenomena of a class conflict triggered by the governor's slum clearance policy (Wilson Reference Wilson2017).
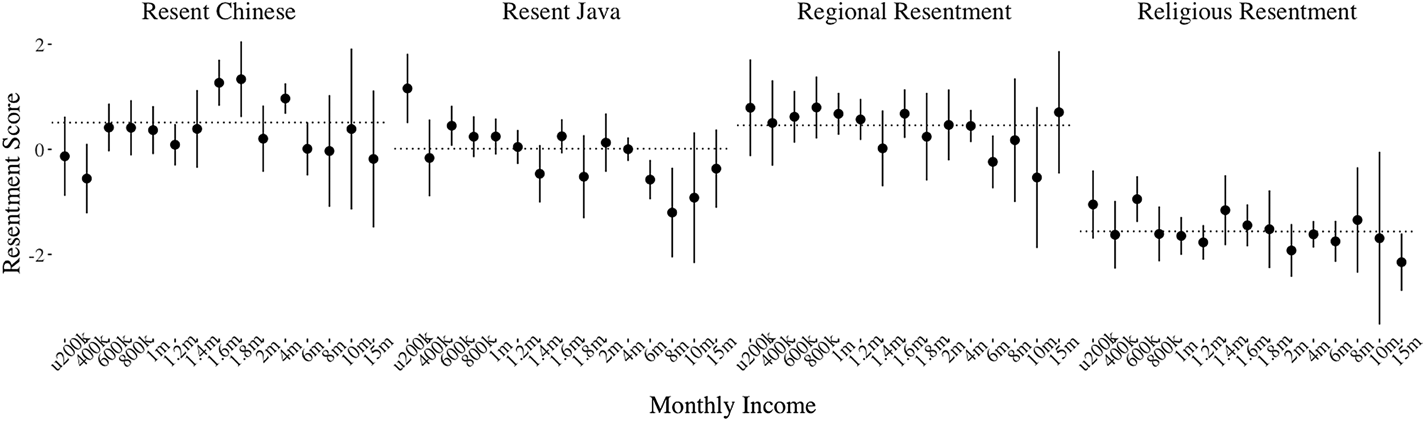
The question we ask here is whether resentment is an epiphenomenon of income. We find that resentment scores do not exhibit a strong linear trend as income increases—with the exception of resentment of Java, which decreases as income decreases. This is consistent with the idea that resentment operates somewhat independently of income, and probably of class. Low Java resentment scores in higher income bands reflect, in part, the concentration of high incomes in the major cities of Java (Figures 5 and 6).
Monthly income and resentment, sample means and 95-percent intervals.

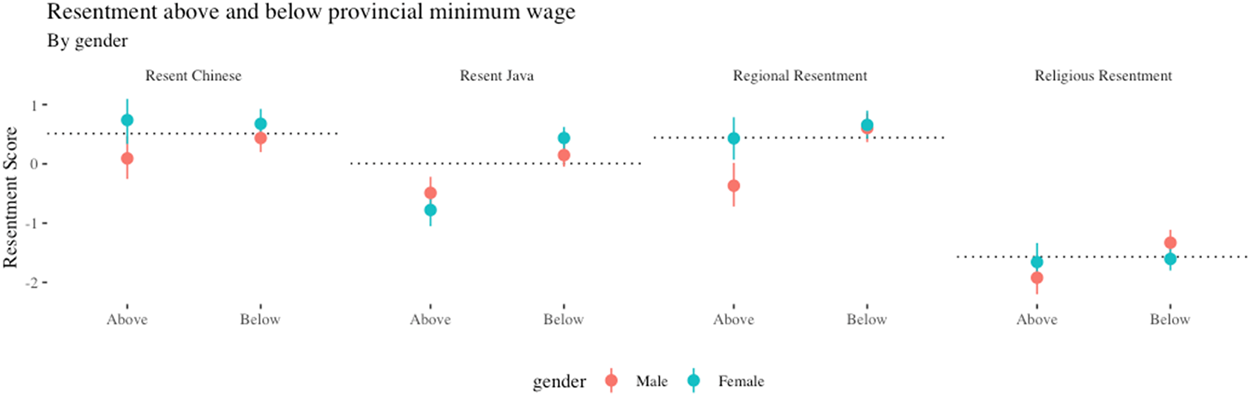
Income relative to provincial minimum and resentment, separated by gender, sample means and 95-percent intervals.

For the reasons mentioned above—differences in regional cost of living, concentration of high-earning jobs in major metro areas—nominal income is potentially misleading. If resentment is connected to material grievances, it makes sense to compare respondents doing better and doing worse than others in the same area. We therefore compared respondents whose self-reported monthly income exceeded the provincial minimum wage to respondents whose monthly income was below the provincial minimum.Footnote 1 A minimum wage-based measure is also less prone to bias induced by the relatively small (but heavily weighted in a linear model) number of very high earners.
Because the sample sized allowed, we decided to split the sample by gender. This produced one of the more surprising results, one that more firmly roots resentment in identity. We find that resentment is mostly higher among respondents earning less than the provincial minimum wage, but the size of the difference is much larger for men than for women (with the exception of resentment of Java).
We find this evidence suggestive of a partially material basis for resentment.Footnote 2 Since this relationship is much stronger among men, however, it is reasonable to conclude that identity components play an important role in resentment.
After modeling resentments as a function of ethnicity, age, education, religion, and gender, we found that respondents below the minimum wage for their province were more likely to report higher scores on religious resentment and resentment of Java, but not higher regional or anti-Chinese resentment. This is one small piece of evidence against the idea that resentment of ethnic Chinese distracts the poor from their reasonable material grievances, even as it bolsters somewhat the link between poor material circumstances and religious resentment (Wilson Reference Wilson2017). A key piece of that latter link is in the relatively poor membership of intolerant religious organiations.
Lingering resentments are for the old; active resentments are for the young
One of the most important questions around any study of a political attitude is whether it is specific to demographic subgroups. The age of the median resentful respondent is an important indicator of whether population-level resentment levels may change over time via cohort replacement. If resentment is concentrated among the young, its importance may grow as younger people age into the larger demographics of the voting population. Age and cohort effects in voting populations are also strongly connected to key moments of political socialization—moments which tend to shape political preferences of age cohorts as they move through the population (Ghitza, Gelman, and Auerbach Reference Ghitza, Gelman and Auerbach2019).
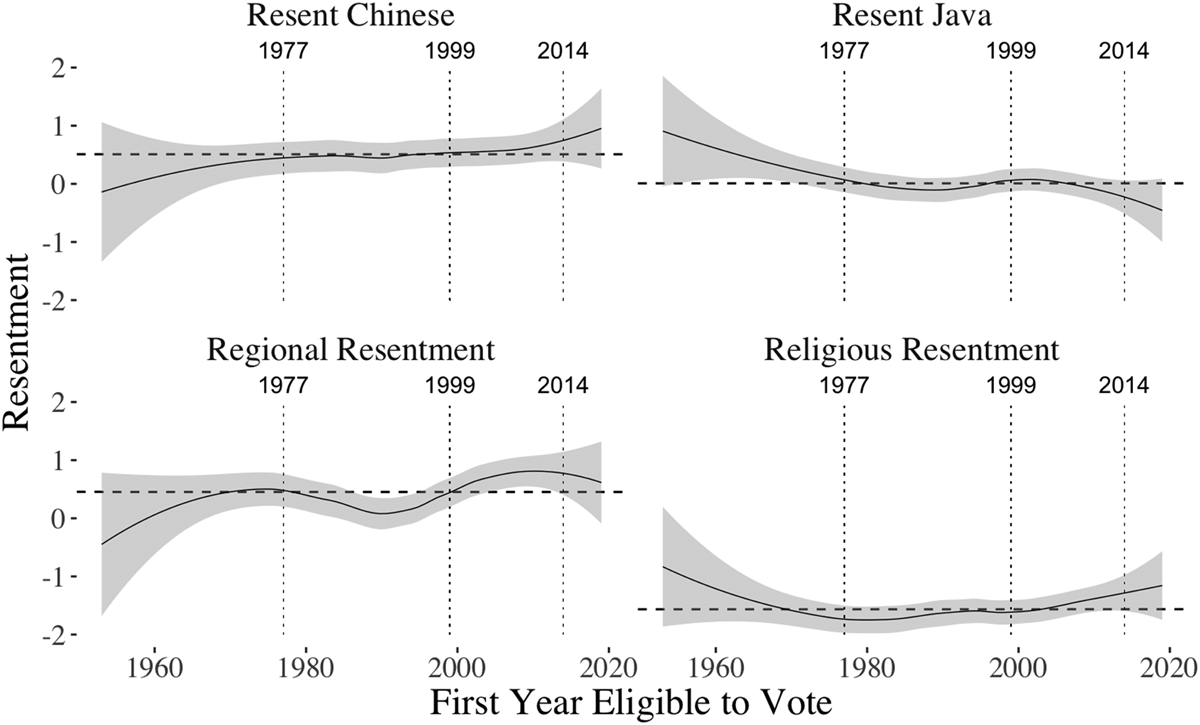
We analyzed the relationship between each resentment and age, focusing on key moments of political socialization. We expected, first, that regional resentment and resentment of Java would be higher among older respondents, whom we believed were more likely to be aware of the longstanding dissatisfaction over Java's outsized role in pre-decentralization politics. We expected that younger respondents might be more likely to report higher levels of religious resentment, as the incitement of religious resentment at the national level has been more common in recent years. We were agnostic on the direction of any relationship between age and anti-Chinese resentment. We also expected that three moments of political socialization might be important and observable as break points in the data. Those moments were the onset of managed party competition in the Suharto dictatorship in 1977, the 1999 elections following democratization, and the 2014 presidential election. We did not find strong evidence that the three politically significant years—1977, 1999, and 2014—were associated with changes in predicted resentment (Figure 7).
Resentment and age, error bar indicates 95-percent confidence interval.

We were agnostic as to the direction of any relationship between age and anti-Chinese resentment, as we viewed anti-Chinese resentment as a fairly common resentment with a long history. Our results suggest that while there is only small variation in anti-Chinese resentment across cohorts, it is in fact the youngest cohorts who are most likely to hold anti-Chinese views. This is borne out clearly in t-tests comparing the youngest four cohorts to any other cohort—anti-Chinese resentment is larger at a significant level.Footnote 3 There are two likely reasons for this. The first is that the period in which young respondents were socialized into politics—the present—has been especially rich with anti-Chinese conspiracy theories. The second is that these cohorts have the greatest exposure to social media, where anti-Chinese conspiracy theories are abundant. In the Appendix we discuss the relationship between social media use and anti-Chinese resentment. Because our social media results control for age, it is likely that these youngest respondents are stewing in anti-Chinese memes in ways not fully captured in those models by a simple adjustment for age.
We find that resentment of Java is far lower among younger voters than among older voters. This is consistent with our hypotheses, and with our view that anti-Java resentment is currently un-mobilized. Given its consistent decline, there may be little potential for this resentment to become activated. In addition, the imperatives of national campaigns make it unlikely that a high-profile candidate would sacrifice a majority of the country's voters with a campaign focused on resentment of Java.
Regional resentment is especially high for respondents born between 1982 and 1997 but did not continue its increase in the youngest voting-aged cohorts. Respondents of that age are a very large share of the voting population—about 40 percent. They will continue to be a very large share of the population for some time. The oldest group in that cohort reached voting age the same year as the 1999 decentralizing reform, and many born in 1982 were able to vote in the 1999 elections—the first post-Suharto election. At that time, regional resource division was one of the most intensely contested policy areas. Regional resentment has been less salient in national politics over the last two presidential cycles, likely because decentralization defused the conflict. Nevertheless, because the cohort that experienced the regional conflicts of the early 2000s will remain the largest voting cohort for some time, it has potential to become a key driver of public opinion, should it be re-activated.
The complete trend in religious resentment indicates a slightly higher level of religious resentment among two groups: the very oldest and the very youngest cohorts—respondents who in 2019 were over 70 or under 22. Because of the small number of respondents in these two groups, the difference between them and the intervening cohorts' level of religious resentment does not meet the threshold of statistical significance. Furthermore, the fact that it is the early and late cohorts with elevated levels means that when age is used as a predictor of resentment in a linear model, the result is not significant. We note, however, that a large share of the respondents who report high levels of religious resentment are from the youngest cohorts, as are a large share of respondents who reported especially low levels of religious resentment. This result suggests that while overall levels of religious resentment may be only slightly higher in the newest cohorts, much of the high-intensity resentment is found in these entering cohorts. We take this as an indication that religious resentment will continue to play a polarizing role in politics.
Differences in regional resentment are about the winners of decentralization, not all urban–rural divides
As part of our validity checks, we showed that regional resentment was higher in rural areas than in urban areas. That comparison looked at respondents' administrative villages,Footnote 4 checking whether residents of villages classified as “urban” reported lower rates of resentment than residents of villages classified as “rural.” While our regional resentment measure was directly inspired by tools used to measure rural respondents' resentments of urban areas, we constructed the questions in a more generic way, one that more closely follows the generalized idea of “place resentment.” The questions ask whether other places receive more than their fair share—not whether big cities receive more than their fair share. This framework allows us to test whether regional resentment might be partially explained by the patterns of resource flows created by Indonesia's decentralization policy.
One of the most important changes to Indonesian public policy since democratization was the decentralization of many functions to district governments. As currently organized, district governments come in two types: city (kota) and regency (kabupaten). The difference is related to, but not strictly determined by, urbanization and density. Most cities are predominantly urban; some regencies contain large urban areas, while others are predominantly rural.
Because regencies can be very large, one subdistrict (kecamatan) in each regency is designated as the “seat.” After decentralization, these regency seats grew dramatically, as dozens of buildings had to be constructed and thousands of people appointed to civil service positions.
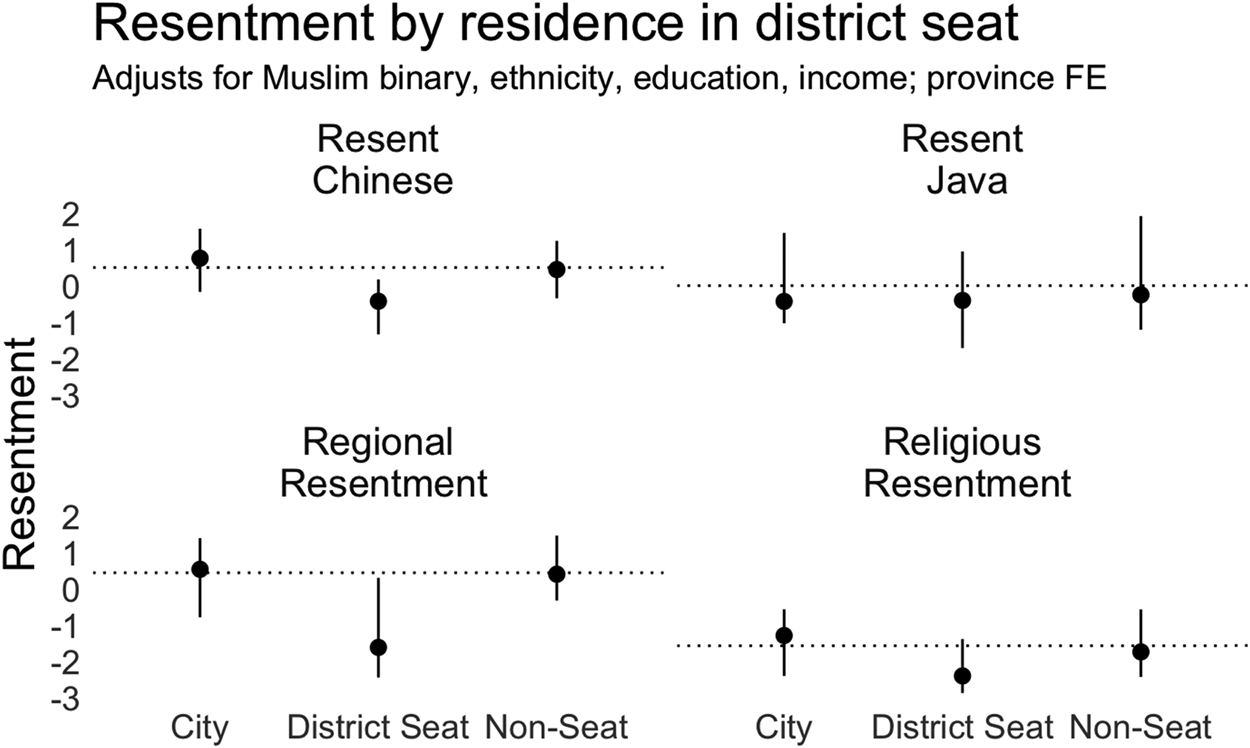
During our analysis, we realized that if regional resentment were rooted in a sense of rural dispossession, that sense ought to be far weaker among residents of the fortunate subdistrict seat communities. We identified the roughly 400 subdistrict seats in Indonesia and compared the resentment scores of respondents living in those communities to respondents living in cities and to respondents living in ordinary regency subdistricts (Figure 8). We found that regional resentment was indeed much lower in district seats than elsewhere, after adjusting for religion, ethnicity, education, income, and the respondents' provinces. We also note lower anti-Chinese and religious resentment scores among these respondents, though we do not have a strong reason to expect them. We take this as evidence that regional resentment is at least partially connected to inequalities in resource distribution between regions. From a public opinion perspective, decentralization has successfully reduced regional resentment.
Resentment and status of district of residence. Median predicted probabilities and 80 percent predictive intervals. See Appendix 7 for un-modeled sample means.

Conclusion
Adapting the racial resentment framework from the United States political context, we drew on historical cleavage structures and present-day grievance politics to develop resentment frameworks suitable for the Indonesian context. Our four candidate indices focused on resentment of ethnic Chinese Indonesians, resentment of Java's central role in politics and culture, regional resentment, and resentment of the non-Muslim minority.
We find that each of the four resentments has predictive power for political affiliation, though magnitude of the relationship differs. The two currently mobilized resentments—of non-Muslims and of ethnically Chinese Indonesians—are much more strongly correlated with political preferences than the un-mobilized resentments of Java and regional disparities. Because resentment scores are strong predictors of partisan preferences, but partisan preferences are noisy predictors of resentment, we interpret our evidence to show that resentment is a driver of partisan preferences.
Exploring the demographics of resentment, we find that resentments are not a straightforward consequence of material concerns, and that high levels of each resentment measure are found in different demographic strata. These strata provide clues as to how resentments are activated and who might be motivated by the activation of different resentments.
The clearest link between a demographic stratum and a mobilization pathway is found in the fact that high levels of religious resentment are strongly concentrated among members and fans of specific organizations that have played a role in mobilizing that resentment. Few respondents who were not members had high levels of religious resentment. If the government's recent crackdown on the FPI is successful, the ability of these groups to mobilize religious resentment may diminish (Aspinall and Mietzner Reference Aspinall and Mietzner2019; Mietzner Reference Mietzner2020).
Resentment of Java, which has not recently been activated in national politics, was nonetheless present among respondents. As such, it should not be surprising that it is less strongly associated with partisan preferences than activated resentments. We viewed resentment of Java as a potential resentment because it has been an important divide in the past. And indeed, we find that high resentment scores are far more common among voters old enough to remember when resentment of Java was a mobilized resentment. Without new political entrepreneurs to revitalize the anti-Java cause, this resentment may eventually cease to matter.
The other un-mobilized resentment we tested for was regional resentment. We found that regional resentment was, unsurprisingly, higher among rural Indonesians. We then tried to determine whether the decentralization policy meant to reduce inter-regional resentment could be found at work in the present electorate. We found that regional resentment is low in those places that have clearly won from decentralization—the increasingly important district seats. And with those locales separated from the broader group of urban locales, we found that resentment in urban and rural areas was mostly similar. The new winners are quite happy with decentralization; there is no division among everyone else. The policy worked. And one sign that it worked was in the age cohort analysis. Just as people who lived through moments of intense anti-Java sentiment still had some resentment of Java, people who lived the period of agitation around decentralization were the only people with high regional resentment. And while the decentralization policy has worked to reduce urban–rural resentment, this may be a vein of resentment with ore left to mine—respondents in that higher resentment age range comprise nearly 40 percent of the voting age population.
One of the more surprising age relationships we observed was that high anti-Chinese resentment was especially concentrated among younger respondents. Further exploration revealed that this relationship may have more to do with social media use, something other scholars have noted is a primary vector for anti-Chinese conspiracies (Lim Reference Lim2017; Tapsell Reference Tapsell2021) and is far more common among young people. Anti-Chinese resentment is associated with high rates of social media use even after controlling for age and other demographics, which tells us that heavy exposure to conspiracy content is related to resentment of the group that content is about.
Because resentment of Java is strongly associated with being a member of age cohorts old enough to remember regional conflicts, it is worth considering how timing may be affecting younger cohorts. Mobilized anti-Chinese politics and heavy exposure to the social media sites that most aggressively traffic in anti-Chinese ideas have been key features of younger Indonesians' coming of political age. Unless something intervenes to reduce anti-Chinese mobilization or restrict exposure to conspiratorial social media content, anti-Chinese resentment is likely to become an even more important force in politics as new cohorts of even more-online people enter the political arena.
Our results suggest that young voters are, on average, more resentful than older ones (except with respect to Java). We take this as a sign that Indonesia's polarizing decade has had important consequences for the political socialization of the newest voters. Entering politics in a high-conflict period, they are more upset by the distribution of resources and privileges than those older than them. This pattern merits further study.
We consistently found an association between resentment and support for the political right in Indonesia, measuring by both support for the populist challenger and by support for opposition parties. All of the resentments pointed in the same direction. We take this as evidence that partisan polarization is rooted in longstanding and perhaps permanent cleavage lines.
Our results suggest that resentments are an important part of right-leaning political preferences in Indonesia. They also show that resentments can come and go. The once-fundamental divide over the role of Java seems to be in terminal decline, and the necessity of winning votes on Java means that it may not ever be revived in a democratic Indonesia. A decade of bitter conflicts over regional resource distribution left its mark in the electorate: the people who came of age during those conflicts still express greater regional resentment than those who came before and after. Yet that same conflict also indicates paths to neutralizing resentment: nearly all of the observed urban rural divide in resentment levels today is due to the very low regional resentment scores of respondents in the district seats that most benefited from the decentralizing reforms specifically intended to deal with this dissatisfaction. Policy interventions can fix the grievances behind at least some resentments. Then, generational replacement slowly reduces the share of people who still harbor that lingering resentment.
The path of resentments left un-mobilized suggest that the future of mobilized resentments depends on whether interventions or institutions push against these resentments. In the case of religious resentment, its close association with specific organizations means that it may be reduced as a political force by the ongoing crackdown on the FPI and other resentment-fostering organizations. Religious resentment will then become rarer, but it will remain a powerful predictor of political preferences. Anti-Chinese resentment is not nearly so dependent on particular organizations. Having been central to two consecutive electoral cycles and pervading social media, this resentment has already shaped the politics of the youngest voters. As they mature into candidates, they are likely to reach into the evergreen discourse of anti-Chinese sentiment, knowing that many in their cohort hold that resentment. This will be a powerful instrument of polarization.
Supplementary material
The supplementary material for this article can be found at https://doi.org/10.1017/jea.2023.17.
Acknowledgements
We thank Djayadi Hanan, Ade Armando, and Saiful Mujani for their assistance with the resentment framework. We thank Arief Budiman and Gautama Adi Kusuma for encouraging further exploration of resentment in Indonesia. We thank Bill Liddle, Jeremy Menchik, Frances Hagopian, Thomas Pepinsky, and Steve Levitsky for comments on draft versions of the article. We also thank Alyssa Huberts, Alisha Holland, Yuhua Wang, Fernando Bizarro, and participants in Harvard's Comparative Politics Workshop for their comments on early versions of this article.
Sources of support
Internal grants from the Harvard University Asia Center, the Weatherhead Center for International Affairs at Harvard University, the Institute for Quantitative Social Science at Harvard University.
Conflicts of interest
The authors declare none.