INTRODUCTION
Crop production is facing more and more challenges in remaining productive due to adverse impacts of climate change on soil and plant processes. Understanding of the way in which these processes are being affected is highly relevant for researchers, policymakers and farmers alike. Consequently, in recent decades, extensive research has been devoted to crop productivity under climate change using both field experiments and modelling (Holzworth et al. Reference Holzworth, Huth, deVoil, Zurcher, Herrmann, McLean, Chenu, van Oosterom, Snow, Murphy, Moore, Brown, Whish, Verrall, Fainges, Bell, Peake, Poulton, Hochman, Thorburn, Gaydon, Dalgliesh, Rodriguez, Cox, Chapman, Doherty, Teixeira, Sharp, Cichota, Vogeler, Li, Wang, Hammer, Robertson, Dimes, Whitbread, Hunt, van Rees, McClelland, Carberry, Hargreaves, MacLeod, McDonald, Harsdorf, Wedgwood and Keating2014; de Wrachien & Goli Reference de Wrachien and Goli2015; Kimball Reference Kimball2016; Newbery et al. Reference Newbery, Qi and Fitt2016; Ruane et al. Reference Ruane, Hudson, Asseng, Camarrano, Ewert, Martre, Boote, Thorburn, Aggarwal, Angulo, Basso, Bertuzzi, Biernath, Brisson, Challinor, Doltra, Gayler, Goldberg, Grant, Heng, Hooker, Hunt, Ingwersen, Izaurralde, Kersebaum, Kumar, Muller, Nendel, O'Leary, Olesen, Osborne, Palosuo, Priesack, Ripoche, Rötter, Semenov, Shcherbak, Steduto, Stöckle, Stratonovitch, Streck, Supit, Tao, Travasso, Waha, Wallach, White and Wolf2016). Studies have widely accepted that projected changes of seasonal variations in temperature and precipitation patterns, and increasing atmospheric pressure of greenhouse gases, strongly affect agroecosystem processes. This means that within the current century, climate change is likely to improve crop productivity in some areas and diminish it in others. While in Northern Europe, and Denmark in particular, temperature increases have been shown to reduce grain yields of cereals due to shortening of the grain filling period (Patil et al. Reference Patil, Laegdsmand, Olesen and Porter2010; Borgesen & Olesen Reference Borgesen and Olesen2011; Kristensen et al. Reference Kristensen, Schelde and Olesen2011), the combined effect of climate change is predicted to be beneficial in, e.g. Canada (Qian et al. Reference Qian, De Jong, Gameda, Huffman, Neilsen, Desjardins, Wang and McConkey2013; Smith et al. Reference Smith, Grant, Desjardins, Kroebel, Li, Qian, Worth, McConkey and Drury2013).
For moderate changes in climate, the adverse effects of increased temperature on grain yield is expected to be offset by the increased carbon dioxide (CO2) concentration through enhanced photosynthesis among C3 plants (de Oliveira et al. Reference De Oliveira, Bramley, Siddique, Henty, Berger and Palta2012), as more than 0·90 of crop biomass is derived from photosynthetic products. Studies have indicated a close relationship between enhanced photosynthesis, biomass and yield when other genetic factors in a plant are not altered (Long et al. Reference Long, Ainsworth, Leakey, Nosberger and Ort2006a ; Wang et al. Reference Wang, Feng and Schjoerring2013). However, a lack of correlation between photosynthesis and grain yield has been also reported in wheat and rice (Evans & Dunstone Reference Evans and Dunstone1970; Takano & Tsunoda Reference Takano and Tsunoda1971; Long et al. Reference Long, Zhu, Naidu and Ort2006b ). With prolonged exposure to increased CO2, the stimulation of photosynthesis diminishes and responses regarding biomass productivity become smaller, a phenomenon known as CO2 acclimation (Drake et al. Reference Drake, Gonzalez-Meler and Long1997). The CO2 acclimation is explained in summary by two hypotheses: according to the ‘nitrogen (N) limitation’ hypothesis by Leakey et al. (Reference Leakey, Ainsworth, Bernacchi, Rogers, Long and Ort2009), enhanced growth under increased CO2 can cause nutrient deficiency because a limited amount of nutrients will be available over a greater biomass due to accelerated photosynthesis. It has also been shown that it is often the sink (the use of assimilates for growth) that limits biomass production (Fischer Reference Fischer2011), which is known as ‘the sink limitation’ hypothesis. If carbohydrate export from the leaf to the sinks is slow relative to assimilation, the accumulation of excess carbohydrates represses expression of photosynthetic enzyme producing genes and thereby reduces the synthesis of ribulose-1,5-bisphosphate carboxylase/oxygenase (Rubisco) leading to down-regulation of photosynthesis (Moore et al. Reference Moore, Cheng, Sims and Seemann1999).
Due to the close relationship of photosynthetic capacity to leaf N content (Cabrera-Bosquet et al. Reference Cabrera-Bosquet, Albrizio, Araus and Nogues2009), enhanced N supply is required to match the increase in carbon assimilation at increased CO2 concentrations (Rogers et al. Reference Rogers, Ainsworth and Leakey2009). Whether one chooses to simply increase the N input into cropping systems to overcome CO2 acclimation or not, this will have major impacts on potential yield, grain quality and the environment under increasing CO2 concentrations. In addition, higher temperatures and increased winter precipitation have been predicted to cause reduction in N availability for crops (Doltra et al. Reference Doltra, Lægdsmand and Olesen2014), and increase N leaching to the surface and ground water in Denmark (Jeppesen et al. Reference Jeppesen, Kronvang, Olesen, Audet, Søndergaard, Hoffmann, Andersen, Lauridsen, Liboriussen, Larsen, Beklioglu, Meerhoff, Øzen and Øzkan2011). The limitation of N use by cereals is further amplified by the light use restriction due to excess leaf area that causes self-shading under high N fertilization (Yue et al. Reference Yue, Meng, Zhao, Ye, Zhang, Cui and Chen2012).
When calculating the complex effects of climate change on crop yield, CO2 assimilation and N use, researchers rely on biophysical crop models. These models simulate potential crop performance in response to abiotic factors, e.g. variation in yields in response to climate and soil conditions. In principle, simulation of crop growth is very similar amongst the majority of crop models; dry matter accumulation is solely based on the balance between photosynthesis and respiration and the grain yield is determined by partitioning of total dry matter between seed and vegetative organs. Based crudely on this approach and using specific phenological development stages of a crop, the models successfully simulate the observed yields (Asseng et al. Reference Asseng, Ewert, Rosenzweig, Jones, Hatfield, Ruane, Boote, Thorburn, Rotter, Cammarano, Brisson, Basso, Martre, Aggarwal, Angulo, Bertuzzi, Biernath, Challinor, Doltra, Gayler, Goldberg, Grant, Heng, Hooker, Hunt, Ingwersen, Izaurralde, Kersebaum, Muller, Kumar, Nendel, O'Leary, Olesen, Osborne, Palosuo, Priesack, Ripoche, Semenov, Shcherbak, Steduto, Stockle, Stratonovitch, Streck, Supit, Tao, Travasso, Waha, Wallach, White, Williams and Wolf2013). However, given the potential complexity of changing climate, they must account for several sources of uncertainty for future predictions. The most evident uncertainty source is the extent to which precipitation and temperature patterns will change locally and regionally. Some studies address this issue by implementing gridded weather databases to be used as input in crop models (Licker et al. Reference Licker, Johnston, Foley, Barford, Kucharik, Monfreda and Ramankutty2010; Borgesen & Olesen Reference Borgesen and Olesen2011; Ciais et al. Reference Ciais, Gervois, Vuichard, Piao and Viovy2011; Özdoğan Reference Özdoğan2011). Others use inputs from climate model ensembles coupled with weather data generators (Klein et al. Reference Klein, Holzkämper, Calanca, Seppelt and Fuhrer2013; Doltra et al. Reference Doltra, Lægdsmand and Olesen2014). The second most important uncertainty source is the structural and functional differences between crop models. As opposed to simulation of observed scenarios, yield projections for the 21st century differ greatly and the greatest portion of the variation in projections was attributed to crop models themselves, rather than the weather variables generated by climate models (Asseng et al. Reference Asseng, Ewert, Rosenzweig, Jones, Hatfield, Ruane, Boote, Thorburn, Rotter, Cammarano, Brisson, Basso, Martre, Aggarwal, Angulo, Bertuzzi, Biernath, Challinor, Doltra, Gayler, Goldberg, Grant, Heng, Hooker, Hunt, Ingwersen, Izaurralde, Kersebaum, Muller, Kumar, Nendel, O'Leary, Olesen, Osborne, Palosuo, Priesack, Ripoche, Semenov, Shcherbak, Steduto, Stockle, Stratonovitch, Streck, Supit, Tao, Travasso, Waha, Wallach, White, Williams and Wolf2013). The way in which the crop models handle the increased CO2 and N use in photosynthetic processes and water use efficiency is of particular interest, and varies widely amongst the models. It is therefore necessary to examine the models’ ability to account for the simultaneous effect of temperature, precipitation and CO2 concentration on crop's physiological processes. For example, physiological alterations such as day-length adjustments, vernalization of winter cultivars, or the inclusion of water and nutrient stress in crop models affect model performance significantly (Hay & Porter Reference Hay and Porter2006).
On this background, the objectives of the present study will be: (1) to evaluate the long-term response of winter wheat growth and grain yield under changing climate; (2) to disclose the variation between three commonly used crop models in terms of processing increased CO2 and N-use; and (3) to quantify the uncertainty that can be attributed to the models and their contribution to the overall variations in the estimates.
METHODS AND MATERIALS
Study area
The study area is located in southern Denmark (55°7′N, 10°45′E 33 m a.s.l.) on the island of Funen. In order to run (SWAT) model (details below), spatially explicit inputs were needed. For that reason, a 4·4 ha arable sub-basin was delineated in a watershed in southeastern Funen, called Lillebæk (Pedersen et al. Reference Pedersen, Blicher-Mathiesen, Mejlhede and Grant2010), where the landscape is flat and the soil is of sandy loam glacial tills from the Weichsel glaciation (Breuning-Madsen & Jensen Reference Breuning-Madsen and Jensen1996).
The climate in Lillebæk (and in Denmark in general) is temperate with winter mean temperature around 0 °C and summer mean of 17 °C. The average annual precipitation is approximately 745 mm. The annual potential evapotranspiration (PET) is approximately 550 mm and the actual is approximately 380 mm: PET exceeds precipitation in spring and early summer, leading to depletion of soil water. In late autumn, winter and early spring, 150–400 mm water percolates through the soil. Due to precipitation surplus in late autumn, soil water reserves are replenished (Cappelen Reference Cappelen2012).
Observed weather data and climate scenarios using Ensembles regional climate models
Daily gridded climate data including maximum and minimum temperatures, precipitation, solar irradiance and reference evapotranspiration for a 20-year baseline period (1991–2010) were obtained from the Danish Meteorological Institute (DMI). Observed precipitation data were gridded to 10 km through an interpolation method of approximately 500 rain gauges distributed evenly across Denmark. Temperature and reference evapotranspiration were gridded to 20 km based on scarcer network of weather stations. Precipitation data were corrected to compensate for gauge undercatch due to aerodynamic effects and wetting losses (Allerup et al. Reference Allerup, Madsen and Vejen1997; Stisen et al. Reference Stisen, Højberg, Troldborg, Refsgaard, Christensen, Olsen and Henriksen2012). The observed climate variables that were used in the present study corresponded to the grid that was nearest to Lillebæk.
The climate change signals obtained from global and regional circulation model simulations (GCM–RCM pairings) carried out by the EU – ENSEMBLES project (van der Linden & Mitchell Reference Van Der Linden and Mitchell2009). For the present study, a sub-set of four climate models were selected based on criteria such as highest resolution, longest simulations until the end of the 21st century covering 1951–2100, and consistent climate sensitivity to atmospheric CO2 pressure. The subsets of ENSEMBLES were: (1) ARPEGE and RM5·1 by the National Centre of Meteorological Institute Research, France; (2) ECHAM5 by the Max Planck Institute for Meteorology (MPI), Germany and HIRHAM5 by DMI, Denmark; (3) HadCM3 and HadRM3 by the Met Office Hadley Centre, UK; (4) ECHAM5 by MPI and RCA3 by the Swedish Meteorological and Hydrological Institute. From here onward the GCM–RCM pairings will be denoted by their RCM acronym only.
For the RCM output, the A1B (medium impact) emission scenario was considered (Nakicenovic et al. Reference Nakicenovic, Alcamo, Davis, de Vries, Fenhann, Gaffin, Gregory, Grubler and Jung2000). A1B indicates a world with rapid economic growth and prompt introduction of new and efficient technologies, leading to a global energy system balanced across all sources. In this scenario, the atmospheric CO2 concentration for the next century was estimated to be 460 and 535 ppm for the 2011–2030 period (gradually increasing) and 615 ppm for the rest of the century.
Bias corrections on regional climate model outputs
Regional climate model outputs are subject to systematic errors and biases. They require additional bias correction in order to be implemented in the analyses of climate change impact. Compared with temperature, precipitation shows significant natural variability both temporally and spatially. In order to retain the projected regime characteristics while removing initial climate model bias, a bias correction method was used (Seaby Reference Seaby2013).
For temperature, a bias removal approach was applied to correct daily values via seasonal bias removal factors calculated between the RCM reference period and the observed data. The projections for the precipitation outputs by the GCM–RCM couplings were corrected using distribution-based scaling precipitation (Seaby Reference Seaby2013). In the present study, the evapotranspiration was calculated by the crop models using temperature and solar radiation via the Makkink method (Jacobs & de Bruin Reference Jacobs and De Bruin1998).
Crop models
Three commonly used, process-based, soil–plant–atmosphere models were compared in the present study, as they allowed evaluation of growth processes in detail: (FASSET) version 2.5 (Berntsen et al. Reference Berntsen, Petersen, Jacobsen, Olesen and Hutchings2003), DAISY version 5.18 (Hansen et al. Reference Hansen, Jensen, Nielsen and Svendsen1991) and SWAT version 2012 (Arnold et al. Reference Arnold, Srinivasan, Muttiah and Williams1998).
FASSET simulates crop growth and yield based on soil information, climate input, crop management, water and N availability. Biomass accumulation is predominantly affected by temperature and solar radiation. It also dynamically takes the effect of CO2 concentration into account in the following way; daily calculated dry matter is multiplied by e 0.4537−170.97/CO2ppm . This relationship between CO2 concentration and dry matter accumulation was validated using FACE experiments (Olesen et al. Reference Olesen, Petersen, Berntsen, Hansen, Jamieson and Thomsen2002). While increasing the biomass through increased CO2, the model also assumes that higher CO2 concentrations reduce the transpiration rates as shown by Leakey et al. (Reference Leakey, Ainsworth, Bernacchi, Rogers, Long and Ort2009).
DAISY uses the same inputs as FASSET. The effect of increased CO2 was not, however, included in the standard DAISY. In order to study the effect of climate change, the following modifications were made: photosynthetic carbon assimilation was calculated via a light-saturated CO2 response curve. The light-saturated photosynthetic rate, light use efficiency (the linear phase of the curve) and CO2 compensation point (the moment when carbon assimilation and respiration rates are equal) were allowed to change as the CO2 concentration and temperature increased. The stomatal conductance of a leaf was also affected by the increased CO2 (Borgesen & Olesen Reference Borgesen and Olesen2011). The response of stomatal conductance to CO2 was estimated using the data from Ainsworth et al. (Reference Ainsworth, Davey, Bernacchi, Dermody, Heaton, Moore, Morgan, Naidu, Ra, Zhu, Curtis and Long2002). In modified DAISY, the light-saturated photosynthetic rate decreases linearly with temperatures from 25 to 35 °C.
SWAT is a watershed scale spatial model. Major components of the model include hydrology, weather, erosion, soil temperature, crop growth, nutrients, pesticides and management activities. It comprehensively links hydrology, nutrient cycling and crop growth (Nair et al. Reference Nair, King, Witter, Sohngen and Fausey2011). Because SWAT is a spatial model, a watershed was delineated using the ArcGIS–SWAT interface. Digital elevation model data and a predefined digital stream network obtained from Danish Centre for Environment and Energy were used for delineation (Pedersen et al. Reference Pedersen, Blicher-Mathiesen, Mejlhede and Grant2010). ArcGIS–SWAT then divided the watershed into smaller hydrological response units with homogenous biophysical properties using slope, soil and land-cover maps.
For crop growth simulation, SWAT uses the same inputs as the previous two models. Crop growth is based on the accumulation of heat units. For each day, SWAT initially calculates the potential crop growth assuming optimum conditions. If the potential growing conditions are not met, SWAT identifies that particular day as a stress day and the potential biomass is reduced due to stresses. Carbon dioxide concentration is used to alter the calculations of PET and biomass production. For the latter, SWAT adjusts radiation use efficiency for increased concentrations of CO2, resulting in higher maximum leaf area index and transpiration (Stockle et al. Reference Stockle, Williams, Rosenberg and Jones1992). For the present study, CO2 dependence of stomatal conductance was also taken into account. Doubling of CO2 concentration from the default value resulted in 40% reduction in stomatal conductance, following Easterling et al. (Reference Easterling, Rosenberg, McKenney, Jones, Dyke and Williams1992).
The impact of climate change on winter wheat yield was first assessed, while the increase in CO2 concentration in the atmosphere was ignored. This helped disclose the differences among the crop models when the effect of CO2 is subsequently accounted for.
Calibration of the crop models
The calibration of crop parameters in the three models regarding winter wheat was based on experiments that were carried out in Research Center Foulum in Central Denmark (56°30′N, 9°34′E) between 2002 and 2012. The experiments were conducted on randomized two treatment split–split plots (9 × 12 m2) with three replicates. The main plot treatment was organic or conventional production. The sub-plot treatments were N input at different rates and the choice of mono-crop or intercropping. Data were obtained from the conventional plots where mono-cropping with standard N input was used. The rate at 162 kg N/ha was considered as the standard amount currently applied on Danish fields (Plantedirektoratet 2013).
The observed data included phenological development stages (day of occurrence of emergence and flowering), biomass, dry matter yield, crop N uptake and grain N at harvest. In addition, soil water content, soil mineral N and nitrate (NO3 −) leaching data were collected. The models were calibrated using a step-by-step method. First, the simulation output was fitted to measured soil water content with default winter wheat parameter values under the baseline climate. Concurrently, crop phenology, crop biomass and N contents were fitted. Because the models have been validated numerously using independent datasets, an additional validation procedure was omitted. In the present study, only the phenological development data from the experiments were compared with the simulations. Considering standard management, the phenological development of a crop is not site-dependent within Denmark.
Soil and crop management
The cropping system consisted of rain-fed continuous winter wheat cultivation. The crop management included the following field operations; ploughing, sowing, fertilization and harvest. The dates of operations during the baseline period were based on current farmer applications (Table 1). The dates of future operations were adjusted with increasing temperature, and based on the modifications in warmer sites in Europe (Henriksen et al. Reference Henriksen, Rosenbom, Keur, Olesen, Jørgensen, Kjær, Sonnenborg and Christensen2013).
Dates of field operations for the baseline period (1991–2010) and the future under projected climate change

In simulations, following general practice, the straw was removed at harvest and the stubble incorporated into soil during ploughing. All simulations were run using three rates of N-fertilization: 80, 162 and 240 kg N/ha.
Statistical analyses
The statistical analyses were carried out using mixed-effects analysis in R open source statistical software version 2.1.4.1 with the package lme4 (Bates et al. Reference Bates, Maechler, Bolker, Walker, Christensen, Singmann, Dai, Grothendieck and Green2016). The random slope model was chosen for the analyses, where random variables were not only allowed to have different intercepts, but also different slopes for the main effect. This approach, in ecological studies in particular, was emphasized by Schielzeth & Forstmeier (Reference Schielzeth and Forstmeier2009), who showed that mixed models without random slopes are anticonservative and tend to find many significant results that are actually due to chance.
In the present study, the relationship between grain yield and time (temporal change in temperature, soil moisture) was analysed. As fixed effects, time, CO2 concentration in the atmosphere and N inputs (with and without interaction term) were entered into the statistical model. As random effects, the model included intercepts for RCMs and crop models, as well as random slopes for time by RCM and by crop model. It was assumed that RCMs and crop models would elicit varying yields over time. For the baseline analysis, CO2 concentration in the atmosphere was excluded from the mixed model because it did not change over time.
In addition to grain yield, the response of net evapotranspiration and grain N at harvest. to climate change was also analysed using the same approach including time and N input as fixed effects, with RCM and soil model as random effects. Following the analyses, visual inspection of residual plots did not reveal any obvious deviations from homoscedasticity or normality and as such, P-values were subsequently obtained by likelihood ratio tests of the full model with the effects in question, such as time or N input against the model with interactive effects, and against the model without any effect of fixed factors (null model). The difference between statistical models, and thus the existence of the effect of a factor, or interaction among the factors occurred when P < 0·001.
RESULTS
Baseline weather and climate change projections
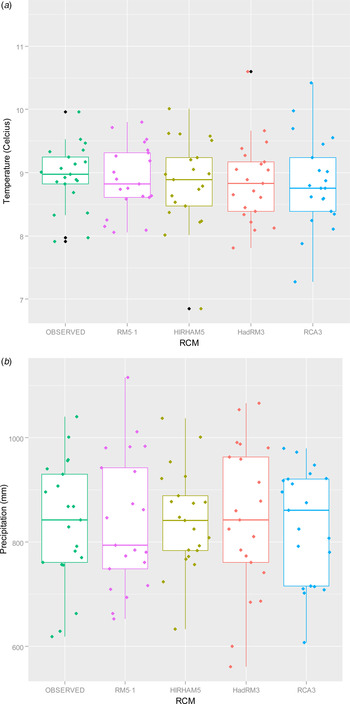
The baseline (1991–2010) observed climate data and RCM-based climate data including temperature and annual precipitation, as well as their distributions, are shown in Fig. 1(a) and (b). The average baseline temperature generated by each RCM was slightly lower than the observed. The temperature variation was slightly higher than observed, in particular, by RCA3 projections (Fig. 1(a)).
(Colour online) (a) The mean temperature of observed baseline and the generated baselines by the four Regional Circulation Models (RCM) (1991–2010). Each box represents the inter-quartile range. The lines represent median, and the dots represent the annual mean of individual years. (b) The average annual precipitation of observed baseline and the generated baselines by the four RCMs. Each box represents the inter-quartile range. The lines represent median, and the dots represent the annual mean of individual years. The synthetic data were generated based on daily observed data from 1951 to 2010.

The baseline average of annual precipitation was best emulated by HIRHAM5 and HadRM3. RM5·1 and RCA3 indicated lower and higher annual average precipitations, respectively (Fig. 1(b)). The variations were similar in both observed and RCM-based data.
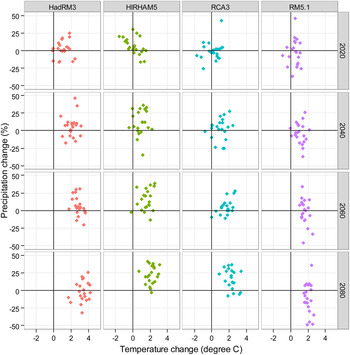
The temperature and precipitation deviations in the future relative to the baseline climate of each RCM are shown in Fig. 2. The dots in the plot represent the difference of a yearly mean annual temperature (x-axis) of one year in a future period from the baseline average, and the difference of annual precipitation (y-axis) of one year in a future period from the baseline average. The future period was divided into four 20-year periods (2020: 2011–2030; 2040: 2031–2050; 2060: 2051–2070; 2080: 2071–2090).
(Colour online) The difference in precipitation and temperature between baseline average (1991–2010) of each regional circulation model (HadRM3, HIRHAM5, RCA3, RM5·1) and their projections in four time periods in the future (2020: 2012–2032; 2040: 2034–2054; 2060: 2056–2076; 2080: 2078–2098). Temperature change is presented in °C, while precipitation change is calculated as the difference of annual sum (%). Positive values indicate increases and negative values indicate decreases from the baseline.

Increasing in air temperature in the future was suggested by all the RCMs. By 2080, HadRM3 indicated the highest temperature increase, on average by 3·3 °C. RCA3, HIRHAM5 and RM5·1 indicated 2·2, 2·1 and 2 °C increase, respectively, during the same period (Fig. 2). The precipitation over the entire projection period was estimated to increase by HIRHAM5, RCA3 and HadRM3, suggesting rises of 15, 7·9 and 5·6%, respectively, relative to the baseline. RM5·1 projections suggested a 2·5% decrease. In general, for the 2060 and 2080 periods, increased precipitation relative to the baseline was estimated. The variation in precipitation from one year to the other was also high. Rainfall in relation to the baseline fluctuated within +75 and –50% throughout the future periods, depending on the RCM and projection period (Fig. 2).
Baseline simulations
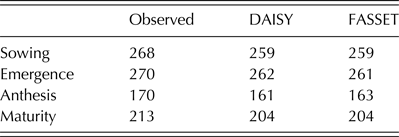
To examine the ability of the models to predict critical growth stages, the estimated dates of occurrence of phenological stages were compared with observations (Table 2). It was not possible to obtain specific phenological growth stages for SWAT, so it is not included in Table 2. The simulated days of anthesis were 9 and 7 days earlier for DAISY and FASSET, respectively (Table 2). However, the average day of sowing was also 9 days earlier in the experimental plots than the models’ setup for the baseline. Maturity was also simulated to occur 9 days earlier by the two models. Considering the relatively early sowing of the experimental plots, the models successfully simulated winter wheat growth during baseline.
Observed days of occurrence of growth stages and the values simulated by two crop models for the baseline period (1991–2010) in winter wheat

Observed numbers indicate the average value of day of occurrence from 2002 to 2012. Simulated numbers indicate the days of occurrence in the baseline period. The SWAT model is not presented, as it was not possible to obtain specific phenological growth stages.
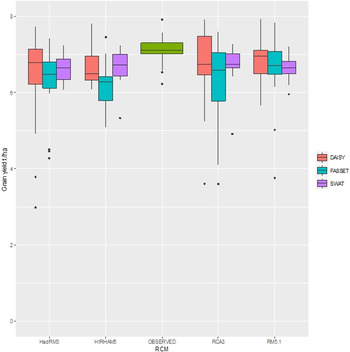
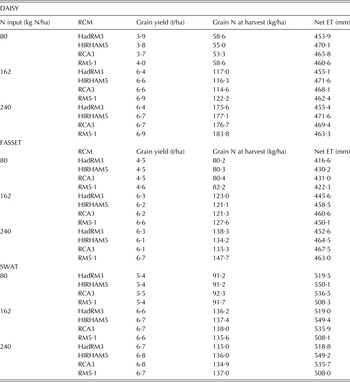
The baseline averages of winter wheat yield, net evapotranspiration and grain N at harvest estimated by the crop models under different RCMs are presented in Table 3. In addition, the average of baseline dry matter yield simulations under four RCMs and the observed baseline average are shown in Fig. 3. The observed yield was based on country-wide data regarding average winter wheat yield, obtained from Statistics Denmark. It was presented to inform the reader on typical dry matter yield rates that can be expected in Denmark under the current climate. Under RCA3-based weather data, DAISY and FASSET yields varied more than the other RCM-based estimations.
(Colour online) Baseline (1991–2010) average yield of winter wheat estimated by DAISY, FASSET and SWAT under four regional circulation model (RCM) estimated climates. Each boxplot represents the inter-quartile range. Lines in the boxplots represent median yield estimations and dots represent outliers. Observed yield corresponds to average dry matter yield under observed climate obtained from the national statistical database of Denmark.

The baseline (1991–2010) averages of grain yield, grain nitrogen (N) and net evapotranspiration (ET) estimated by the crop models DAISY, FASSET and SWAT under four regional circulation model (RCM) projections and three N inputs at 80, 162, 240 kg N/ha

The likelihood comparison test of mixed-effects analyses of the baseline suggested that while time (in which temperature and precipitation varied) did not significantly affect the winter wheat yield, N input did. The analysis further suggested that 0·84 of the total variance of the random variation was attributed to the choice of RCM, while 0·15 of the variance of the random variation was due to crop models, and only the remaining ≈ 0·01 variance was attributed to residual error. For the baseline period, the choice of RCM accounted for the majority of the random variation.
Crop productivity under climate change
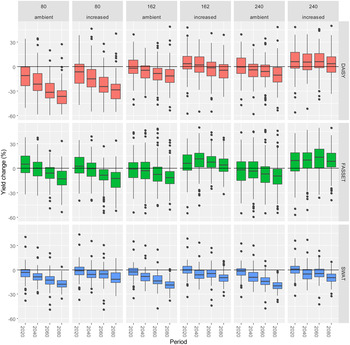
The impact of climate change on winter wheat yield was first assessed while the increase in the CO2 concentration in the atmosphere was ignored. The results showed that without the increase in CO2 concentration, the models indicated severe yield reductions, especially at 80 kg N/ha input relative to the baseline (Fig. 4). The rate at which the yield decreased also increased towards the end of the century.
(Colour online) The difference in winter wheat yield estimated by the models (DAISY, FASSET, SWAT) between their baseline average (1991–2010) and the estimations in four time periods in the future (2020: 2012–2032; 2040: 2034–2054; 2060: 2056–2076; 2080: 2078–2098). The yield estimation of a different year in a 20-year future period was subtracted from the baseline average of estimation of each model 20 times. The result was expressed in percentage change. Each boxplot represents the inter-quartile range. Lines in the boxplots represent median difference and dots represent outliers. Positive values indicate increases and negative values indicate decreases from the baseline. The difference is shown at ambient and elevated CO2 concentrations and at 80, 162 and 240 kg N/ha input.

When increased CO2 concentrations were combined with other climatic variables, the simulated yields by the crop models and across the time periods were characterized by both increases and decreases (Fig. 4). FASSET and DAISY predicted mild increases during 2020 and 2040 at 162 and 240 kg N/ha inputs. SWAT indicated yield decreases at almost all time periods and N inputs.
The likelihood comparison suggested that time, N input and CO2 concentration affected future winter wheat yield estimations significantly. It was found that time and CO2 concentration also affected yield interactively. However, the significance that suggested the interdependence was between P < 0·001 and P < 0·05. The mixed-effect analysis also suggested that there was a significant interdependence between N input and CO2 concentration (P < 0·001) in estimating yields. The analysis indicated that ≈ 0·94 of the total variance of the random variations was due to crop models, while ≈ 0·04 of the variance was due to residual error, and only the remaining ≈ 0·01 variance was attributed to choice of RCM. For the future periods, crop models accounted for the majority of random variation in the estimations of yields.
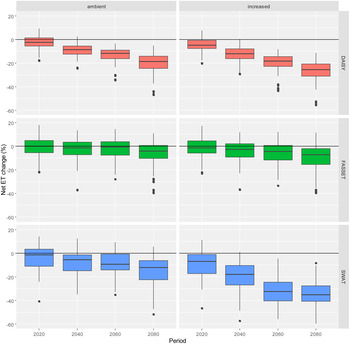
The analysis showed that crop water loss through transpiration was interdependently affected by the CO2 concentration and time. Relative to the baseline, the evapotranspiration rates under increased CO2 concentrations were simulated to be lower than the rates under ambient CO2 concentrations, due to the assumptions on stomatal closure in the crop models (Fig. 5). In addition, there was a significant interdependence between CO2 concentration and time. It was found that N input did not affect evapotranspiration significantly.
(Colour online) The difference in net evapotranspiration (netET) estimated by the models (DAISY, FASSET, SWAT) between baseline average (1991–2010) and the estimations in four time periods in the future (2020: 2012–2032; 2040: 2034–2054; 2060: 2056–2076; 2080: 2078–2098). The net evapotranspiration of a different year in a 20-year future period was subtracted from the baseline average estimation of each model 20 times. The result was expressed in percentage change. Each boxplot represents the inter-quartile range. Lines in the boxplots represent median difference and dots represent outliers. Positive values indicate increases and negative values indicate decreases from the baseline. The difference is shown at ambient and elevated CO2 concentrations.

The rate at which evapotranspiration decreased predicted by SWAT was higher compared with FASSET and DAISY. In the case of water loss estimations, the mixed-effect analysis suggested that ≈ 0·99 of the total variance of random variations was attributed to crop models, while ≈ 0·01 of the variance was due to choice of RCM.
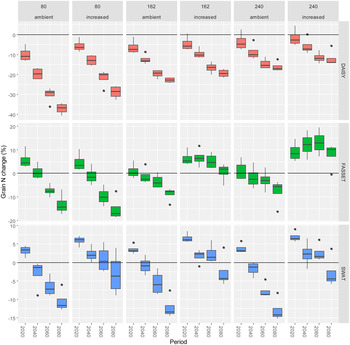
The estimation of grain N at harvest showed a decreasing trend in all the model simulations relative to their baselines. FASSET indicated first an increasing and then a decreasing trend at 240 kg N/ha at increased CO2 concentrations (Fig. 6). At 162 and 240 kg N/ha under increased CO2, FASSET suggested higher N at harvest relative to its baseline. The model simulations showed that while excess N application might lead to increased yields under climate change, it will not lead to increased grain N by the end of century.
(Colour online) The difference in grain N at harvest estimated by the models (DAISY, FASSET, SWAT) between baseline average (1991–2010) and the estimations in four time periods in the future (2020: 2012–2032; 2040: 2034–2054; 2060: 2056–2076; 2080: 2078–2098). The grain N estimation of a different year in a 20-year future period was subtracted from the baseline average estimation of each model 20 times. The result was expressed in percentage change. Each boxplot represents the inter-quartile range. Lines in the boxplots represent median difference and dots represent outliers. Positive values indicate increases and negative values indicate decreases from the baseline. The difference is shown at ambient and increased CO2 concentrations and at 80, 162 and 240 kg N/ha input.

The likelihood comparison of mixed effect analysis indicated that time and N inputs significantly affected the grain N; however, there was no interdependence between the two factors. The crop models accounted for the majority of random variation in estimation of grain N, as ≈ 0·99 of the total variance of random variation was attributed to the crop models.
Crop development
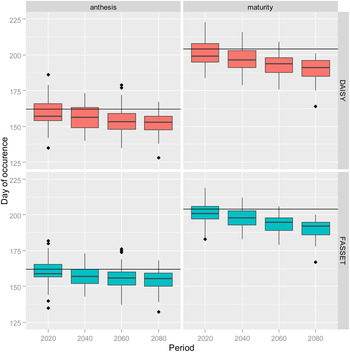
The baseline average anthesis day of occurrences were 161 and 163 as estimated by FASSET and DAISY, respectively (Table 2), and the simulated anthesis days throughout the future periods were tightly aligned in both models (Fig. 7). The simulations demonstrated the effect of increased temperature on crop development. When simulated days of anthesis in the future were compared with the baseline, accelerated development was evident from the outputs of the models. Despite the adjustments in crop and soil management dates for increased temperature, flowering had occurred up to 3 weeks earlier by the end of the century compared with the beginning of the simulation period.
(Colour online) The day of occurrences of anthesis and maturity estimated by DAISY and FASSET in four time periods in the future (2020: 2012–2032; 2040: 2034–2054; 2060: 2056–2076; 2080: 2078–2098). Horizontal black lines represent the observed average day of occurrence in both flowering and maturity during the experiments from 2002 to 2012. The day of occurrence of flowering or maturity of a different year in a 20-year future period was subtracted from the observed day of occurrences 20 times. Each boxplot represents the inter-quartile range. Lines in the boxplots represent median difference and dots represent outliers. Positive values indicate increases and negative values indicate decreases from the observed values. It was not possible to obtain output for phenological data from SWAT; therefore, it is not included in the figure.

DISCUSSION
Crop yield response and productivity
Without the effect of increased CO2, the models agreed that the changes in temperature and precipitation in future climate is expected to decrease yields severely. Kristensen et al. (Reference Kristensen, Schelde and Olesen2011) reported negative effects of increased temperature during grain filling on winter wheat yield in Denmark; they suggested that a rise of 1 °C was predicted to reduce the dry matter yield by approximately 3·5% on loamy soils when the increased CO2 in the atmosphere was not taken into account.
In terms of understanding crop responses to changing climate, the potential impact of increased CO2 on crop productivity must be taken into account as increased CO2 is one of the most important sources of uncertainty for future yield projections (Parry et al. Reference Parry, Rosenzweig, Iglesias, Livermore and Fischer2004; Cho et al. Reference Cho, Falloon, Gornall, Betts and Clark2012; Kersebaum & Nendel Reference Kersebaum and Nendel2014). Yield responses to increased CO2 in free-air CO2 enrichment (FACE) experiments (450–800 ppm) indicated a 9% increase in wheat yield globally (Long et al. Reference Long, Ainsworth, Leakey and Morgan2005). In a meta-analysis based on 59 peer-reviewed papers, Wang et al. (Reference Wang, Feng and Schjoerring2013) also showed that grain yield of wheat increased 14% under the FACE experimental conditions. Relative to FACE estimations, and noting that the FACE experiments were from all across the globe, DAISY estimated a similar increase in winter wheat yield at 162 and 240 kg N inputs. FASSET produced analogous yield estimations, and SWAT predicted yield reductions for Denmark under both increased and ambient CO2 concentrations at all N input rates. The overall simulation results in terms of yield estimations were comparable with earlier studies carried out for Denmark (Kristensen et al. Reference Kristensen, Schelde and Olesen2011; Patil et al. Reference Patil, Laegdsmand, Olesen and Porter2012).
The current results were to some extent aligned to other studies reporting that increased CO2 over a short term accelerates photosynthesis, which is the driving force behind increased growth and yield (Nowak et al. Reference Nowak, Ellsworth and Smith2004; Ainsworth & Rogers Reference Ainsworth and Rogers2007). However, after prolonged exposure (days to weeks) to increased CO2 concentrations, the stimulation of photosynthesis slows down and the crop yield stagnates. Accordingly, the weaker growth and yield estimations of particularly N-deficient C3 plants, as well as wheat crops, due to down-regulation of photosynthesis under increased CO2 have been documented (Drake et al. Reference Drake, Gonzalez-Meler and Long1997; Wall et al. Reference Wall, Adam, Brooks, Kimball, Pinter, LaMorte, Adamsen, Hunsaker, Wechsung, Wechsung, Grossman-Clarke, Leavitt, Matthias and Webber2000). The inhibition of N assimilation under increased CO2, suggesting a decline in shoot N, was also reported recently (Bloom et al. Reference Bloom, Burger, Kimball and Pinter2014). The models used in present study have not systematically accounted for the CO2 acclimation mechanism. The description of physiological processes in crop models and the ability to accurately estimate future yields will probably be improved by, for example, incorporating shoot N assimilation mechanism and its inhibition under increased CO2 that describes down-regulation of photosynthetic processes.
The response of crop phenology in FASSET and DAISY to increased temperature was as expected, because in both models the period until the anthesis was described as a function of temperature and daylength. Between 2071 and 2100, the annual mean temperature in Scandinavia was estimated to increase by 4·16 °C, and the precipitation by 9% (Christensen & Christensen Reference Christensen and Christensen2007). The climate data in the present study suggested approximately the same increase in annual mean temperature and a comparable increase in precipitation. In relation to the beginning of the simulation period, the time of anthesis and maturity in winter wheat was estimated to advance by 17 and 21 days respectively by 2050. The acceleration in the duration of anthesis estimated in the present study was higher compared with Semenov (Reference Semenov2009); Olesen et al. (Reference Olesen, Børgesen, Elsgaard, Palosuo, Rotter, Skjelvåg, Peltonen-Sainio, Börjesson, Trnka, Ewert, Siebert, Brisson, Eitzinger, van Asselt, Oberforster and van der Fels-Klerx2012) and Doltra et al. (Reference Doltra, Lægdsmand and Olesen2014), though the increase in temperature suggested in the present study was also higher. The phenological response to climate change suggested the need for advancing sowing dates in the future. However, it is expected that new wheat genotypes that are better suited to future climatic and soil conditions will be developed.
In response to the changing climate, all the crop models indicated decreases at varying rates in net evapotranspiration. The models assumed partial stomatal closure due to increased CO2 concentrations. This indicated a reduction in water loss from leaves greater than the reduction in CO2 uptake into the leaf, thus an increase in dry matter accumulation per unit of water transpired. This suggests increased water use efficiency under climate change, as also shown by Brouder & Volenec (Reference Brouder and Volenec2008). The rate at which net evapotranspiration decreased in SWAT was in agreement with a FACE study carried out in Braunschweig, Germany (Manderscheid & Weigel Reference Manderscheid and Weigel2007), while the reduction in rate indicated by FASSET and DAISY was slower. Predicting whether the effect of increased CO2 is sufficient to balance the negative effect of water shortage on crop growth in the future requires site-specific field data collected through experiments, e.g. FACE technology.
Grain nitrogen
Grain N at harvest was shown to have decreasing trend in the future. The relatively lower grain N estimated by DAISY compared with other models might be because of the way in which the effect of increased CO2 was integrated into the biomass accumulation (Borgesen & Olesen Reference Borgesen and Olesen2011). Bloom (Reference Bloom2009) showed that the critical nutrient concentration for growth varies by environmental conditions and genotype. This is even more probable under increased CO2, because increased CO2 affects photosynthetic N use efficiency (Leakey et al. Reference Leakey, Ainsworth, Bernacchi, Rogers, Long and Ort2009). Wang et al. (Reference Wang, Feng and Schjoerring2013) reported increased CO2 caused significant decreases in shoot N concentration in wheat. This reduction was attributed to the dilution effect accompanying faster biomass growth; despite the dilution of shoot N, the acquisition of N remained unaffected under increased CO2 suggesting that the increased biomass growth did not result in increased N uptake.
FASSET and SWAT simulated higher grain N estimations compared to DAISY and relative to their baselines with the increased CO2 concentrations. However, it is not possible to conclude the estimations suggested by either of the models are reasonable, because the relationship between shoot N assimilation and increased CO2 concentration is not mechanistically defined in any of the models. Currently, all of the crop models that are being used globally lack the latest knowledge on these processes (Bloom et al. Reference Bloom, Burger, Rubio-Asensio and Cousins2010).
If the decrease in grain N under climate change prevails, and the efforts to breed new cultivars are insufficient, the diminished organic N concentrations will reduce the value of the wheat as food. Certain approaches could mitigate the negative effect of decreased food quality; Lehmann et al. (Reference Lehmann, Finger, Klein, Calanca and Walter2013) found that in winter wheat climate change had a strong impact on fertilization strategies in two locations in Switzerland (6°57′E, 46°49′N, 49 0 m a.s.l and 8°42′E, 47°21′N, 440 m a.s.l): as a general rule, the larger the increase in temperature and decrease in precipitation, the smaller was the optimal total N fertilization amount due to the shortened vegetation period. The climate projections for Denmark, however, points to wetter and warmer climate. Such circumstances would suggest looking into alternative strategies and further exploring the organic N acquisition of plants such as using ammonium as the N source.
CONCLUSIONS
Climate change is one of the most important drivers that will influence future crop production. However, since the environmental conditions for agricultural production vary widely across the globe, climate change is expected to influence crop production differently in different regions. In the present study, the impact of climate change on winter wheat productivity was investigated at a local scale using three commonly applied soil/crop models. Although the approach implemented, linking crop models with climate model projections, has many shortcomings, the results nonetheless revealed complex interactions between a range of agronomic factors (fertilization application, field operation times), site-specific characteristics (soil properties, water retention) and climatic factors (increased temperature, increased CO2) with physiological factors of the crops (shift in time of anthesis, reduction in transpiration rates, changes in crop yields).
It was concluded that the differences in crop models had the largest effects on crop yield and grain N estimations, despite the identical soil parameter and management inputs. The uncertainties in climate change impact assessment that stem from crop models have already been demonstrated (Palosuo et al. Reference Palosuo, Kersebaum, Angulo, Hlavinka, Moriondo, Olesen, Patil, Ruget, Rumbaur, Takáč, Trnka, Bindi, Çaldağ, Ewert, Ferrise, Mirschel, Şaylan, Šiška and Rötter2011; Asseng et al. Reference Asseng, Ewert, Rosenzweig, Jones, Hatfield, Ruane, Boote, Thorburn, Rotter, Cammarano, Brisson, Basso, Martre, Aggarwal, Angulo, Bertuzzi, Biernath, Challinor, Doltra, Gayler, Goldberg, Grant, Heng, Hooker, Hunt, Ingwersen, Izaurralde, Kersebaum, Muller, Kumar, Nendel, O'Leary, Olesen, Osborne, Palosuo, Priesack, Ripoche, Semenov, Shcherbak, Steduto, Stockle, Stratonovitch, Streck, Supit, Tao, Travasso, Waha, Wallach, White, Williams and Wolf2013). In the present study, climate change projections provided by the RCMs were shown to be a minor source of uncertainty in yield predictions, though the period for which the simulation runs were carried out played a further important role. The results highlighted the need to improve crop models by incorporating recent knowledge from FACE experiments, e.g. down-regulation mechanism of photosynthesis (Tausz et al. Reference Tausz, Tausz-Posch, Norton, Fitzgerald, Nicolas and Seneweera2013) and/or plant N metabolism under increased CO2 (Bloom et al. Reference Bloom, Burger, Rubio-Asensio and Cousins2010). The results further emphasized the importance of ensemble modelling approach in projecting both the climate change and crop yields.
This study was funded by the Danish Strategic Research Council for the Centre for Regional Change in the Earth System (Grant number DSF-EnMi 09-066868). The authors acknowledge the contribution by the Danish Meteorological Institute in relation to gridded weather data.