1 Introduction
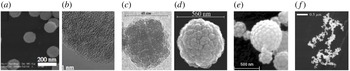
The knowledge of nano-(micro-) particle (commonly referred as ‘dust particles’) parameters in a dusty plasma is essential for a genuine comprehension of the system. Indeed, as the dust particles acquire a net electric charge (usually negative) due to their interactions with the surrounding plasma electrons and ions, the discharge and plasma parameters can be strongly modified. Moreover, the forces acting on the dust particles at the origin of their transport are highly dependent on the local plasma properties and thus retroactively depend on the dust size distribution and number density. In low-pressure gas discharges in which nanoparticles are growing (Boufendi & Bouchoule Reference Boufendi and Bouchoule1994; Samsonov & Goree Reference Samsonov and Goree1999a ,Reference Samsonov and Goree b ; Hong, Berndt & Winter Reference Hong, Berndt and Winter2003; Dominique & Arnas Reference Dominique and Arnas2007; Berndt et al. Reference Berndt, Kovačević, Stefanović, Stepanović, Hong, Boufendi and Winter2009; Kishor Kumar, Couëdel & Arnas Reference Kishor Kumar, Couëdel and Arnas2013) or are injected, the characterisation of the dust particle cloud is always one of the major issues. In many experiments, the measurements of the particle size distribution (PSD) and number density rely on ex situ measurements using electron microscopes. For instance, figure 1 shows electron microscopy images of particles with a wide variety of morphologies, see figure 1: (a,b) compact aggregates, (c–e) porous and cauliflower-shaped particles or (f) even low fractal dimension aggregates.
Electron microscopy images of particle aggregates formed in a DC argon glow discharge: (a) scanning electron microscopy (SEM), (b) high resolution transmission electron microscopy (HR TEM) (tungsten (Kishor Kumar et al. Reference Kishor Kumar, Couëdel and Arnas2013)); an argon–silane low-pressure radio-frequency plasma: (c) transmission electron microscopy (TEM), (d) SEM (silicon (Boufendi & Bouchoule Reference Boufendi and Bouchoule1994)); (e) an aerosol drier (SEM, silicon dioxide (Onofri et al. Reference Onofri, Barbosa, Touré, Woźniak and Grisolia2013)) and (f) sputtering discharge (SEM, aluminium (Samsonov & Goree Reference Samsonov and Goree1999b )).

The evolution of the PSD is usually recovered by collecting particles for different discharge durations. Then, correlations are made with the evolution of the discharge parameters, such as the self-bias voltage and current harmonics in radio-frequency (RF) discharges, the evolution of the cathode bias in direct-current argon glow discharge and, in many experiments, the plasma light emission (Cavarroc et al. Reference Cavarroc, Jouanny, Radouane, Mikikian and Boufendi2006a ,Reference Cavarroc, Mikikian, Perrier and Boufendi b ; Dominique & Arnas Reference Dominique and Arnas2007). However, techniques relying on ex situ measurements are very time consuming and not adapted when real-time in situ knowledge of the PSD and number concentration are required. Recently, real-time evolution of the dust particle size and number concentration was obtained in capacitively coupled RF discharges by following the electric parameters (RF current and voltage, self-bias) and deducing the modification of the plasma impedance (Wattieaux, Mezeghrane & Boufendi Reference Wattieaux, Mezeghrane and Boufendi2011). However, the recovery of the dust particle size and number concentration rely on modelling and a careful calibration of the considered set-up. Moreover, it is restricted to monodisperse spherical particles and cannot properly handle dust particles with complex shapes and polydisperse PSDs. Laser-light scattering on the dust particles is often used to observe in situ and in real time the nanoparticle cloud. It is however very difficult to extract the evolutions of the PSD and number concentration from the scattering signals as they depend on too many parameters (particle size and shape, number concentration, refractive index) and require observations from many angles. Mie-scattering ellipsometry (Gebauer & Winter Reference Gebauer and Winter2003; Hong & Winter Reference Hong and Winter2006; Sebastian et al. Reference Sebastian, Franko, Benjamin and Alexander2015) seems to be a more accurate diagnostic. It consists in measuring the change of polarisation of a polarised laser-light beam scattered by a cloud of nanoparticles. Coupled with extinction, it allows recovering the PSD and the number concentration. It is however experimentally challenging, as it requires accurate measurements of the ellipsometric angles. The iterative data procedure to find the particle parameters (PSD, local density and refractive index) is also not trivial and generally requires strong assumptions making systems with complex-shaped particles and polydisperse PSDs complicated to handle. Otherwise, a reduction of the number of parameters can be considered. For example, the choice of a model providing the time evolution of the particle radius can help in this way. Dust particle size evolution can also be followed by measuring white light scattering at different angles (Mitic et al. Reference Mitic, Pustylnik, Morfill and Kovačević2011). By looking at the ratio of the scattered light at different angles for given wavelengths, it is possible to recover the particle size and the refractive index. This technique however assumes that the particles are spherical and monodisperse.
In this article, we focus on the basic principles, recent achievements and applications of LES, for the in situ measurements of the PSD and (absolute) concentrations of dust clouds levitating in plasmas. LES uses the extinction of a collimated broadband light beam to recover the PSD and the absolute concentrations in number and in volume of dust levitating in plasmas. Under appropriate conditions, it has the capability to detect nanoparticles as small as 20 nm, to handle rather complex-shaped particles as well as multimodal PSDs. LES is effective to measure PSDs and particle concentrations in plasmas, aerosols and colloidal suspensions (Crawley, Cournil & Di Benedetto Reference Crawley, Cournil and Di Benedetto1997; Tamanai et al. Reference Tamanai, Mutschke, Blum and Neuha2006; Rosanvallon et al. Reference Rosanvallon, Grisolia, Counsell, Hong, Onofri, Worms, Winter, Annaratone, Maddaluno and Gasior2008, Reference Rosanvallon, Grisolia, Delaporte, Worms, Onofri, Hong, Counsell and Winter2009; Onofri, Ren & Grisolia Reference Onofri, Ren and Grisolia2009; Onofri, Wozniak & Barbosa Reference Onofri, Wozniak and Barbosa2011; Onofri et al. Reference Onofri, Barbosa, Touré, Woźniak and Grisolia2013; Barbosa et al. Reference Barbosa, Couëdel, Arnas, Kishor Kumar, Pardanaud and Onofri2016). The remainder of this paper is organized as follows. In § 2, the bases of the LES are introduced. Special emphasises are given to the inversion of light extinction signals and all the necessary particle shape, refractive index and light extinction models. Section 3 discusses the parameter range and the limitations of LES. Finally to illustrate the present didactic article proposed in the special collection of the Journal of Plasma Physics on the topic of ‘Diagnostics of dust in plasmas – laboratory, space and fusion plasmas’, two examples of measurements in low-pressure gas discharges are reported in § 4: a direct-current (DC) glow discharge in which particles are growing from the sputtered atoms from a tungsten cathode, and a capacitively-coupled radio-frequency (CC-RF) discharge using a mixture of argon and silane to grow silicon particles.
2 Summary of light extinction spectroscopy (LES) method
2.1 Physical basis and basic equations
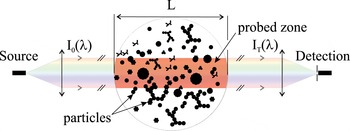
LES consists in analysing the variations of the spectral transmittance of a broadband and collimated light beam passing through the particle cloud to be characterised (Bohren & Huffman Reference Bohren and Huffman1998; Xu Reference Xu2001; Onofri & Barbosa Reference Onofri, Barbosa and Boutier2012b ), see figure 2.
Schematic of the principle of light extinction spectroscopy.

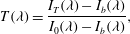
Considering
 $I_{0}$
and
 $I_{T}$
, the spectral intensities of the illuminating and transmitted beams, respectively, the light beam spectral transmittance
 $T(\unicode[STIX]{x1D706})$
, also called transmission, is defined as follows:
 $$\begin{eqnarray}\displaystyle T(\unicode[STIX]{x1D706})=\frac{I_{T}(\unicode[STIX]{x1D706})-I_{b}(\unicode[STIX]{x1D706})}{I_{0}(\unicode[STIX]{x1D706})-I_{b}(\unicode[STIX]{x1D706})}, & & \displaystyle\end{eqnarray}$$
where
 $\unicode[STIX]{x1D706}$
is the considered light wavelength and
 $I_{b}$
accounts for the noise of the detection system (e.g. electronic dark noise of the spectrometer, residual background optical noise of the laboratory and plasma light emission). If the contribution of the light scattered in the forward direction by the dust cloud can be neglected (see §§ 2.5 and 3), the measured transmission is simply an exponentially decreasing function
 $T(\unicode[STIX]{x1D706})=\exp (-\unicode[STIX]{x1D70F})$
of the particle cloud optical thickness
 $\unicode[STIX]{x1D70F}=C_{n}\overline{C_{ext}}L$
.
 $C_{n}$
stands for the particle concentration in number and
 $L$
is the length of the probed zone.
 $\overline{C_{ext}}$
is an integral quantity representing the particle size and spatially averaged extinction of the particle in the probed zone:
 $$\begin{eqnarray}\displaystyle \overline{C_{ext}}=\int _{D_{min}}^{D_{max}}C_{ext}(D,\tilde{m})n(D)\,\text{d}D, & & \displaystyle\end{eqnarray}$$
where
 $C_{ext}$
is the extinction cross-section of a single particle with diameter
 $D$
and complex refractive index
 $\tilde{m}(\unicode[STIX]{x1D706})$
;
 $D_{min}$
and
 $D_{max}$
are the diameter of the smallest and the largest particles, respectively, and
 $n$
the normalised PSD in number.
 $C_{ext}$
is the sum of two distinct contributions:
 $C_{ext}=C_{abs}+C_{sca}$
, with
 $C_{abs}$
and
 $S_{sca}$
the particle absorption and scattering cross-sections, respectively.
For spherical particles,
 $\overline{C_{ext}}$
can be expressed as:
 $$\begin{eqnarray}\displaystyle \overline{C_{ext}}=\int _{D_{min}}^{D_{max}}Q_{ext}(D,\unicode[STIX]{x1D706},\tilde{m})\frac{\unicode[STIX]{x03C0}D^{2}}{4}n(D)\,\text{d}D, & & \displaystyle\end{eqnarray}$$
where
 $Q_{ext}=4C_{ext}/\unicode[STIX]{x03C0}D^{2}$
is the extinction coefficient of a single particle. The concentration in volume
 $C_{v}$
and the normalised PSD in volume
 $v$
can be derived straightforwardly from the corresponding quantities in number:
 $$\begin{eqnarray}\displaystyle \boldsymbol{V}(D)=C_{v}v(D)=\frac{\unicode[STIX]{x03C0}C_{n}}{6}\int _{D_{min}}^{D_{max}}D^{3}n(D)\,\text{d}D, & & \displaystyle\end{eqnarray}$$
with:
 $$\begin{eqnarray}\displaystyle \int _{D_{min}}^{D_{max}}n(D)\,\text{d}D=\int _{D_{min}}^{D_{max}}v(D)\,\text{d}D=1, & & \displaystyle\end{eqnarray}$$
where
 $\boldsymbol{V}$
is the PSD in volume from which the PSD in mass can be deduced if the particle density is known. By replacing number quantities by volume ones and by introducing the constant
 $\unicode[STIX]{x1D6EC}=-3L/2$
, LES transmission equation can be linearised as follows (Onofri et al.
Reference Onofri, Wozniak and Barbosa2011):
 $$\begin{eqnarray}\displaystyle \ln [T(\unicode[STIX]{x1D706}_{i})]=\unicode[STIX]{x1D6EC}\int _{D_{min}}^{D_{max}}Q_{ext}(\unicode[STIX]{x1D706},D,\tilde{m})\frac{\boldsymbol{V}(D)}{D}\,\text{d}D. & & \displaystyle\end{eqnarray}$$
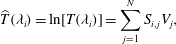
The equation (2.6) is an inhomogeneous Fredholm equation of the first kind (Aster, Borchers & Thurber Reference Aster, Borchers and Thurber2012; Hansen, Pereyra & Scherer Reference Hansen, Pereyra and Scherer2013), which can be discretised to obtain an algebraic relation of the form
 $\widehat{\boldsymbol{T}}=\boldsymbol{S}\boldsymbol{V}$
, with:
 $$\begin{eqnarray}\displaystyle \widehat{T}(\unicode[STIX]{x1D706}_{i})=\ln [T(\unicode[STIX]{x1D706}_{i})]=\mathop{\sum }_{j=1}^{N}S_{i,j}V_{j}, & & \displaystyle\end{eqnarray}$$
where the quantity to be determined is a vector
 $\boldsymbol{V}$
with elements
 $V_{j}$
and
 $j=1,2,\ldots ,N$
.
 $N$
is the number of size classes (i.e. bins) used to discretise the PSD.
 $\unicode[STIX]{x1D64E}$
is a
 $M\times N$
matrix called (abusively) the extinction matrix. It is a discrete form of the kernel of the integral equation (2.6). Each of its elements
 $S_{i,j}$
represents the extinction coefficient divided by the particle diameter of the particle size class
 $j$
for the wavelength
 $\unicode[STIX]{x1D706}_{i}$
, with
 $i=1,2,\ldots M$
.
 $M$
is the number of wavelengths (or spectral bands) when discretising the logarithm of the transmittance spectrum (which vector form is noted herein
 $\widehat{\boldsymbol{T}}$
, with elements
 $\widehat{T}_{i}$
, to simplify the notation). The
 $M\times N$
elements of
 $\unicode[STIX]{x1D64E}$
are averaged over the width
 $\unicode[STIX]{x1D6FF}_{D}$
of the size classes and the width
 $\unicode[STIX]{x1D6FF}_{\unicode[STIX]{x1D706}}$
of the spectral bands. If
 $\unicode[STIX]{x1D6FF}_{D}$
and
 $\unicode[STIX]{x1D6FF}_{\unicode[STIX]{x1D706}}$
are constant, a simple midpoint rule can be used for the numerical quadrature (Hansen et al.
Reference Hansen, Pereyra and Scherer2013):
 $$\begin{eqnarray}\displaystyle S_{i,j}=\frac{\unicode[STIX]{x1D6EC}}{\unicode[STIX]{x1D6FF}_{D}\unicode[STIX]{x1D6FF}_{\unicode[STIX]{x1D706}}}\int _{D_{j}-\unicode[STIX]{x1D6FF}_{D}/2}^{D_{j}+\unicode[STIX]{x1D6FF}_{D}/2}\int _{\unicode[STIX]{x1D706}_{i}-\unicode[STIX]{x1D6FF}_{\unicode[STIX]{x1D706}}/2}^{\unicode[STIX]{x1D706}_{i}+\unicode[STIX]{x1D6FF}_{\unicode[STIX]{x1D706}}/2}Q_{ext}(\unicode[STIX]{x1D706}_{i},D_{j},\tilde{m})\frac{\boldsymbol{V}(D)}{D}\,\text{d}\unicode[STIX]{x1D706}\,\text{d}D. & & \displaystyle\end{eqnarray}$$
This quadrature method works fine as long as
 $\unicode[STIX]{x1D6FF}_{\unicode[STIX]{x1D706}}$
and
 $\unicode[STIX]{x1D6FF}_{D}$
remain small (i.e. the variations of
 $Q_{ext}(\unicode[STIX]{x1D706},D,\tilde{m})\boldsymbol{V}(D)/D$
are negligible over the corresponding ranges). This implies that the dimensions and the condition number of the matrix
 $\unicode[STIX]{x1D64E}$
remain relatively large, which is not suitable for the inversion step (see § 2.2). Depending on the application, it can be necessary to employ quadrature rules using more complex interpolating functions than a mean value shown in equation (2.8), like the trapezoidal rule (linear fit) or rules based on spline functions (Hansen et al.
Reference Hansen, Pereyra and Scherer2013), etc.
Equations (2.1), (2.2) are valid for any particle shape, while equation (2.3) is only valid for spherical particles. As a matter of fact, a parameter like the diameter is not necessarily sufficient, or the unique way, to classify non-spherical particles. It is agreed that the diameter of roughly spherical particles refers to the diameter of spherical particles having the same projected cross-section, surface, volume or ratio of volume and surface (Mishchenko, Hovenier & Travis Reference Mishchenko, Hovenier and Travis2000). In that case, the PSD retrieved from LES measurements is well defined and directly comparable with other results (TEM analyses for instance). However, these results may be not appropriate to estimate other properties of the particles (e.g. internal porosity and specific surface). For example, in the case of dense aggregates, it can be more appropriate to classify them in terms of number of monomers or radii of gyration (see § 2.3 and figure 4).
2.2 Regularisation and inversion procedure
To retrieve the PSD and particle concentration from LES measurements, it is necessary to solve the algebraic equation
 $\widehat{\boldsymbol{T}}=\boldsymbol{S}\boldsymbol{V}$
. Unfortunately, the direct solution
 $\boldsymbol{V}\equiv (\boldsymbol{S}^{t}\boldsymbol{S})^{-1}\boldsymbol{S}^{t}\widehat{\boldsymbol{T}}$
(where the superscripts
 $t$
and
 $-1$
denote the matrix transpose and inverse operations respectively) is not of practical use since it is an ill conditioned problem (Tikhonov et al.
Reference Tikhonov, Goncharsky, Stepanov and Yagola1995; Hansen Reference Hansen1998). The condition number of
 $\unicode[STIX]{x1D64E}$
is always so large that even numerical computation round-off errors are enough to strongly disturb the solution. Experimental LES spectra being inevitably contaminated by various noise sources (electronic, residual plasma emission, etc.), obtaining a direct solution is unthinkable. Writing equation (2.6) in terms of volume quantities rather than number ones helps in minimizing the condition number of
 $\unicode[STIX]{x1D64E}$
. However this is still not sufficient to obtain a stable and reliable solution. The problem must be regularised. In other words, more physical inputs (i.e. a priori) and mathematical constraints must be injected into the problem. The literature on regularisation methods is extremely dense and various solutions have been proposed (Hansen Reference Hansen1994; Tikhonov et al.
Reference Tikhonov, Goncharsky, Stepanov and Yagola1995). In the following, we summarize the principles of two methods that have been used to investigate particle growth in different low-pressure gas discharges, see § 4 for applications (Onofri et al.
Reference Onofri, Wozniak and Barbosa2011; Barbosa et al.
Reference Barbosa, Couëdel, Arnas, Kishor Kumar, Pardanaud and Onofri2016).
A regularisation method based on a dependant model assumes the shape of the PSD to be determined. This is clearly a strong assumption, which can lead to serious errors if the a priori is too far from the real solution. Conversely, since this method imposes a strong constraint on the solution that is sought, it is rather robust regarding the experimental noise and can be used to directly determine the PSD in number for instance. Such a method can be implemented with a non-negativity-constrained least squares algorithm (since all elements of a PSD are positive,
 $V>0$
) and a parametric estimator (also called a performance function) quantifying the quality of the reconstruction (Onofri et al.
Reference Onofri, Barbosa, Touré, Woźniak and Grisolia2013; Barbosa et al.
Reference Barbosa, Couëdel, Arnas, Kishor Kumar, Pardanaud and Onofri2016). For example, in the case of a two-parameter distribution, the mean diameter
 $\overline{D}$
and the corresponding standard deviation
 $\unicode[STIX]{x1D70E}_{D}$
are the two unknowns of the problem. The latter can be determined iteratively using a
 $\unicode[STIX]{x1D712}^{2}$
-test for the parametric estimation. In that case, the quantity to minimize may be expressed as:
 $$\begin{eqnarray}\displaystyle \unicode[STIX]{x1D712}^{2}(\overline{D},\unicode[STIX]{x1D70E}_{D})=\mathop{\sum }_{i=1}^{N}\left(\frac{\widehat{T}_{i}-S_{i,j}V_{j}(D_{j};\overline{D},\unicode[STIX]{x1D70E}_{D})}{\unicode[STIX]{x1D70E}_{\unicode[STIX]{x1D714}}(\widehat{T}_{i})}\right), & & \displaystyle\end{eqnarray}$$
where
 $\widehat{T}_{i}$
represents an element of the experimental spectrum and the product
 $S_{i,j}V_{j}$
the corresponding modelled quantity obtained for the iteration parameters
 $\overline{D}$
and
 $\unicode[STIX]{x1D70E}_{D}$
. The statistical weighting coefficients
 $\unicode[STIX]{x1D70E}_{\unicode[STIX]{x1D714}}(\widehat{T}_{i})$
allow us to give a higher weight to the spectral bands in which we are more confident. They can be estimated from the analysis of the signal-to-noise ratio (SNR) or, more simply, from the standard deviation of a set of LES spectra. If not possible, they are set to be equal to unity. Many fitting models can be used a priori, such as the normal, the log-normal, the gamma distribution, etc. (Mishchenko et al.
Reference Mishchenko, Hovenier and Travis2000; Xu Reference Xu2001). The normal distribution is commonly set-up for quasi-monodisperse particulate media, while the log-normal is preferably used for polydisperse systems. As a rule, it is also required to iterate on the limits
 $D_{min}$
and
 $D_{max}$
. This is time consuming and hazardous when there is little knowledge about the particle cloud properties. To overcome this difficulty,
 $D_{min}$
and
 $D_{max}$
are often imposed via the definition of a cutoff, or an integral convergence criteria, on the PSD (Mishchenko et al.
Reference Mishchenko, Hovenier and Travis2000; Onofri et al.
Reference Onofri, Barbosa, Touré, Woźniak and Grisolia2013). In the case of the log-normal distribution, these two parameters can be defined as particle sizes for which the PSD equals 0.1 %, i.e.
 $\{D_{min};D_{max}|n_{\text{ln}N}(D_{S};\unicode[STIX]{x1D707},\unicode[STIX]{x1D70E})/\exp (\unicode[STIX]{x1D707}-\unicode[STIX]{x1D70E}^{2})=0.001\}$
(Onofri et al.
Reference Onofri, Barbosa, Touré, Woźniak and Grisolia2013). When a bimodal distribution is expected for instance, the iteration is performed on the parameters of the two individual distributions,
 $\overline{D}_{1},\unicode[STIX]{x1D70E}_{D,1}$
and
 $\overline{D}_{2},\unicode[STIX]{x1D70E}_{D,2}$
, plus on the relative weight
 $\unicode[STIX]{x1D6FC}$
of the two modes:
 $n(D;\overline{D}_{1},\unicode[STIX]{x1D70E}_{D,1},\overline{D}_{2},\unicode[STIX]{x1D70E}_{D,2},\unicode[STIX]{x1D6FC})=\unicode[STIX]{x1D6FC}n(D;\overline{D}_{1},\unicode[STIX]{x1D70E}_{D,1})+(1-\unicode[STIX]{x1D6FC})n(D;\overline{D}_{2},\unicode[STIX]{x1D70E}_{D,2})$
with
 $0<\unicode[STIX]{x1D6FC}<1$
(Barbosa et al.
Reference Barbosa, Couëdel, Arnas, Kishor Kumar, Pardanaud and Onofri2016). Note that the two distributions are not necessarily of the same type and they can overlap (see 4.1).
The constrained linear inversion method exists in various forms: Tikhonov regularisation (Tikhonov et al.
Reference Tikhonov, Goncharsky, Stepanov and Yagola1995), truncated singular value decomposition (Hansen et al.
Reference Hansen, Pereyra and Scherer2013), Phillips–Twomey (Phillips Reference Phillips1962; Twomey Reference Twomey1963, Reference Twomey1979) methods, …which are all equivalent (Hansen Reference Hansen1998). For historical reasons, the Phillips–Twomey method is regularly implemented in the field of optical particle characterisation (Wyatt et al.
Reference Wyatt, Schehrer, Phillips, Jackson, Chang, Parker, Phillips and Bottiger1988; Xu Reference Xu2001; Sentis et al.
Reference Sentis, Onofri, Dhez, Laurent and Chauchard2015; Glasse, Riefler & Fritsching Reference Glasse, Riefler and Fritsching2015). This method allows for more measurements than unknowns (i.e.
 $N<M$
), but the opposite is also possible (i.e.
 $N>M$
) (Hansen Reference Hansen1998). With the original Phillips–Twomey method, the solution can be directly obtained from a single matrix inversion:
 $$\begin{eqnarray}\displaystyle \unicode[STIX]{x1D651}=(\boldsymbol{S}^{t}\boldsymbol{S}+\unicode[STIX]{x1D6FE}\boldsymbol{H})^{-1}\boldsymbol{S}^{t}\widehat{\boldsymbol{T}}, & & \displaystyle\end{eqnarray}$$
where
 $\unicode[STIX]{x1D643}$
is a
 $M\times M$
smoothing matrix and
 $\unicode[STIX]{x1D6FE}$
a smoothing parameter (also called Lagrange multiplier). The uncertainties of non-correlated measurements can be taken into account via a diagonal matrix
 $\unicode[STIX]{x1D64E}_{\unicode[STIX]{x1D714}}$
whose elements are, for instance, the quantities
 $1/\unicode[STIX]{x1D70E}_{\unicode[STIX]{x1D714}}(\widehat{T}_{i})$
. In the latter case, the solution is obtained from:
 $$\begin{eqnarray}\displaystyle \unicode[STIX]{x1D651}=(\boldsymbol{S}^{t}\boldsymbol{S}_{\unicode[STIX]{x1D714}}^{-1}\boldsymbol{S}+\unicode[STIX]{x1D6FE}\boldsymbol{H})^{-1}\boldsymbol{S}^{t}\boldsymbol{S}_{\unicode[STIX]{x1D714}}^{-1}\widehat{\boldsymbol{T}}. & & \displaystyle\end{eqnarray}$$
The vector
 $(\boldsymbol{S}^{t}\boldsymbol{S}_{\unicode[STIX]{x1D714}}^{-1}\boldsymbol{S}+\unicode[STIX]{x1D6FE}\boldsymbol{H})^{-1}$
provides an estimation of the uncertainties in the solution (King et al.
Reference King, Byrne, Herman and Reagan1978). Although equation (2.10) provides an explicit solution to the problem, it is preferable to minimize, in the least square sense, the difference between the measured and the modelled quantities:
 $$\begin{eqnarray}\displaystyle \unicode[STIX]{x1D651}=\{\unicode[STIX]{x1D651}|\underset{V>0}{\text{Min}}\{|(\boldsymbol{S}^{t}\boldsymbol{S}+\unicode[STIX]{x1D6FE}\boldsymbol{H})\unicode[STIX]{x1D651}-\boldsymbol{S}^{t}\widehat{\boldsymbol{T}}|^{2}\}\}. & & \displaystyle\end{eqnarray}$$
Depending on the problem and the a priori knowledge available on the expected PSD (e.g. sharpness or smoothness) the identity matrix or an approximation to the first or second derivative operator can be chosen for
 $\unicode[STIX]{x1D643}$
(Hansen Reference Hansen1994; Glasse et al.
Reference Glasse, Riefler and Fritsching2015). The analysis of numerically generated synthetic LES spectra (assuming
 $\boldsymbol{V}$
, and calculating
 $\boldsymbol{S}\boldsymbol{V}$
) is used for this purpose. The selection of the smoothing parameter is more difficult. Excessive values of
 $\unicode[STIX]{x1D6FE}$
tend to over regularise the solution (which is then excessively low-pass filtered), while too small values of this parameter cannot stabilize the solution (which takes the form of a sum of Dirac-like distributions). Over the different methods available to estimate the optimal value of the regularisation parameter (Hansen Reference Hansen1998; Aster et al.
Reference Aster, Borchers and Thurber2012), the L-Curve method (Hansen Reference Hansen1994; Hansen et al.
Reference Hansen, Pereyra and Scherer2013) is certainly the more comprehensive: the norm of the retrieved solution
 $|\boldsymbol{V}_{\unicode[STIX]{x1D6FE}}|^{2}$
is plotted versus the residual norm
 $|(\boldsymbol{S}^{t}\boldsymbol{S}+\unicode[STIX]{x1D6FE}\boldsymbol{H})\boldsymbol{V}-\boldsymbol{S}^{t}\widehat{\boldsymbol{T}}|^{2}$
for a large range of values for
 $\unicode[STIX]{x1D6FE}$
. The result is expected to take the form of a L-shaped curve. The optimal value of
 $\unicode[STIX]{x1D6FE}$
is the one minimizing at the same time the norm of the retrieved solution and the norm of the residual, i.e. the value associated with the corner of the L-curve obtained (Hansen Reference Hansen1994).
2.3 Particle shape and refractive index models
The particle morphology is a key factor for many obvious reasons, and this is particularly true for LES, since it is an input to calculate the extinction matrix with electromagnetic models. As pointed out in the introduction (§ 1), in reactive plasmas, dust particle clouds are often composed of monomers and their aggregates. To describe these particles, most studies used the spherical shape model. This choice can be justified when monomers are roughly spherical and their aggregates highly compact. It might be however inappropriate to choose this particle shape model when nothing is known about the particle or when a more realistic model would involve too many unknowns.
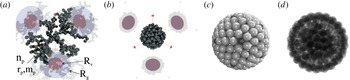
Numerically generated aggregates. Fractal aggregates with the same number of monomers (
 $n_{p}=300$
) and radius in volume (
 $R_{v}$
), but different fractal dimensions (a)
 $D_{f}=2.00$
and with (b)
 $D_{f}=2.85$
(Onofri et al.
Reference Onofri, Wozniak and Barbosa2011). Buckyball-shaped aggregate of
 $162$
monomers with a regular pentagonal–hexagonal surface lattice and a three-dimensional hexagonal compact internal structure: (c) reflection and (d) transmission images (Onofri et al.
Reference Onofri, Barbosa, Touré, Woźniak and Grisolia2013).

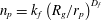
A simple and relatively inexpensive approach to model aggregates of monomers is to use the so-called fractal aggregate equation:
 $n_{p}=k_{f}\left(R_{g}/r_{p}\right)^{D_{f}}$
(Witten & Sander Reference Witten and Sander1981; Theiler Reference Theiler1990; Sorensen Reference Sorensen2001; Wozniak Reference Wozniak2012; Wozniak et al.
Reference Wozniak, Onofri, Barbosa, Yon and Mroczka2012). In the latter power-law equation,
 $n_{p}$
and
 $r_{p}$
stand for the number and radius of monomers within the aggregate respectively, and
 $k_{f}$
,
 $D_{f}$
and
 $R_{g}$
are the aggregate prefactor, fractal dimension and radius of gyration (i.e. monomers mean square distance from the centre of mass of the whole aggregate) respectively. There exist several approaches to numerically generate fractal-like aggregates (Meakin Reference Meakin1983; Jullien & Botet Reference Jullien and Botet1987; Theiler Reference Theiler1990; Kaye Reference Kaye1994). A tuneable diffusion limited aggregation (DLA) model (Witten & Sander Reference Witten and Sander1981) is probably the most efficient method to produce aggregates with well-defined parameters. A code such as DLA 1.13 (Mroczka, Wozniak & Onofri Reference Mroczka, Wozniak and Onofri2012; Wozniak Reference Wozniak2012; Wozniak & Onofri Reference Wozniak and Onofri2012; Wozniak et al.
Reference Wozniak, Onofri, Barbosa, Yon and Mroczka2012) allows, for instance, the simulation of fractal aggregates composed of thousands of polydisperse, multi-material and overlapping (i.e. partially melt) monomers. This code can also provide reflection (e.g. SEM-like) or transmission (e.g. TEM-like) images of these aggregates (Wozniak et al.
Reference Wozniak, Onofri, Barbosa, Yon and Mroczka2012). As an example, figure 3(a,b) show for two synthetic aggregates composed of the same number of monomers: three-dimensional (3-D) rendering views (with the open-source software POV Ray (POV-Ray 2010)) and native 2-D projections showing the radius of gyration and the radius in volume of the equivalent spheres. The monomers observed in plasma systems are obviously not always spherical and their aggregates not well described by the fractal equation (e.g. crystal-like, flake-like,
 $\,\ldots$
) (Sharpe, Petti & Bartels Reference Sharpe, Petti and Bartels2002; Onofri et al.
Reference Onofri, Ren and Grisolia2009). In that case, it is necessary to develop a dedicated particle shape model using the analysis of SEM/TEM images. It can be based on some dendrite growth mechanisms (Aster et al.
Reference Aster, Borchers and Thurber2012), a Gaussian sphere model (Muinonen et al.
Reference Muinonen, Nousiainen, Fast, Lumme and Peltoniemi1996) or simple geometrical considerations (Onofri et al.
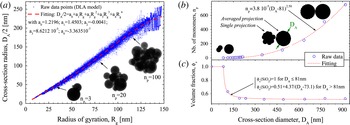
Reference Onofri, Barbosa, Touré, Woźniak and Grisolia2013). Figure 3(c,d) show for instance the reflection and transmission images of a buckyball shaped aggregate exhibiting a regular pentagonal–hexagonal surface lattice, see also figure 1(e). The outputs of all particle shape models are also useful to link together the different parameters of the aggregates (as shown in figure 4). The inset images in figure 4(a) represent 2-D projections of three particular fractal aggregates over the
 $25\,000$
generated to obtain a polynomial regression model relating the aggregate cross-section diameter
 $D_{A}=2\sqrt{A/\unicode[STIX]{x03C0}}$
to their radius of gyration (Onofri et al.
Reference Onofri, Barbosa, Wozniak, Vrel and Grisolia2012) where
 $A$
stands for the statistically averaged 2-D projected area of aggregates having the same morphological parameters. Figure 4(b,c) show similar results for buckyball shaped aggregates with, in addition, the evolution of their volume fraction
 $\unicode[STIX]{x1D719}_{V}$
in monomers (
 $1-\unicode[STIX]{x1D719}_{V}$
represents the aggregate porosity) (Onofri et al.
Reference Onofri, Barbosa, Touré, Woźniak and Grisolia2013).
Numerically generated aggregates – polynomial regression models: (a) evolution of the cross-section radius of aggregates with the same fractal dimension (
 $D_{f}=2.85$
) versus their gyration radii (Onofri et al.
Reference Onofri, Barbosa, Wozniak, Vrel and Grisolia2012); (b) evolution of the number of monomers and (c) the volume fraction of buckyball-shaped aggregates versus their cross-section diameter (Onofri et al.
Reference Onofri, Barbosa, Touré, Woźniak and Grisolia2013).

The particle complex refractive index
 $\tilde{m}$
is also a key input of electromagnetic models. It is a crucial parameter for all light-based diagnostics, especially for LES. In fact, in contrast to multi-angle or ellipsometry techniques (Xu Reference Xu2001; Hong & Winter Reference Hong and Winter2006; Sentis et al.
Reference Sentis, Onofri, Dhez, Laurent and Chauchard2015), LES requires the knowledge of the particle material refractive index over a large spectral bandwidth and not only for a single (laser) wavelength. This is clearly one of the main drawbacks of this technique, in particular when dealing with multi-component materials such as those produced in fusion plasma devices for instance (Sharpe et al.
Reference Sharpe, Petti and Bartels2002; Onofri et al.
Reference Onofri, Ren and Grisolia2009). Different strategies exist for solving this issue. Firstly, it is possible to collect in the literature and in on-line databases the refractive index spectra of various materials (i.e. Be, Si, SiC, W,
 $\text{WO}_{3},\ldots$
) (Palik Reference Palik1997; Jäger et al.
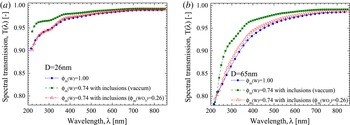
Reference Jäger, Il’in, Henning, Mutschke, Fabian, Semenov and Voshchinnikov2003; SOPRA 2008). This procedure requires some a priori knowledge, or some prior analysis of the composition of particle samples. The particle refractive index is assumed to be identical to the one of the bulk material. Secondly, multi-component materials can be modelled using effective medium approximations like the Maxwell–Garnett or the Bruggeman relations (Bohren Reference Bohren1986; Bohren & Huffman Reference Bohren and Huffman1998). These approximations provide effective electrical permittivities (an thus, the refractive indexes) for materials with embedded inclusions. The latter are expected to be small compared to the wavelength and with moderate relative refractive indexes. These approximations, whose validities were recently demonstrated (Mishchenko, Dlugach & Zakharova Reference Mishchenko, Dlugach and Zakharova2014), were used, to evaluate changes in the scattering properties of carbonaceous particles contaminated by an increasing volume fraction of spherical inclusions of tungsten (Onofri et al.
Reference Onofri, Ren and Grisolia2009) or the influence of the porosity or a partial oxidation of tungsten particles (Barbosa et al.
Reference Barbosa, Couëdel, Arnas, Kishor Kumar, Pardanaud and Onofri2016), see figure 5. Thirdly, this problem can also be partly handled by the scattering models themselves by deriving the effective refractive index of coated particles (Berndt et al.
Reference Berndt, Kovačević, Stefanović, Stepanović, Hong, Boufendi and Winter2009), aggregates of spheres or electrical dipoles with different compositions (Onofri et al.
Reference Onofri, Ren and Grisolia2009). Fourthly, the particle refractive index spectra can be determined experimentally by measuring the spectral hemispheric-reflectivity (ideally from deep UV to far infrared) of a particle sample. The complex refractive index spectra can be then reconstructed using Kramers–Kronig integrals (Ku & Felske Reference Ku and Felske1986). Finally, the PSD can be used as an input of the inversion method that is performed to retrieve the particle refractive index spectra.
Numerical prediction with the Lorenz–Mie theory and Maxwell–Garnett effective medium approximation of the transmission of a cloud of monodisperse spherical particles with diameter (a)
 $D=26~\text{nm}$
, (b)
 $D=65~\text{nm}$
. Three particle compositions are considered: pure tungsten (mass fraction,
 $\unicode[STIX]{x1D719}_{m}(W)=1$
), porous tungsten (e.g. vacuum or gas inclusions,
 $\unicode[STIX]{x1D719}_{m}(W)=0.74$
), tungsten with tungsten oxide inclusions (
 $\unicode[STIX]{x1D719}_{m}(W)=0.74,\unicode[STIX]{x1D719}_{m}(WO_{3})=0.26$
). The particle concentration is fixed to
 $C_{n}=10^{13}~\text{m}^{-3}$
for a probing length of
 $L=1~\text{m}$
(Barbosa et al.
Reference Barbosa, Couëdel, Arnas, Kishor Kumar, Pardanaud and Onofri2016).

2.4 Calculation of the extinction matrix
The calculation of the so-called extinction matrix requires an accurate modelling of the particle absorption and scattering cross-sections. For this, as already mentioned, it is necessary to have appropriate particle shape and refractive index models, but also an accurate electromagnetic model. In what follows, a brief review is performed on the principal models relevant for LES (i.e. particle with size parameters in the range
 $x=\unicode[STIX]{x03C0}D/\unicode[STIX]{x1D706}:0.05{-}30$
) (Bohren & Huffman Reference Bohren and Huffman1998; Wriedt Reference Wriedt1998, Reference Wriedt2010; Onofri & Barbosa Reference Onofri, Barbosa and Boutier2012a
).
The Rayleigh–Debye–Gans approximation for fractal aggregates (RDG-FA) is a generalization of the well-known Rayleigh and Rayleigh–Debye–Gans approximations for optically soft scatterers (
 $x\equiv kR_{g}=1$
and
 $|\tilde{m}-1|=1$
, with
 $k=2\unicode[STIX]{x03C0}/\unicode[STIX]{x1D706}$
). As an approximation, it gives simple analytic expressions for the cross-sections of fractal aggregates, with
 $C_{abs}^{a}=n_{p}C_{abs}^{p}$
for absorption and
 $C_{sca}^{a}=n_{p}^{2}C_{sca}^{p}g(k,R_{g},D_{f})$
for scattering, (Dobbins & Megaridis Reference Dobbins and Megaridis1991; Guinier et al.
Reference Guinier, Fournet, Walker and Yudowitch1995; Farias, Köylü & Carvalho Reference Farias, Köylü and Carvalho1996) where the superscript
 $a$
refers to the aggregate properties and the sub(super)script
 $p$
refers to the properties of a single monomer.
 $g(k,R_{g},D_{f})$
is a structure factor whose form depends on whether the power-law regime is reached or not (i.e. the aggregate is sufficiently large with respect to the wavelength) (Mroczka et al.
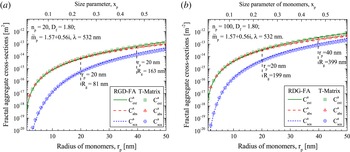
Reference Mroczka, Wozniak and Onofri2012). As RDG-FA neglects multiple scattering within the aggregates, its accuracy strongly decreases for high fractal dimension, e.g. compact aggregates like the ones shown in figure 1(a–e). Nonetheless, as shown in figure 6, when compared to a rigorous electromagnetic model, RDG-FA provides reasonably accurate predictions for low fractal dimension aggregates (Chakrabarty Reference Chakrabarty, Moosmüller, Arnott, Garro, Tian, Slowik, Cross, Han, Davidovits and Onasch2009; Wozniak et al.
Reference Wozniak, Onofri, Barbosa, Yon and Mroczka2012), e.g. figure 1(f). It is also computationally much more effective than rigorous electromagnetic models, e.g. it takes only few seconds with RDG-FA to get the results reported in figure 6 when tens of hours are required with the T-Matrix (see below).
Comparison between RGD-FA and T-Matrix calculations (Wozniak Reference Wozniak2012) for the cross-sections of carbonaceous aggregates of the same composition and morphology:
 $\tilde{m}=1.56+0.57\text{i}$
,
 $\unicode[STIX]{x1D706}=532~\text{nm}$
,
 $D_{f}=1.80$
, for increasing radius of monomers with (a)
 $n_{p}=20$
and (b)
 $n_{p}=100$
.

The Lorenz–Mie theory (LMT, e.g. Bohren & Huffman (Reference Bohren and Huffman1998)) solves the basic problem of the scattering of a plane electromagnetic waves by a non-magnetic, isotopic and homogeneous spherical particle (called a ‘Mie scatterer’). LMT has been extended during the last decades to account for arbitrary-shaped beams as well as multi-layered or chiral spheres (Borghese, Denti & Saija Reference Borghese, Denti and Saija1994; Onofri, Gréhan & Gouesbet Reference Onofri, Gréhan and Gouesbet1995; Yan, Zhang & Liu Reference Yan, Zhang and Liu2012), spheres with inclusions (Borghese et al. Reference Borghese, Denti and Saija1994), spheroids (Asano & Yamamoto Reference Asano and Yamamoto1975), etc. This theory uses a separation of variables method to solve Maxwell’s equations with the appropriate boundary conditions. Theoretically, it has no limitations in terms of particle size range and refractive index. Nonetheless, due to the difficulty in the calculation of complex functions with large complex arguments, the numerical difficulties appears for millimetre sized spherical and cylindrical particles, and a few tens of micrometres for other particle shapes. When coupled with effective medium theories, LMT can handle materials that are heterogeneous at the nanoscale, see figures 5–7. In this example, the results obtained with the LMT and the Maxwell–Garnet approximation are in good agreement with rigorous electromagnetic calculations when the size parameter of the inclusions within the aggregates remains small. While it depends of the aggregate material refractive indexes, it can be said that, as a general trend, the predictions of the LMT with the Maxwell–Garnet approximation are better in the near infra red (NIR) region than the ultra violet (UV) one (Onofri et al. Reference Onofri, Barbosa, Touré, Woźniak and Grisolia2013).
Comparison of the evolution of the extinction coefficient of dense buckyball-shaped aggregates (of silica nanobeads): Lorenz–Mie theory with Maxwell–Garnett (MG) effective medium approximation versus T-Matrix calculations (Onofri et al. Reference Onofri, Barbosa, Touré, Woźniak and Grisolia2013).

The T-Matrix method (Waterman Reference Waterman1965) is an integral method coming in two forms, the null field and extended boundary technique method (Wriedt Reference Wriedt2007; Mishchenko & Martin Reference Mishchenko and Martin2013). Its name refers to the calculation of a transformation matrix allowing to link, using boundary conditions on a circumscribing sphere, the internal field and scattered field that are expended in terms of spherical vector wave functions. Once this matrix is determined, all the particle extinction and scattering properties can be deduced. For numerical reasons, depending on the particle refractive index and shape (i.e. aspect ratio notably), this method is still limited to size parameters
 ${\lesssim}10{-}500$
. Since it requires large computational resources, its results are often employed in the form of look-up tables (i.e.
 $\unicode[STIX]{x1D64E}$
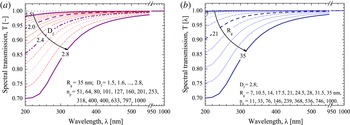
matrices for various particle shapes and compositions). As an illustration of T-Matrix capabilities (Mackowski & Mishchenko Reference Mackowski and Mishchenko1996; Mishchenko & Travis Reference Mishchenko and Travis2010), figure 8 shows the evolution of the spectral transmission of clouds of amorphous silicon fractal aggregates with very different morphologies. In the limit of a low optical thickness of the particle cloud, the latter were simply simulated by averaging the extinction properties of 500 aggregates for each considered case (i.e. multiple scattering effects between different aggregates is neglected but not multiple scattering effects within the aggregates). In figure 8(a) the fractal dimension increases from
 $D_{f}=1.5$
(i.e. chain-like aggregates) to
 $D_{f}=2.8$
(i.e. cauliflower-like aggregates) while the radius of gyration is kept constant
 $R_{g}=35~\text{nm}$
and the number of monomers increases from
 $51$
to
 $1000$
. By contrast, in figure 8(b) the fractal dimension is kept constant (
 $D_{f}=2.85$
) when the number of monomers increases from
 $11$
to
 $1000$
(i.e.
 $R_{g}$
increases from
 $7$
to 35 nm). As it can be seen, all the spectra exhibit more or less the same S-shaped pattern despite the changes in the aggregates morphology (from chain-like to cauliflower-like). In fact, for clouds of small and randomly oriented aggregates, the LES sensitivity to the particle morphology is quite low. This must be considered as positive when little is known on the particle cloud properties. Note that LES sensitivity to the particle shape can be significantly increased when particles with high aspect ratio are oriented along the incident electric field direction, as proved recently by the present authors (Onofri et al.
Reference Onofri, Pelce, Meister, Montet, Pelce, Barbosa, Sentis and Bizi2014).
Numerical predictions with the T-Matrix method of the transmission of a cloud of fractal aggregates of amorphous silicon monomers with (a) the same radius of gyration but various fractal dimensions (and numbers of monomers) and (b) the same fractal dimension but various radii of gyration (and numbers of monomers). Other parameters are kept constant:
 $r_{p}=3.5~\text{nm}$
,
 $k_{f}=1.593$
,
 $C_{n}=2\times 10^{13}~\text{m}^{-3}$
,
 $L=1~\text{m}$
(Onofri et al.
Reference Onofri, Wozniak and Barbosa2011; Wozniak Reference Wozniak2012).

The discrete dipole approximation (DDA) is a numerical method that solves the problem of the scattering and absorption by an array of polarizable point dipoles in interaction with a monochromatic plane wave (Draine & Flatau Reference Draine and Flatau1994; Yurkin & Kahnert Reference Yurkin and Kahnert2013). The particle model, whose shape can be virtually arbitrary, is meshed with thousands or millions of dipoles. The counterpart of this flexibility is that this method requires larger computational facilities. It is also limited in terms of maximum particle size and refractive index (i.e.
 $|\tilde{m}|x<0.5\sim 1$
and
 $|\tilde{m}-1|<2$
). The limit on the refractive index is the most problematic for LES. In fact, the complex refractive index of material encountered in plasma devices is often rather high in the UV range, precisely where the LES sensitivity to particle morphology is maximum.
2.5 Basic experimental set-up and software requirements
A LES set-up comes in various forms (Deepak & Box Reference Deepak and Box1978a
; Crawley et al.
Reference Crawley, Cournil and Di Benedetto1997; Xu Reference Xu2001; Onofri & Barbosa Reference Onofri, Barbosa and Boutier2012b
; Glasse et al.
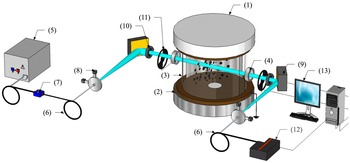
Reference Glasse, Riefler and Fritsching2015). To give an illustration of a typical set-up, the authors present below their own diagnostic, see a schematic view in figure 9. It was developed to study the growth of tungsten and silicon nanoparticles produced in low-pressure discharges (Onofri et al.
Reference Onofri, Wozniak and Barbosa2011; Barbosa et al.
Reference Barbosa, Couëdel, Arnas, Kishor Kumar, Pardanaud and Onofri2016). This set-up has also been used to characterise aerosols of buckyball-shaped
 $\text{SiO}_{2}$
nanoaggregates (Onofri et al.
Reference Onofri, Barbosa, Touré, Woźniak and Grisolia2013) and aerosols of compact tungsten aggregates with the perspective of developing combined laser-induced breakdown spectroscopy (LIBS) and LES measurements in fusion devices (Onofri et al.
Reference Onofri, Barbosa, Wozniak, Vrel and Grisolia2012).
Schematic of a typical LES set-up implemented on a plasma facility: (1) cathode, (2) grounded anode, (3) glass half-cylinders, (4) UV fused silica windows, (5) highly stabilized halogen–deuterium lamp, (6) optical fibres, (7) on-line intensity attenuator, (8) achromatic coupling and collimating optics, (9) parabolic mirrors, (10) diaphragm, (11) optical choppers, (12) UV-NIR spectrometer, (13) computer.

This set-up is composed of a highly-stabilized halogen–deuterium lamp (Ocean Optics DH-2000-DUV), solarisation resistant optical fibres with a
 $200\,\unicode[STIX]{x1D707}$
m core, an on-line intensity attenuator, achromatic coupling and collimating optics (50 mm focal length parabolic mirrors), a diaphragm to control the diameter of the probed zone (and thus refine the spatial resolution of the system), a spectrometer (Oceans Optics Maya Pro) equipped with a low noise and high dynamic charge coupled device (CCD) sensor. This spectrometer has an enhanced response in the UV range and a global half-height resolution of 2–5 nm. Depending on the optical windows installed on the plasma chamber, the effective spectral range of the full system is approximately
 $\unicode[STIX]{x1D706}\simeq 200{-}1000~\text{nm}$
. The aperture angle of the detection system is smaller than
 $0.1^{\circ }$
, allowing us to neglect the scattering of particles with diameter smaller than
 ${\sim}2~\unicode[STIX]{x03BC}\text{m}$
. In all situations, and as a prerequisite to calculating the transmittance defined in (2.1), the background noise and the reference signal are measured before plasma ignition. In some situations (long-term experiments, huge plasma light emission, etc.), two optical choppers enable us to chop periodically and alternatively the probing beam and the collection optics field of view. This procedure allows the successive measurements of the optical and electronic noises, the plasma light emissions and the transmittance signal. Classically, to further improve the SNR, the final LES spectra are obtained by averaging
 ${\sim}20$
to
 ${\sim}200$
instantaneous spectra. The minimum exposure time of our set-up (6 ms) is usually selected to further improve the SNR. This procedure decreases the nominal spectrometer acquisition rate from
 ${\sim}160$
spectra per second down to
 ${\sim}0.5{-}2$
spectra per second when the choppers are used. A laptop computer permits to control the system (i.e. spectrometer, choppers,
 $\,\ldots$
) and to perform the computations (inversions).
3 Parameter range and limitations of the technique
It is extremely difficult to define precisely the parameter range and accuracy of LES in terms of particle size and particle concentration ranges. In fact, they depend on many factors: the optical properties of the particle material (and the knowledge we have of them), the probing length, the SNR of the experiment (light source, CCD, plasma emission,
 $\,\ldots$
), the stability of the regularisation and inversion algorithm, the appropriateness of the electromagnetic light scattering models and particle shape models, etc. Thus, in the following, we restrict ourselves to some general remarks on the size and particle concentration ranges for a typical LES set-up like the one described in § 2.5.
The maximum particle size range of LES is between
 ${\sim}\unicode[STIX]{x1D706}_{min}/20$
to
 ${\sim}5\unicode[STIX]{x1D706}_{max}$
, i.e.
 ${\sim}10~\text{nm}$
and
 ${\sim}5~\unicode[STIX]{x03BC}\text{m}$
for a spectral range of
 ${\sim}200{-}1000~\text{nm}$
. However, from our experience, the dynamic of a single measurement can hardly exceed
 $D_{max}/D_{min}\sim 20{-}30$
. The lower particle size bound comes from the increasing sensitivity of LES to the particle refractive index (specially the imaginary part) at the expense of the particle size while, correlatively, the useful part of the spectrum is becoming narrower, see figure 13(a). This makes the inversion procedure very unstable. For the upper bound, the main limiting factor is the evolution of the extinction coefficient itself. This coefficient tends toward 2 for large size parameters (Bohren & Huffman Reference Bohren and Huffman1998), making LES spectra less sensitive to the particle size. One additional limitation for the upper bound is in the intensity of the forward diffraction peak, which rapidly increases with the particle size, polluting increasingly the extinction signal. Although, there exist some correction methods to account for the particle scattering (Deepak & Box Reference Deepak and Box1978a
,Reference Deepak and Box
b
; Hirleman Reference Hirleman1988), the problem becomes rapidly insoluble if LES is not coupled with another technique.
The particle concentration range is limited towards the smaller values by the SNR of the system. Optically, the SNR of LES spectra can only be improved by increasing the probing length
 $L$
. Generally speaking,
 $L$
can be increased using a multi-pass optical cell (Widmann et al.
Reference Widmann, Duchez, Yang, Conny and Mulholland2005) or a resonant optical cavity, such as the one used for cavity ring-down spectroscopy (CRDS) (Butler, Miller & Orr-Ewing Reference Butler, Miller and Orr-Ewing2007). However, these two classical solutions are difficult to implement on plasma experiments and/or when in situ measurements are required. In addition, losses in the multi-pass optical cells tend to rapidly decrease the probing beam intensity, when resonant optical cavities operate on a spectral bandwidth (e.g. a few nanometres or tens of nanometres), too narrow to perform LES inversions. Therefore, a better approach for characterizing particles in low concentration is to improve LES signal detection and processing schemes (e.g. cross-correlation with a multi-channel spectrometer), reduce the spectrometer noise (e.g. cooled CCD), increase LES probing beam energy (e.g. supercontinuum light source), etc. The maximum particle concentration is limited by the particle cloud scattering (single or multiple) (Hirleman Reference Hirleman1988). This limit can be extended by decreasing the probing length
 $L$
(e.g. analysis of the plasma edge), reducing the detection system collection angle in order to perform LES analysis only on ballistic photons (Calba et al.
Reference Calba, Méès, Rozé and Girasole2008). As an order of magnitude, based on the experimental conditions reported in § 4, the measurement range of LES in terms of particle concentration in volume is found to be in the range of a few parts-per-billion to a few parts-per-million.
4 Examples of in situ measurements and comparisons with other techniques
In what follows, LES capabilities are illustrated for two different: operating conditions, particle material and growing rates. The inversion is performed with the most appropriated inverse method and scattering model regarding to the SNR of LES spectra (which is for the same size range, and as already explained before, directly connected to the particle concentration). The first example deals with compact quasi-spherical tungsten nanoparticles in low concentration in a DC argon glow discharge. In this case, the authors explain how they deal with signals with a low SNR to extract reliable PSDs and concentrations from LES signals. The second example deals with cauliflower-shaped nanoparticles in high concentration in a argon–silane CC-RF discharge. In this case, where the SNR is high, the emphasis is put on the T-matrix and Twomey–Phillips methods.
4.1 Characterisation of tungsten nanoparticle growth in a low-pressure discharge
In this experiment (Barbosa et al.
Reference Barbosa, Couëdel, Arnas, Kishor Kumar, Pardanaud and Onofri2016), tungsten nanoparticles were grown in a DC argon glow discharge initiated between a circular tungsten cathode with a diameter of 10 cm and a stainless-steel grounded anode. A detailed description of the set-up and conditions can be found in Kishor Kumar et al. (Reference Kishor Kumar, Couëdel and Arnas2013), Couëdel, Kishor Kumar & Arnas (Reference Couëdel, Kishor Kumar and Arnas2014); here only a short summary is proposed. The inter-electrode distance was 10 cm. Two glass half-cylinders were used to confine the plasma. A 1 cm gap was kept between them to allow the implementation of optical diagnostics. A static argon pressure of 0.6 mbar (no gas flow) was set during the experiments. The electrode assembly was contained in a cylindrical vacuum chamber of 30 cm diameter and 40 cm length. An oil diffusion pump achieved a base pressure of
 ${<}10^{-6}~\text{mbar}$
. A manually operated gate valve isolated the chamber from the oil diffusion pump during experiments. A regulated power supply was used to bias the cathode. The discharge current density was kept at a constant value (
 $0.53~\text{mA}~\text{cm}^{-2}$
corresponding to a current of 40 mA). The current variations were less than 0.05 %. The discharge parameters were such that the plasma mainly consisted of a negative glow. With the aforementioned operating conditions, the cathode was sputtered and tungsten nanoparticles were grown (Kishor Kumar et al.
Reference Kishor Kumar, Couëdel and Arnas2013; Couëdel et al.
Reference Couëdel, Kishor Kumar and Arnas2014).
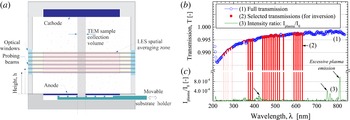
Tungsten particle growth. (a) Schematic of the plasma chamber with the probing zones of LES and the particle collection system. (b) Typical raw spectrum and values selected for the inversion at
 $h=5.3~\text{cm}$
and
 $t=100~\text{s}$
. (c) Intensity ratio of the plasma emission collected by LES system with respect to the probing beam intensity.

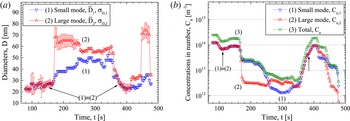
Tungsten particle growth – LES measurements. (a) Temporal evolution of the mean diameter and associated standard deviation (represented by bars) of each PSD mode for
 $h=2.8~\text{cm}$
from the anode. (b) Corresponding evolution for the particle cloud concentration in number (small and large modes, total) (Barbosa et al.
Reference Barbosa, Couëdel, Arnas, Kishor Kumar, Pardanaud and Onofri2016).

As complementary measurements, electron microscopy and Raman spectroscopy analyses were performed (off-line) on particles collected on a movable substrate holder. It turned out that the nanoparticles were roughly spherical, and were mainly like compact aggregates of tungsten crystallites, see figure 1(a,b). These observations, as well as numerical simulations with rigorous electromagnetic models, justify the choice for LES inversions of the sphere as the particle shape model and the selection of the LMT to calculate the extinction matrix. Since the measured transmissions were quite noisy, due to a relatively low particle concentration, only selected values were retained for the inversion procedure, see figure 10(b). For the same reason, a dependant model was used to help in the regularisation problem. Finally, due to the dynamics of the particle cloud, the PSDs in number and in volume were assumed to be of mono-modal or bi-modal log-normal types (Barbosa et al. Reference Barbosa, Couëdel, Arnas, Kishor Kumar, Pardanaud and Onofri2016).
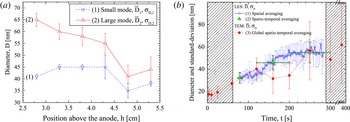
Tungsten particle growth. (a) Evolution with the height above the anode of the mean diameter and the associated standard deviation (represented by bars) of each PSD mode, measured with LES at the minima in transmittance. (b) Comparison of TEM statistics with LES statistics (spatially averaged over
 $h=2.8$
to
 $h=5.3~\text{cm}$
, plus time averaged over the time required to collect the samples).

Figure 11 shows, typical time series measured with LES at a height of
 $h=2.8~\text{cm}$
above the anode for (a) the mean diameters and the associated standard deviations of each PSD mode and (b) the particle concentrations in number. Note that LES spectra were too noisy before
 $t\sim 80~\text{s}$
to allow any reliable inversion. The sudden change of the PSD from mono-modal to bi-modal observed in figure 11(a) is attributed to an agglomeration process. The large mode corresponds to the agglomeration of
 ${\sim}35~\text{nm}$
particles at constant volume (Barbosa et al.
Reference Barbosa, Couëdel, Arnas, Kishor Kumar, Pardanaud and Onofri2016), when the small mode is constituted by particles of a first generation that are not totally consummated by the agglomeration process and remain in the LES probing zone. Indeed, the nanoparticles of the small mode are consumed by agglomeration to create the nanoparticles of the large mode. Even if the agglomeration of the 35 nm particles should normally be suppressed because they are negatively charged, it may still exist due to a mechanism called the polarisation-induced ion flux asymmetry (PIFA) (Mankelevich, Olevanov & Rakhimova Reference Mankelevich, Olevanov and Rakhimova2008; Mankelevich et al.
Reference Mankelevich, Olevanov, Pal’, Rakhimova, Ryabinkin, Serov and Filippov2009). In the PIFA mechanism, it is proposed that a nanoparticle becomes polarised due to the influence of the electric field created by the neighbouring nanoparticle which leads to an asymmetry of the ion flux onto the nanoparticle surface resulting in a force in the direction of the electric field. PIFA mechanism thus allows negatively charged large particle to agglomerate with smaller negatively charges one. This mechanism was verified experimentally in a RF discharge (Mankelevich et al.
Reference Mankelevich, Olevanov, Pal’, Rakhimova, Ryabinkin, Serov and Filippov2009). Furthermore, as nanoparticles are getting deeper in the negative glow, i.e. closer to the anode, the electron temperature decreases and so does the nanoparticle charge (in absolute value), reducing the repulsive force. Finally, the agglomeration hypothesis is favoured by the sudden appearance of the large mode in concordance with a sudden decrease of the number concentration of the nanoparticles of the small mode. Note that the two modes of the PSD are log-normal and only the mean sizes are given in figure 11. While the PIFA mechanism allows the agglomeration of negatively charged particles, it still favours the agglomeration of the smallest one with the largest one. Consequently, the smallest nanoparticles are consumed in priority and, in return, the mean diameter of the small mode increases. Experiments at different heights show that this phase occurs quicker when closer to the cathode. A possible explanation for the triggering of the agglomeration phase is that when large particle pass through a cloud of smaller particle, agglomeration is enhanced (Mankelevich et al.
Reference Mankelevich, Olevanov and Rakhimova2008, Reference Mankelevich, Olevanov, Pal’, Rakhimova, Ryabinkin, Serov and Filippov2009; Annaratone et al.
Reference Annaratone, Elskens, Arnas, Antonova, Thomas and Morfill2009). More details are given in Barbosa et al. (Reference Barbosa, Couëdel, Arnas, Kishor Kumar, Pardanaud and Onofri2016).
Figure 12(a) shows the evolution of the statistical moments of the PSD in number for different heights above the anode and when the minimum of transmittance is reached, which corresponds to the opening of a ‘dust free’ region in the LES beam, for example at 230 s for
 $h=2.8~\text{cm}$
and at 170 s for
 $h=5.3~\text{cm}$
(Barbosa et al.
Reference Barbosa, Couëdel, Arnas, Kishor Kumar, Pardanaud and Onofri2016). It can be clearly seen that the agglomeration process and cloud properties are not homogeneous in the discharge (this was confirmed qualitatively by laser-light scattering images). The mean size of the nanoparticles belonging to the large mode increases when getting closer to the anode, while on the contrary, the mean size associated with the small mode shows no clear trend. These results reinforce the hypothesis of an agglomeration process triggered when the biggest nanoparticles fall through a cloud of smaller nanoparticles. They consequently grow until they reach the anode side. More details about this specific measurement are given in Barbosa et al. (Reference Barbosa, Couëdel, Arnas, Kishor Kumar, Pardanaud and Onofri2016). Figure 12(b) illustrates the difficulty of comparing in situ and ex situ analyses. On one hand, TEM analyses are performed on a sample that is expected to be representative of particle populations within, more or less, a cylindrical volume defined by the particle sample collection system area and the distance between the electrodes, as sketched in figure 10(a). The sample collection procedure takes time and several discharges are necessary to collect enough particles. Thus, TEM results must be considered as spatio-temporal averaged quantities. On the other hand, LES provides time-resolved statistics representative of the particle cloud properties at a given height. For a better comparison, LES analyses should be performed (and spatially averaged) over the whole electrode gap. Unfortunately, this was not possible on the current plasma test chamber and indeed, only one third of this distance was accessible for the experiments reported here. Figure 12(b) shows LES global results obtained with these spatial averaging (for
 $h=2.8$
–5.3 cm) and time-averaging (over the time required to collect TEM samples, ‘spatio-temporal averaging’ case) procedures. The results are in a qualitative agreement, despite significant fluctuations in the TEM analyses of collected samples. Note that for these calculations, the LES maximum acquisition time was limited by the shortest time series recorded (i.e. 300 s).
4.2 Silicon nanoparticle formation in an argon–silane low-pressure RF plasma
In this experiment (Onofri et al.
Reference Onofri, Wozniak and Barbosa2011), silicon nanoparticles were grown in a CC-RF discharge in which the total pressure
 ${\sim}13~\text{mBar}$
, the RF electrode power
 ${\sim}10~\text{W}$
and the mass fraction
 $Y_{SIH_{4}/Ar}=4\,\%$
were maintained constant during the whole experiment duration. The discharge was confined in a grounded cylindrical (13 cm diameter) stainless steel box. The shower type upper electrode (driven electrode) was connected to a standard matching box, supplied with argon and silane
 $(\text{SiH}_{4})$
, in order to ensure a good homogeneity of the gas mixture at the entrance of the discharge gap. The inter-electrode distance is approximately 3.3 cm. A grid (50 % of transparency) was placed at the bottom of the grounded box in order to obtain a laminar vertical gas flow. The discharge structure was enclosed in a vacuum chamber (30 cm height, 30 cm diameter) containing two UV fused silica windows for optical diagnostics. The particle sample collection system for ex situ TEM/SEM analyses was set slightly below the centre of the bottom electrode. The LES system was installed on both sides of the chamber (Onofri et al.
Reference Onofri, Wozniak and Barbosa2011) with a probing beam positioned halfway between the electrodes. A detailed description of the set-up and conditions can be found in Boufendi & Bouchoule (Reference Boufendi and Bouchoule1994).
Complementary analyses showed that the nanoparticles formed in the discharge take the form of cauliflower-like dense aggregates, see figure 1(c,d) composed of monomers with nanocrystallites inclusions embedded in an amorphous matrix. They were essentially composed of silicon, with a small fraction in mass of hydrogen. These observations justified the selection of a high compactness fractal-like aggregate model for the particle shape model (with
 $D_{f}=2.85$
,
 $r_{p}=3.5~\text{nm}$
and
 $n_{p}=1,2,\ldots 813$
). To account for their composition, the refractive index of several forms of silicon was tested: amorphous, crystalline, polysilicon, …(SOPRA 2008) as well as their different mixtures. When compared to TEM analyses, the best agreement was obtained when using the refractive index spectra of amorphous silicon. Thus, in the following, to solve the direct and the inverse problems, the T-Matrix and Twomey–Philips methods were implemented with the cross-section diameter (i.e.
 $D\equiv D_{A}$
) and the refractive index of amorphous silicon.
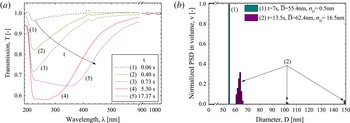
Silicon particle growth. (a) LES transmissions measured at different times
 $t$
after the plasma ignition; (b) two characteristic PSDs in volume extracted from the time series (see figure 14).

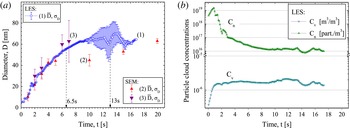
Silicon particle growth. (a) Comparison of the time evolution of the mean diameter and the associated standard deviation (represented as bars) measured with (1) LES and (2–3) TEM analyses. (b) Corresponding evolution for the particle cloud concentrations in number and in volume measured with LES.

Typical evolutions for LES spectra are shown in figure 13(a), for different times
 $t$
after the plasma ignition (
 $t=0~\text{s}$
). In figure 13(a) and for
 $t<1~\text{s}$
, the transmission is always above
 ${\sim}0.7$
for
 $220~\text{nm}<\unicode[STIX]{x1D706}<500~\text{nm}$
, indicating that small particles are already produced. For increasing time, the minimum of the transmission decreases and is shifted towards higher wavelengths. Generally speaking, these two trends are the signature of an increase of the particle size. Figure 13(b) shows two PSDs obtained for
 $t\sim 6.5$
and 13 s. Figure 14 shows the temporal evolution of (a) the two first statistical moments of the PSD in volume and (b) the corresponding concentrations in number and volume. For
 $t<8{-}9~\text{s}$
, the mean diameter increases rapidly, while the standard deviation remains extremely small (
 $\unicode[STIX]{x1D70E}_{D}<1$
). While LES predicts narrower size distributions, a good agreement is found for the mean diameter when compared to TEM analyses performed for the same conditions: a decade before, case denoted 2 in figure 14(a) (Boufendi & Bouchoule Reference Boufendi and Bouchoule1994), and a few months after (case denoted 3) experiments carried with LES. The difference in the PSD width is explained, as for the tungsten particles, by the fact that LES measurements are representative of the particle cloud properties at a given height in the discharge, whereas TEM measurements are integrated over larger volumes and longer times. The statistics are thus not directly comparable except when the particle cloud properties are spatially homogeneous in the whole discharge. For
 $t>8{-}9~\text{s}$
, the mean diameter tends to be nearly constant while the standard deviation increases significantly prior to diminish above
 $t\sim 15{-}16~\text{s}$
. For
 $t\sim 10{-}12~\text{s}$
, LES and TEM analyses do not match as well as before. The standard deviation estimated by LES is for instance significantly higher. This discrepancy may be explained by a vertical stratification of the particle cloud properties, and also by the fact that LES has detected the formation of a new particle generation as shown in figure 13(b). Their statistical weights are probably too weak to be observed with electron microscopy analyses based on a hundred particles. The discrepancy on the mean diameter is harder to explain, especially because a better agreement is found later on. Slight variations in the discharge parameters, from one experiment to another one, or some arc discharges introducing some instabilities in the process, are two plausible explanations for this observed deviation.
5 Conclusion
In this article, the physical basis and basic equations of the LES technique are reviewed including all the modelling aspects connected to the inversion problem (regularisation methods, particle shape, refractive index and electromagnetic models). Then, the parameter range and limitations of the technique are discussed. It is however stressed that they highly depend on the studied particle system. A basic experimental set-up is described, including hardware and software requirements, with some perspectives regarding future developments and refinements. Finally, two examples of measurements in two types of low-pressure gas discharges are presented. The first example deals with almost spherical particles in low concentration and a small SNR. The second example deals with compact fractal aggregates (cauliflower-shaped particles) in high concentration and a large SNR. A special emphasis is given on the reasons that have guided the selection of the most appropriate models for data inversion, together with warnings on interpretation of the results obtained.
To conclude, it is demonstrated in this article that LES is a powerful technique for in situ and real time characterisation of complex shaped and polydisperse nano- to micro-sized particle in reactive plasmas. This is also clearly confirmed by electromagnetic simulations which can study particle systems much more complicated than the one presented experimentally. For clouds of small and randomly oriented aggregates, the LES sensitivity to the particle morphology is quite low. This must be considered as positive when little is known on the particle cloud properties. In that case, LES provides accurate estimations for the particle size distribution and (absolute) concentration. Although, not detailed in this article, it was also shown recently that LES can also characterise particle with high aspect ratio, provided that they are oriented along the polarization direction of the probing beam (Onofri et al. Reference Onofri, Pelce, Meister, Montet, Pelce, Barbosa, Sentis and Bizi2014).
Finally, LES requires only two optical access, facing each other. Their size depend essentially on the discharge region to be probed. It is relatively simple to implement and rather inexpensive. These features make the LES diagnostics very appealing and unique. The necessity to have a certain prior knowledge on the particle composition and shape is a difficult issue. However, this is a common limitation of all inverse techniques.
Acknowledgements
This work was partially supported by the INSIS of CNRS (grant PEPS, Projets Exploratoires Premier Soutien), the French National Research (grant ANR-09-BLAN-023-01), the Federation for Magnetic Confinement Fusion (FR-FCM) in collaboration with the Association Euratom- CEA (grant V3485.001).