Introduction
Some of the major concerns regarding the use of mixed perennial ryegrass (Lolium perenne L.; PRG)–white clover (Trifolium repens L.; clover) swards are related to the later start of clover growth in spring compared with PRG, the unpredictable and possibly reduced sward performance in spring, clover persistency in intensively managed grazed swards, and the difficulty of weed control (Frame and Newbould, Reference Frame and Newbould1986; Andrews et al., Reference Andrews, Scholefield, Abberton, McKenzie, Hodge and Raven2007).
Poor growth rate of clover in spring can compromise the overall annual herbage production of mixed swards (Frame and Newbould, Reference Frame and Newbould1986) and can subsequently reduce milk production from grazed herbage in spring calving pasture-based systems, such as those in Ireland (Dillon et al., Reference Dillon, Crosse, Stakelum and Flynn1995). Nitrogen (N) fertilizer application may overcome the low spring herbage production in mixed swards, as N fertilizer application is generally concentrated during the spring-summer period (Whitehead, Reference Whitehead1995). However, while some authors have suggested that spring is the main time when clover growth can be depressed by N application (Ledgard et al., Reference Ledgard, Sprosen, Steele and West1995; Harris et al., Reference Harris, Auldist, Clark and Jansen1998), other research shows that small amounts of N fertilizer can improve clover growth in spring with minimal effect on clover persistency (Eltilib and Ledgard, Reference Eltilib and Ledgard1988).
Clover is known to increase the overall nutritional quality of mixed swards (Frame and Newbould, Reference Frame and Newbould1986; Andrews et al., Reference Andrews, Scholefield, Abberton, McKenzie, Hodge and Raven2007; Kleen et al., Reference Kleen, Taube and Gierus2011). The production and nutritional quality of grass-only (GO) swards towards the end of the grazing season declines due to the advanced maturity of PRG. Clover growth rate increases from early summer onwards (Frame and Newbould, Reference Frame and Newbould1986; Ledgard and Steele, Reference Ledgard and Steele1992). Thus, the role of clover in mixed swards might be greatest in the latter part of the grazing season, and the seasonal growth and nutritional quality patterns of the two species may complement each other.
Experiments examining the performance and persistency of mixed swards are commonly carried out undercutting management (e.g. Nyfeler et al., Reference Nyfeler, Huguenin-Elie, Suter, Frossard, Connolly and Luscher2009; Gilliland and Meehan Reference Gilliland and Meehan2012; Elgersma and Søegaard Reference Elgersma and Søegaard2016). However, the results obtained in those experiments may not be representative of grazing conditions, as important animal–sward interface effects such as the defoliation mechanisms per se, species selection, nutrient cycling, poaching and trampling are not taken into account (Evans et al., Reference Evans, Williams, Jones and Evans1998; Menneer et al., Reference Menneer, Ledgard, Mclay and Silvester2004; Kleen et al., Reference Kleen, Taube and Gierus2011).
The objectives of the current experiment were (1) to identify an appropriate N fertilizer application rate to optimize the spring and annual herbage production and quality of mixed swards subjected to frequent and tight (⩽4 cm) grazing, and (2) to determine the effect that different N fertilizer application rates have on the persistency of mixed sward components over a 4-year period. The hypothesis was that frequent and tight grazing management will reduce the expected negative detrimental effect of N fertilizer on clover to some extent, therefore maintaining clover positive effects in terms of herbage production and quality for a longer period.
Materials and methods
The experiment was undertaken at the Dairygold Research Farm, Teagasc, Animal and Grassland Research and Innovation Centre, Moorepark, Fermoy, Co. Cork, Ireland (52°9′50″N, 8°15′40″W; 46 m a.s.l.). Site description, grazing management and fertilizer application strategies used in the current experiment have been previously described by Enriquez-Hidalgo et al. (Reference Enriquez-Hidalgo, Gilliland and Hennessy2016). Briefly, a series of grazing plots (8 × 8 m2) were established in May 2009. The experiment had a 2 × 5 factorial arrangement with three replicates in a split-plot design, with sward type as the main plot and N rate as the sub-plot. Treatments consisted of two swards: PRG only (GO) and PRG clover (GWc), and five N fertilizer levels: 0, 60, 120, 196 and 240 kg N/ha/year (hereafter referred as 0N, 60N, 120N, 196N and 240N).
Measurements were undertaken from February 2010 to October 2013, inclusive. Non-experimental dairy heifers or cows grazed the swards between February to October on nine, ten, ten and eight occasions during 2010, 2011, 2012 and 2013, respectively. Herbage allocation was set to be grazed within a 24- to 48-h grazing period, depending on pre-grazing herbage mass and cow intake to achieve a target post-grazing sward height (PostGSH) of 4 cm.
Sward measurements
Pre and post-grazing sward heights
Pre-grazing sward height (PreGSH) above ground level for each plot was recorded before each grazing event by taking ten measurements using a rising plate meter (Jenquip, Fielding, New Zealand). Following grazing, a similar procedure was carried out to determine the PostGSH above ground level.
Herbage removed and sward white clover content
Herbage removed (t dry matter (DM)/ha) for each grazing event was calculated as follows:
 $$\eqalign{{\rm Herbage \; removed} = & ({\rm PreGSH} - {\rm Post GSH} \; ({\rm cm})) \cr & \times {\rm Herbage \; density} \; ({\rm t\;DM}/{\rm cm}/{\rm ha})}$$
Annual herbage removed for each plot was calculated as the sum of each respective value measured at each grazing event.
Immediately prior to each grazing event, the sward clover content (4 cm above ground level; >4 cm) of the GWc swards and the herbage mass (>4 cm) and sward density in each plot were estimated as described by Enriquez-Hidalgo et al. (Reference Enriquez-Hidalgo, Gilliland and Hennessy2016).
Pre-grazing white clover petiole length and stolon width
In 2011 and 2012, clover petiole length and stolon width were estimated in situ by measuring 30 petioles and 30 clover stolons per plot. Measurements were carried out by placing a 1 m ruler marked at 10 cm intervals randomly in each plot and measuring the petiole on the closest leaf (only the third or older fully developed leaves were measured) and stolon (only third order or older stolons were measured) to the 10 cm mark. This procedure was carried out three times in each plot immediately prior to each grazing event.
Herbage chemical analysis
A 0.1 kg sub-sample of herbage harvested >4 cm from each plot was dried at 40 °C for 48 h and then milled through a 1 mm screen and stored. Samples of the dried herbage in 2011 and 2012 were bulked for each plot for grazing events 2 and 3, 7 and 8, and 9 and 10, then analysed by wet chemistry for organic matter digestibility (OMD), crude protein (CP), neutral detergent fibre (NDF), acid detergent fibre (ADF) and ash contents. Herbage samples from the 5th grazing event were also analysed. In 2013, the herbage from the 2nd, 3rd, 4th, 6th and a bulked sample from the 7th and 8th grazing events were also analysed for chemical composition.
The OMD was estimated using the in vitro neutral detergent cellulase method (Fibretec™ Systems; Foss, Ballymount, Dublin, Ireland) as described by Tilley and Terry (Reference Tilley and Terry1963). Nitrogen content was determined using an N analyser (FP-428; Leco Australia Pty Ltd., Castle Hill, New South Wales, Australia) based on the AOAC method 990-03 (AOAC 1990) and CP content was determined by multiplying N content by 6.25. The NDF and ADF contents were determined using a fibre analyser (Ankom Technology, Macedon, NY, USA) based on the method described by Van Soest et al. (Reference Van Soest, Robertson and Lewis1991). Amylase and a sodium sulphite solution were used in the NDF and ADF content determination process. The NDF and ADF values do not include ash values. Ash content was estimated by placing a sub-sample in a muffle furnace at 500 °C for 12 h.
Tiller density and stolon mass
Three turves (10 × 10 cm2) were removed at random from each plot five times in 2011 and in 2012 (approximately every 2 months) to estimate grass tiller density and clover stolon mass (tiller/m2 and g DM/m2, respectively) as described by Evans et al. (Reference Evans, Williams, Jones and Evans1998). The PRG, other unsown grass species (mainly meadow grass, Poa anua L.) and unsown dicotyledons were separated and counted. Clover stolons were separated from each turve, roots and leaves removed and then gently washed to remove excess soil. Stolons were then dried at 40 °C for 48 h and weighed to obtain a stolon DM weight.
Statistical analysis
Linear mixed models (Verbeke and Molenberghs, Reference Verbeke and Molenberghs2009) were used to analyse the seasonal responses of the following variables: PreGSH, PostGSH, herbage removed, tiller density and herbage chemical composition. The model included sward type, N rate, cutting month (or collection month for tiller density and stolon mass), year and the interactions amongst these four variables as fixed effects, and the sward type × block interaction as a random factor. However, the year × month interactions were not included in the analyses to ease interpretation of results. As recommended by Moser (Reference Moser2004), the year and month were included as repeated measures using the unstructured and compound symmetry (un@cs) covariance structure, respectively. Plot was the experimental unit. Interactions were checked independently for every variable and were removed from the model through backward elimination if they had a P value >0.1. A similar model was used for seasonal clover-related variables, but the sward type effect was removed from the model. A further analysis was carried out using the average annual values (cumulative for herbage and clover removed) using linear mixed models. Similar models to those previously described were used, but the year was used as the repeated measure using the compound symmetry (cs) as covariance structure. All statistical analyses were carried out using the Mixed procedure of SAS 9.1.3.
Results and discussion
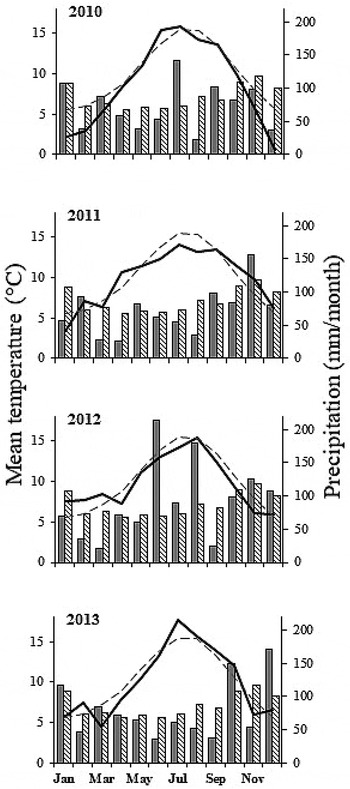
In comparison to the 20-year average, annual precipitation was 16, 17 and 9% lower in 2010, 2011 and 2013, respectively, than the 20-year average (Fig. 1). A drought period occurred during the 2013 May to September period. In 2012, summer precipitation was more than twice the 20-year average. Cold spring and autumn/winter periods were observed in 2010. Relatively low temperatures were observed from April 2012 until May 2013, but afterward temperatures increased and in July 2013 were 15% greater than the 20-year average. Annual variations in weather conditions were not unusual departures from long-term averages and were typical of the variation that any sward management system will need to accommodate in this temperate maritime climate. This was probably a driving factor involved in the annual and monthly variations observed in certain characteristics during the study.
Average monthly air temperature and total rainfall during the experimental period (solid lines and bars) and 20-year average (dashed line and bars).

The factors and interactions included in the statistical models used to analyse each of the seasonal and annual variables are presented in Appendices 1 and 2, respectively.
Sward measurements
Herbage removed, grazing sward height and sward white clover content
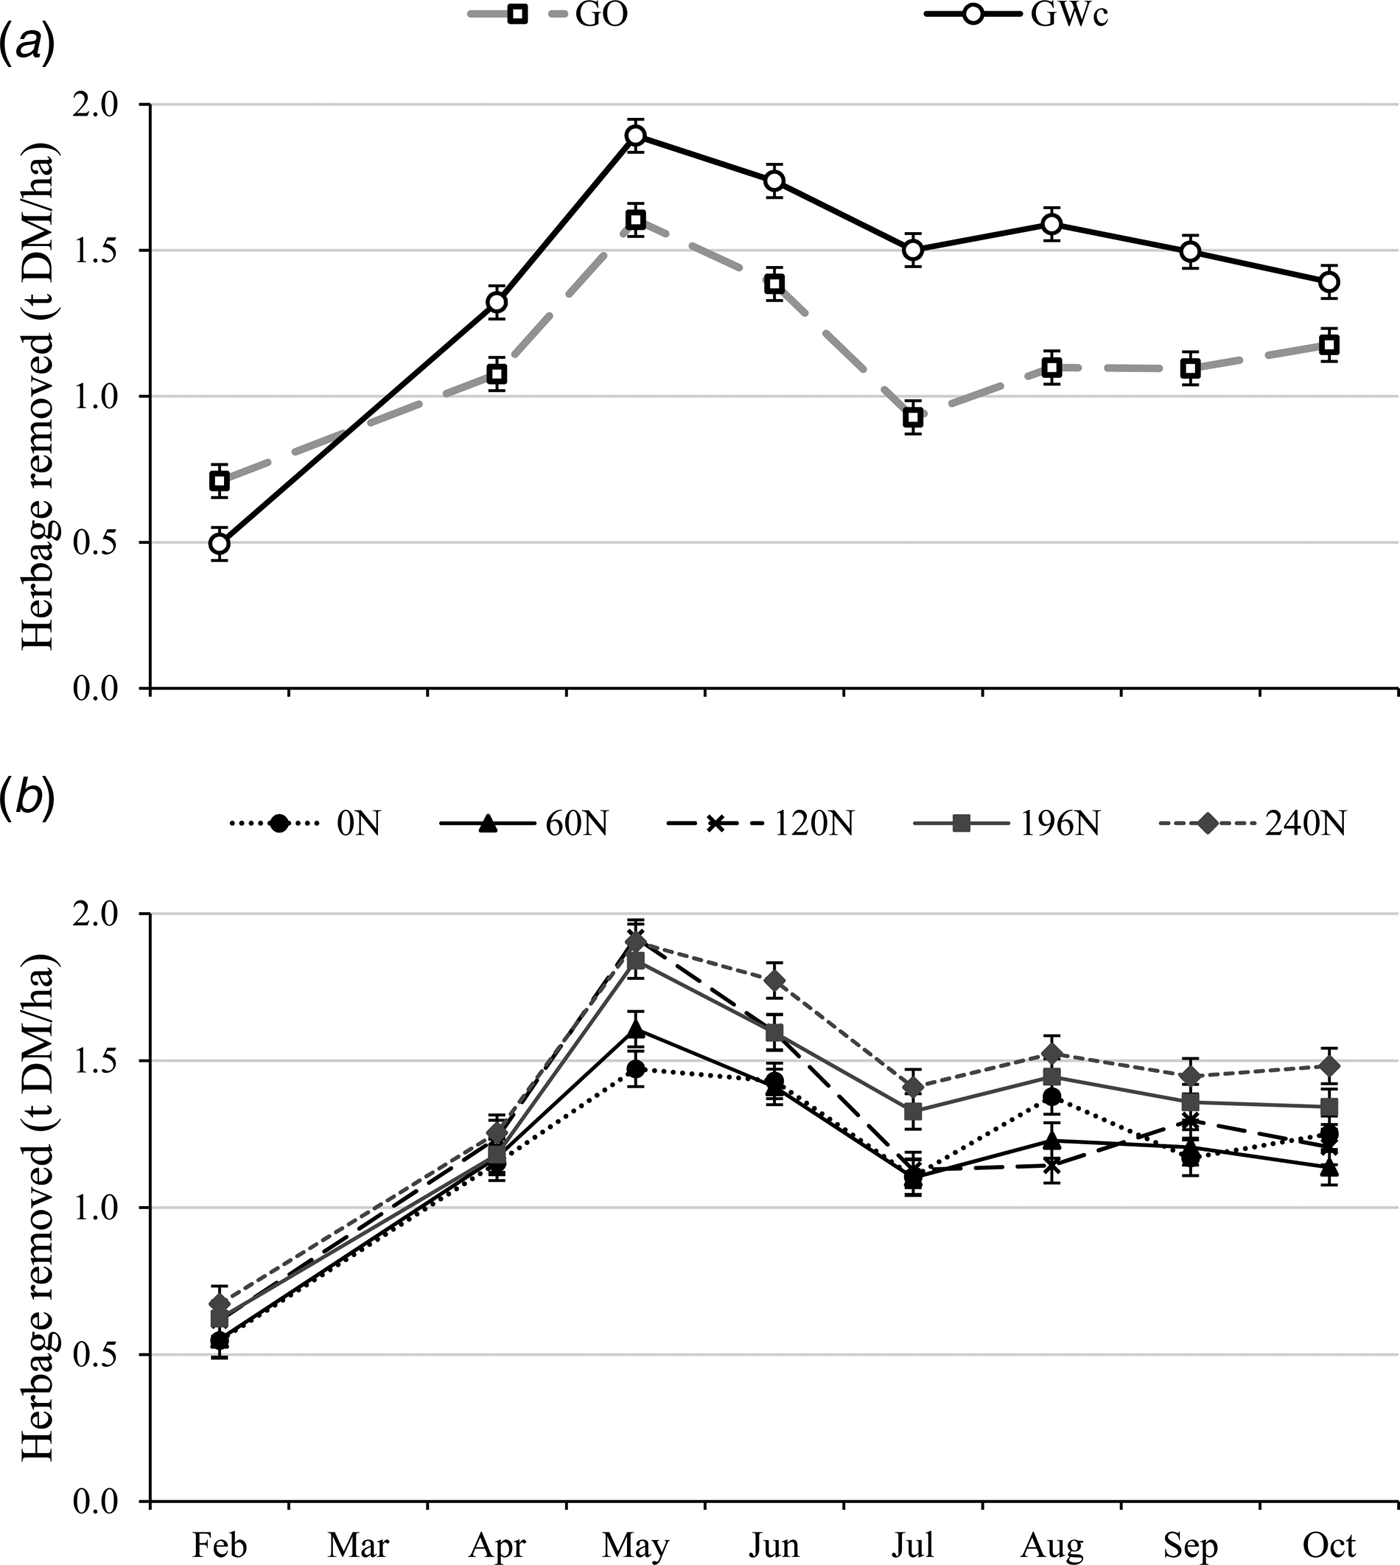
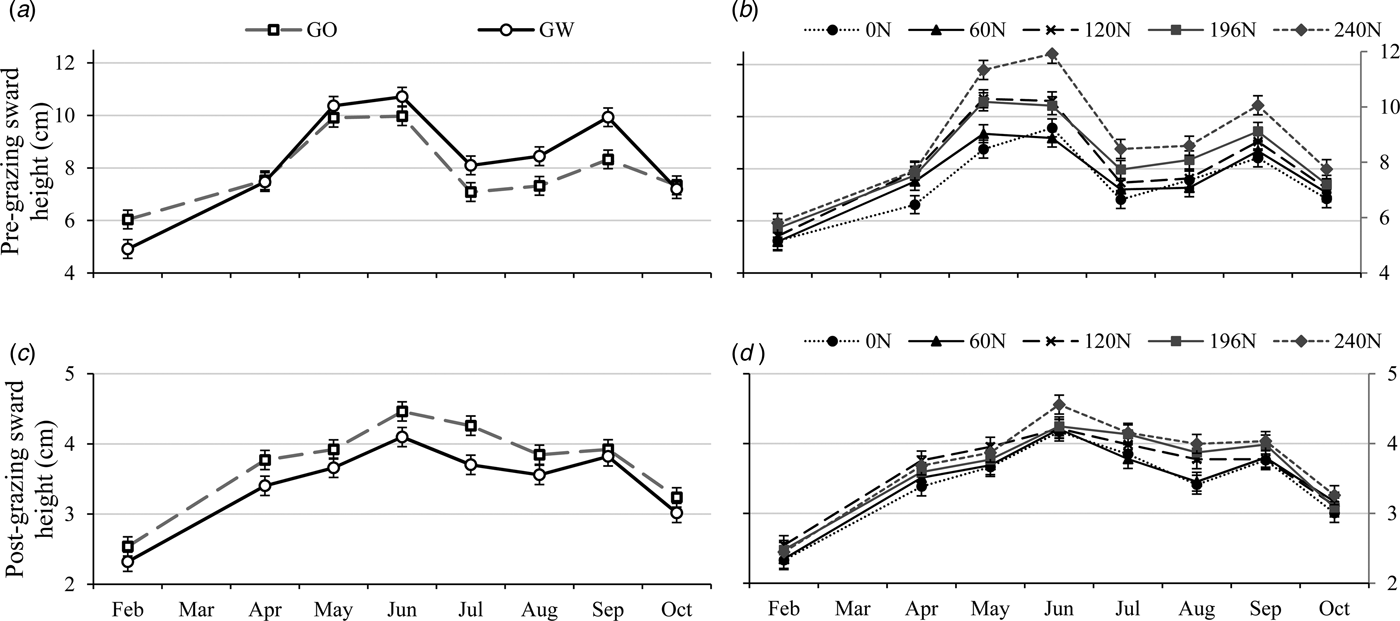
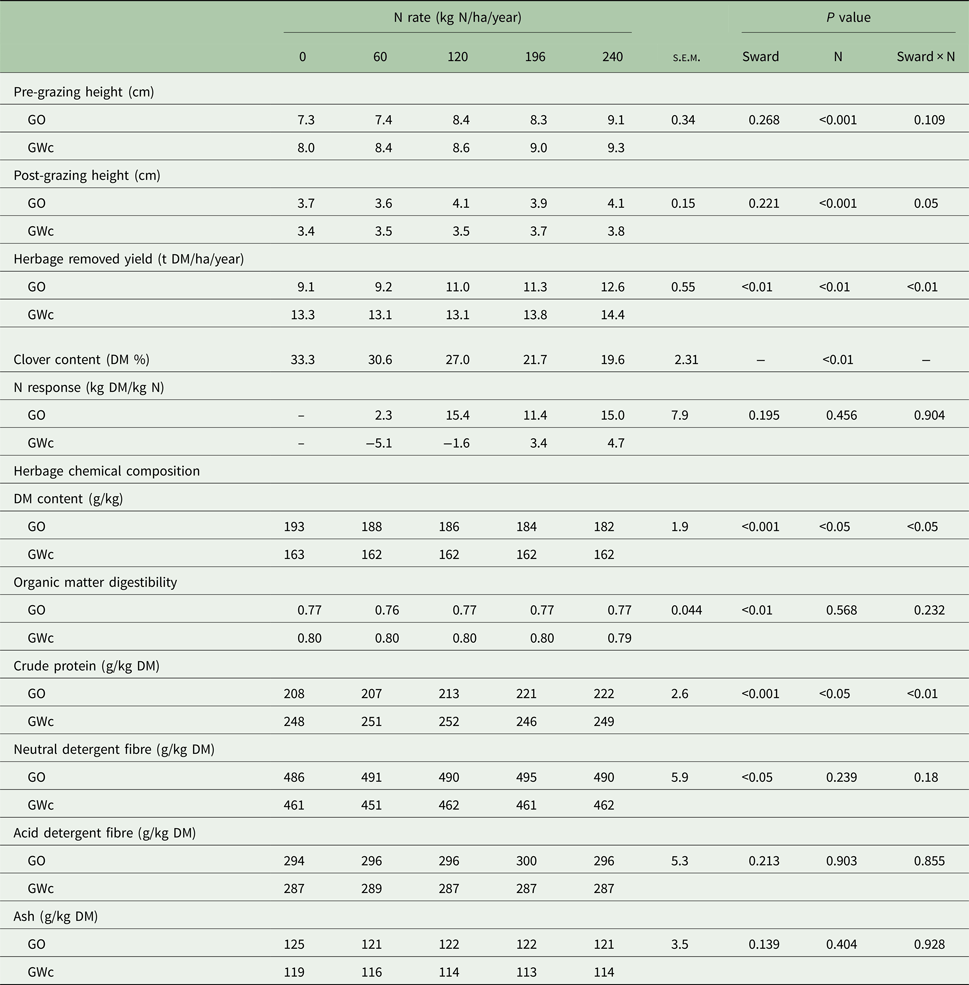
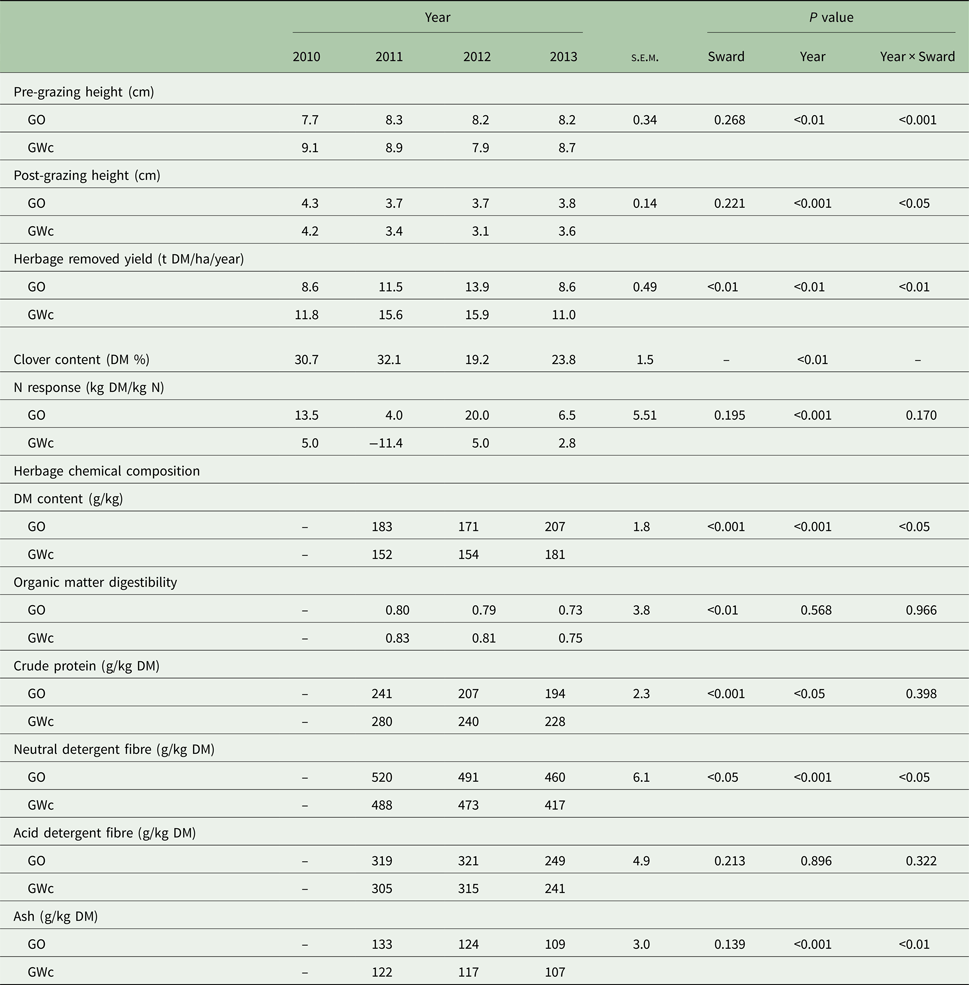
Under the experimental conditions used in the current experiment, herbage removed for all GWc swards was at least as much as the GO receiving 240 kg N/ha. The GWc swards had on average 35% greater levels of herbage removed than GO swards from May until September (Fig. 2(a)); however, PreGSH in GWc swards was greater than GO swards only in August and September (Fig. 3(a)). Herbage removed and PreGSH increased as N rate increased after April (Figs 2(b) and 3(b)). However, increasing the N rate increased cumulative herbage removed and annual PreGSH on the GO swards, but had little effect on GWc swards (Table 1). The GWc swards had between 1.8 and 4.2 t DM/ha/year more cumulative herbage removed than GO swards (Table 1; P < 0.05) and the greatest difference was observed in 2011 (Table 2; P < 0.05). It is possible that the high clover content observed in 2010 and the previous harsh winter accentuated plant decay and subsequent N mineralization, which resulted in additional N available for herbage growth in the 2011 season. This effect was more evident in GWc swards receiving low N rates than GO swards because in such conditions clover has the initial growth advantage that PRG has when N fertilizer is applied (Frame and Boyd, Reference Frame and Boyd1987; Loiseau et al., Reference Loiseau, Soussana, Louault and Delpy2001). Although clover contribution to herbage removed should not be dismissed and the overyielding of mixed swards compared with GO swards receiving the same N fertilizer up to 450 kg N/ha has been already reported (Wilman and Hollington, Reference Wilman and Hollington1985; Nyfeler et al., Reference Nyfeler, Huguenin-Elie, Suter, Frossard, Connolly and Luscher2009), it is likely that the outstanding GWc sward performance might be related to the poor response of the GO swards to N application, as discussed by Enriquez-Hidalgo et al. (Reference Enriquez-Hidalgo, Gilliland and Hennessy2016). Cows grazed GWc swards tighter (P < 0.05) than GO swards in July (Fig. 3(c)) and, on an annual basis, for the swards receiving 120 kg N/ha (P < 0.05; Table 1) and for all GWc swards in 2012 (P < 0.05; Table 2). Therefore, cow preference for clover compared with PRG (Menneer et al., Reference Menneer, Ledgard, Mclay and Silvester2004) should not be dismissed as a possible explanation for the greater herbage removed observed from the GWc swards. Herbage removal from GWc swards receiving no N fertilizer was similar to that from GO swards receiving 240 kg N/ha over a 4-year period.
Effect of nitrogen (N) application rate (0, 60, 120, 196 and 240 kg N/ha/year; 0N, 60N, 120N, 196N and 240N, respectively) on grass only (GO) and grass white clover (GWc) herbage removed (a) sward type responses and (b) N application rate responses from 2010 to 2013 grazing seasons. Data presented as least squares means based regression analysis. Vertical bars represent standard error of the mean.

Effect of nitrogen (N) application rate (0, 60, 120, 196 and 240 kg N/ha/year; 0N, 60N, 120N, 196N and 240N, respectively) on grass only and grass white clover swards pre-grazing herbage height (a) sward type responses and (b) N application rate responses, and post-grazing herbage height (c) sward type responses and (d) N application rate responses from 2010 to 2013 grazing seasons. Data presented as least-squares means based regression analysis. Vertical bars represent standard error of the mean.

Effect of nitrogen (N) rate on herbage characteristics and chemical composition in grass only (GO) and grass white clover (GWc) swards averaged across 4 years (2010–2013)

s.e.m., standard error of the mean; DM, dry matter.
Annual herbage characteristics and chemical composition of grass only (GO) and grass white clover (GWc) swards averaged across four nitrogen application rates (0, 60, 120, 196 and 240 kg N/ha/year)

s.e.m., standard error of the mean; DM, dry matter.
The similar amounts of herbage removed observed between the two swards in the first two grazing events, in February and April, was unexpected, as clover contribution to mixed swards usually begins in late spring or even later (Frame and Newbould, Reference Frame and Newbould1986; Whitehead, Reference Whitehead1995; Andrews et al., Reference Andrews, Scholefield, Abberton, McKenzie, Hodge and Raven2007). In the first two seasons, by July the GWc swards had 37% more cumulative herbage removed than the GO swards across all treatments. Annually the GWc swards also had 37% more cumulative herbage removed than GO swards in those years (Table 2). It is possible that both the relatively mild/warm spring and the age of the swards in 2010 and 2011 promoted clover development earlier in the year, boosting overall herbage growth. However, in 2012, such an additive effect of clover was only observed by August and only for swards receiving up to 120 kg N/ha (+17%). In 2012, the weather conditions may have favoured PRG growth rather than clover (Wachendorf et al., Reference Wachendorf, Collins, Elgersma, Fothergill, Frankow-Lindberg BE Ghesquiere, Guckert, Guinchard, Helgadottir, Lüscher, Nolan, Nykänen-Kurki, Nösberger, Parente, Puzio, Rhodes, Robin, Ryan, Stäheli, Stoffel, Taube and Connolly2001; Unkovich, Reference Unkovich2012): milder winter temperatures, but relatively low temperatures in spring and summer up to July. In the fourth season (2013) the additive effect of clover on cumulative herbage removed was observed in July (+44%), but only for the swards receiving 0, 60 and 196 kg N/ha. Contrary to the previous year, an early mild winter probably initiated grass growth, but the cold and snow observed in April and drought conditions observed in summer compromised overall grass growth and it seems that the clover was less affected. In 2013 herbage removed was 37 and 20% less for GO and GWc, respectively, compared with 2012, while GWc sward clover content was 24% greater in 2013 than in 2012 (Table 2). Although it is known that clover is more sensitive than PRG to prolonged dry weather conditions (Wilman and Hollington, Reference Wilman and Hollington1985; Eckard et al., Reference Eckard, Chapman and White2007), it is likely that the high temperatures over that period favoured clover growth but suppressed PRG growth (Mitchell and Lucanus, Reference Mitchell and Lucanus1962; Davies, Reference Davies1992). Williams et al. (Reference Williams, Evans, Rhodes and Abberton2003) found that clover content under frequent and tight rotational grazing was relatively stable for at least 8 out of 10 years. As only 4 years of measurements were taken in the current study, it is not known if the clover recovery observed in the fourth year was a long-term effect, or if clover continues to disappear gradually after the first two highly productive seasons, as previously reported by Wilman and Hollington (Reference Wilman and Hollington1985) and Frame and Boyd (Reference Frame and Boyd1987).
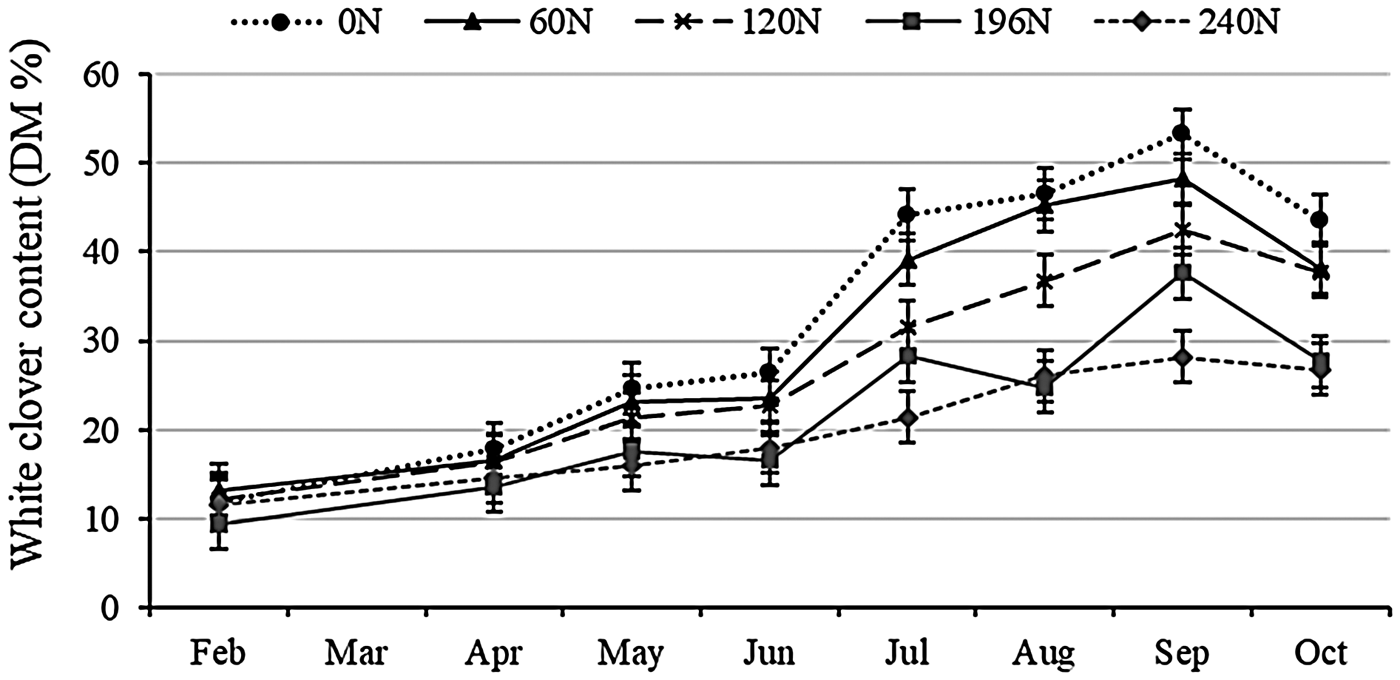
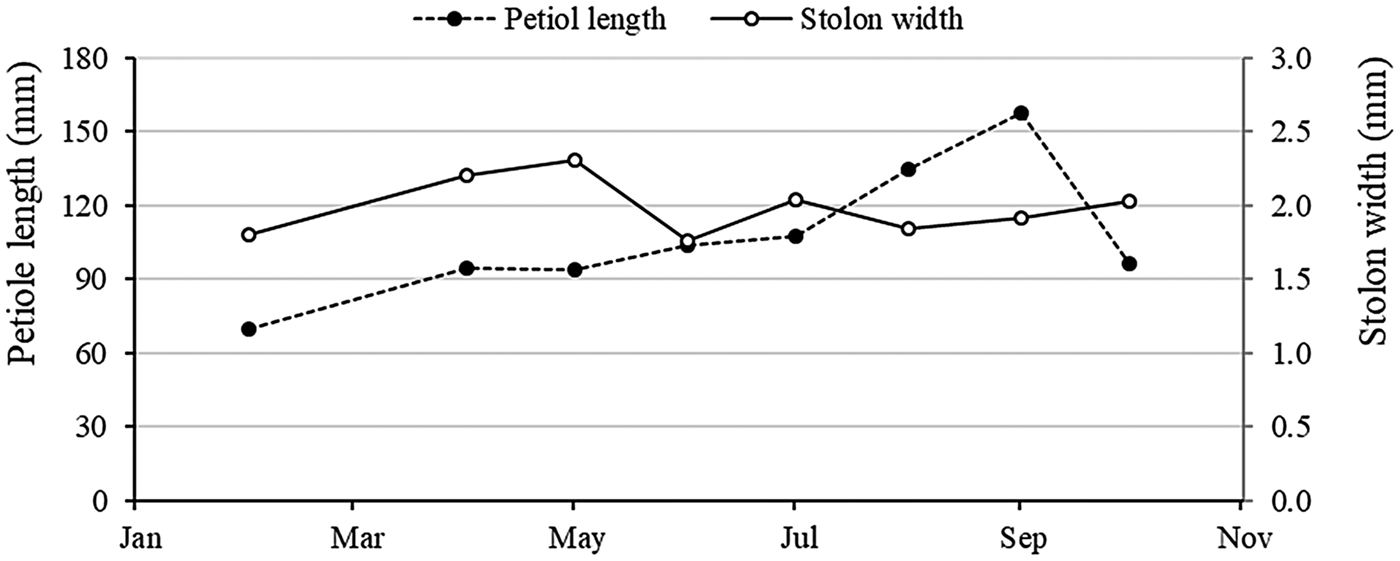
Increasing N fertilizer rate reduced clover content (Table 1) with the most deleterious effect observed in late-spring time (Fig. 4), which is in agreement with previous findings (Ledgard et al., Reference Ledgard, Sprosen, Steele and West1995; Harris et al., Reference Harris, Auldist, Clark and Jansen1998). The greatest clover content differences among treatments were observed in July, when the treatments receiving 120, 196 and 240 kg N/ha had 28, 36 and 51% less clover content than the swards that received no N, respectively (P < 0.001). However, applying 60 kg N/ha had little effect on clover content at most of the grazing events. The detrimental effect of N fertilizer on sward clover content has been attributed to the reduction in light quantity and quality available for clover (Thompson, Reference Thompson1995; Hoglind and Frankow-Lindberg, Reference Hoglind and Frankow-Lindberg1998) due to increased grass growth and resultant shading of clover. Increasing grazing intensity can promote high sward clover content (Williams et al., Reference Williams, Evans, Rhodes and Abberton2003; Yu et al., Reference Yu, Nan and Matthew2008; Enriquez-Hidalgo et al., Reference Enriquez-Hidalgo, Gilliland, Deighton, O'Donovan and Hennessy2014; Egan et al., Reference Egan, Lynch and Hennessy2016). In the experiment reported here, the PreGSH and herbage mass on the GWc swards were maintained below 13 cm and 2.0 t DM/ha, respectively, and the GWc swards were always tightly grazed (PostGSH <4.2 cm). Such conditions may have increased light transmission reaching clover stolons (Barthram et al., Reference Barthram, Grant and Elston1992; Hoglind and Frankow-Lindberg, Reference Hoglind and Frankow-Lindberg1998). The similarities observed in terms of PreGSH between the GWc swards suggest that the management used minimized the reduction in light availability that can result from faster PRG growth due to N fertilizer availability, which is in agreement with the seasonal changes in petiole length observed and the lack of N rate effect on petiole length. Clover petiole elongation in mixed swards is commonly reported when long regrowth periods occur and tillers usually grow taller than clover; and these trends are more pronounced when N fertilizer is applied (Faurie et al., Reference Faurie, Soussana and Sinoquet1996; Hoglind and Frankow-Lindberg, Reference Hoglind and Frankow-Lindberg1998). Therefore, it seems that in the study presented here the clover plant community had a high capacity to compete with PRG for a light interception. Thus, it is likely that the underlying mechanism explaining the detrimental effects of N application might be more closely related to the intensification of the natural advantage of grasses over clover in terms of nutrient uptake (Laidlaw and Søegaard, Reference Laidlaw and Søegaard1996).
Effect of nitrogen (N) application rate (0; 60; 120; 196 and 240 kg N/ha/year) on sward white clover (clover) content from 2010 to 2013 grazing seasons. Data presented as least-squares means based regression analysis. Vertical bars represent standard error of the mean.

Overall, the frequent and tight grazing management used in the current experiment reduced the suppression effect of N fertilizer on clover content, most markedly up to 120 kg N. Compared with the sward receiving no N, the application of 60, 120, 196 and 240 kg N/ha resulted in reductions in sward clover content of 8, 19, 35 and 41% over the 4 years of the study (Table 1), which is less than that reported by other authors. Frame and Boyd (Reference Frame and Boyd1987) reported a 48 and 81% reduction in sward clover content when 120 and 240 kg N/ha, respectively, were applied to mixed swards, and more recently Søegaard (Reference Søegaard2009) reported reductions in sward clover content of 37, 58 and 69% when 75, 150 and 225 kg N/ha, respectively, were applied to mixed swards.
Tiller density and stolon mass and width
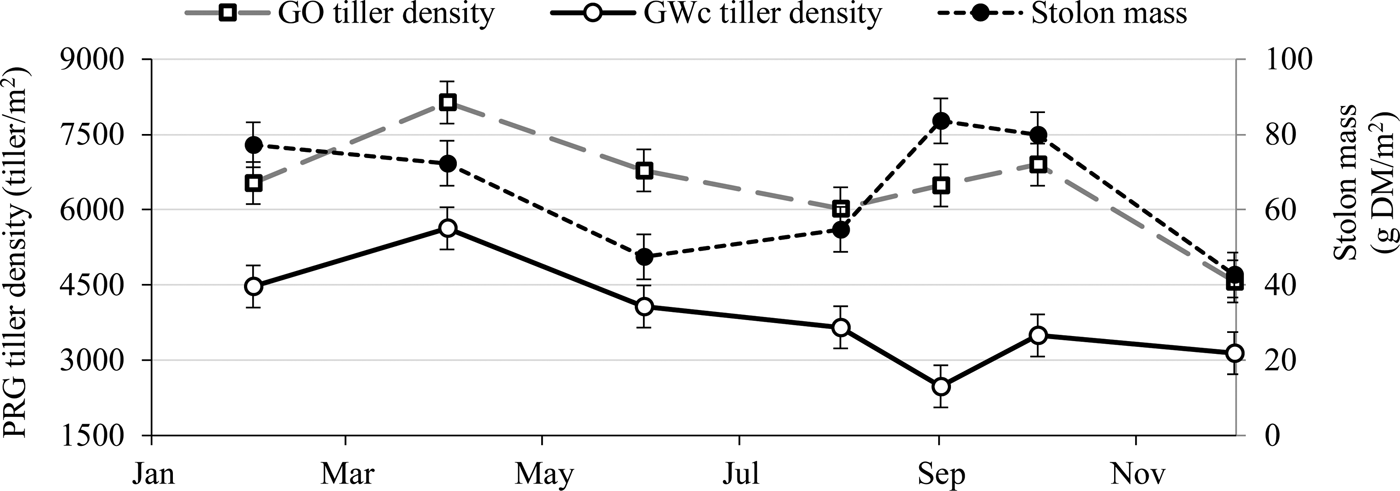
As expected, after the gradual stolon thickening process observed as the season progressed from spring to autumn (Fig. 5), rapid stolon thinning occurred during the winter/spring time (Brock et al., Reference Brock, Hay, Thomas and Sedcole1988; Yu et al., Reference Yu, Nan and Matthew2008), which might be related to high stolon death during the cold period. While stolon width was similar in all treatments, GWc swards receiving 196 and 240 kg N/ha had 20% less stolon mass than the other three treatments (61 v. 72 g DM/m2, respectively; s.e.m. = 2.9; P < 0.01; Fig. 6). Additionally, the stolon mass was reduced from 2011 to 2012 (88 and 43 g DM/m2, respectively; s.e.m. = 3.0; P < 0.001), probably related to the differences in weather conditions between those years as discussed previously. The 0N swards had 12.5% lower tiller density than the rest of the swards (4638 v. 5302 tillers/m2; s.e.m. = 205). While tiller density was stable in both swards in both years (5169 tillers/m2; s.e.m. = 191), the GO swards had greater (P < 0.05) tiller density than GWc swards at all times (Fig. 6). Brereton et al. (Reference Brereton, Carton and Conway1985) showed that clover development is compromised when tiller density is above 5000 tillers/m2. In the current experiment, tiller density in the GWc swards was above this threshold only in April, indicating that clover plant populations across all treatments were not under sufficiently acute pressure from this factor to affect clover survival. The density of unsown species in GO swards tended (P = 0.06) to be greater than in GWc swards (1822 v. 1282 tillers and plants/m2; s.e.m. = 145) and the 240N treatments had fewer unsown species than the other treatments (986 v. 1693 tillers and plants/m2; s.e.m. = 145).
White clover petiole length and stolon width in 2011 and 2012 grazing seasons. Data presented as least-squares means based regression analysis. Vertical bars represent standard error of the mean.

Average seasonal perennial ryegrass (PRG) tiller densities for grass only (GO) and grass white clover (GWc) swards and for stolon mass content in grazing seasons 2011 and 2012. Data presented as least-squares means based regression analysis. Vertical bars represent standard error of the mean.

Overall, the tiller density added to clover characteristics (content, petiole length and stolon mass and with) denotes that species stability was attained within the GWc swards, with better clover development with the low N rate treatments.
Herbage chemical analysis
The GWc swards had 11–16% lower average annual DM content than the GO swards (Table 1) and sward differences were maintained across years (Table 2). Increasing N rate reduced average annual DM content of GO swards but had little effect on GWc swards (Table 1). The GWc swards had 8% lower annual ash content than the GO swards in 2011 (P < 0.05, Table 2).
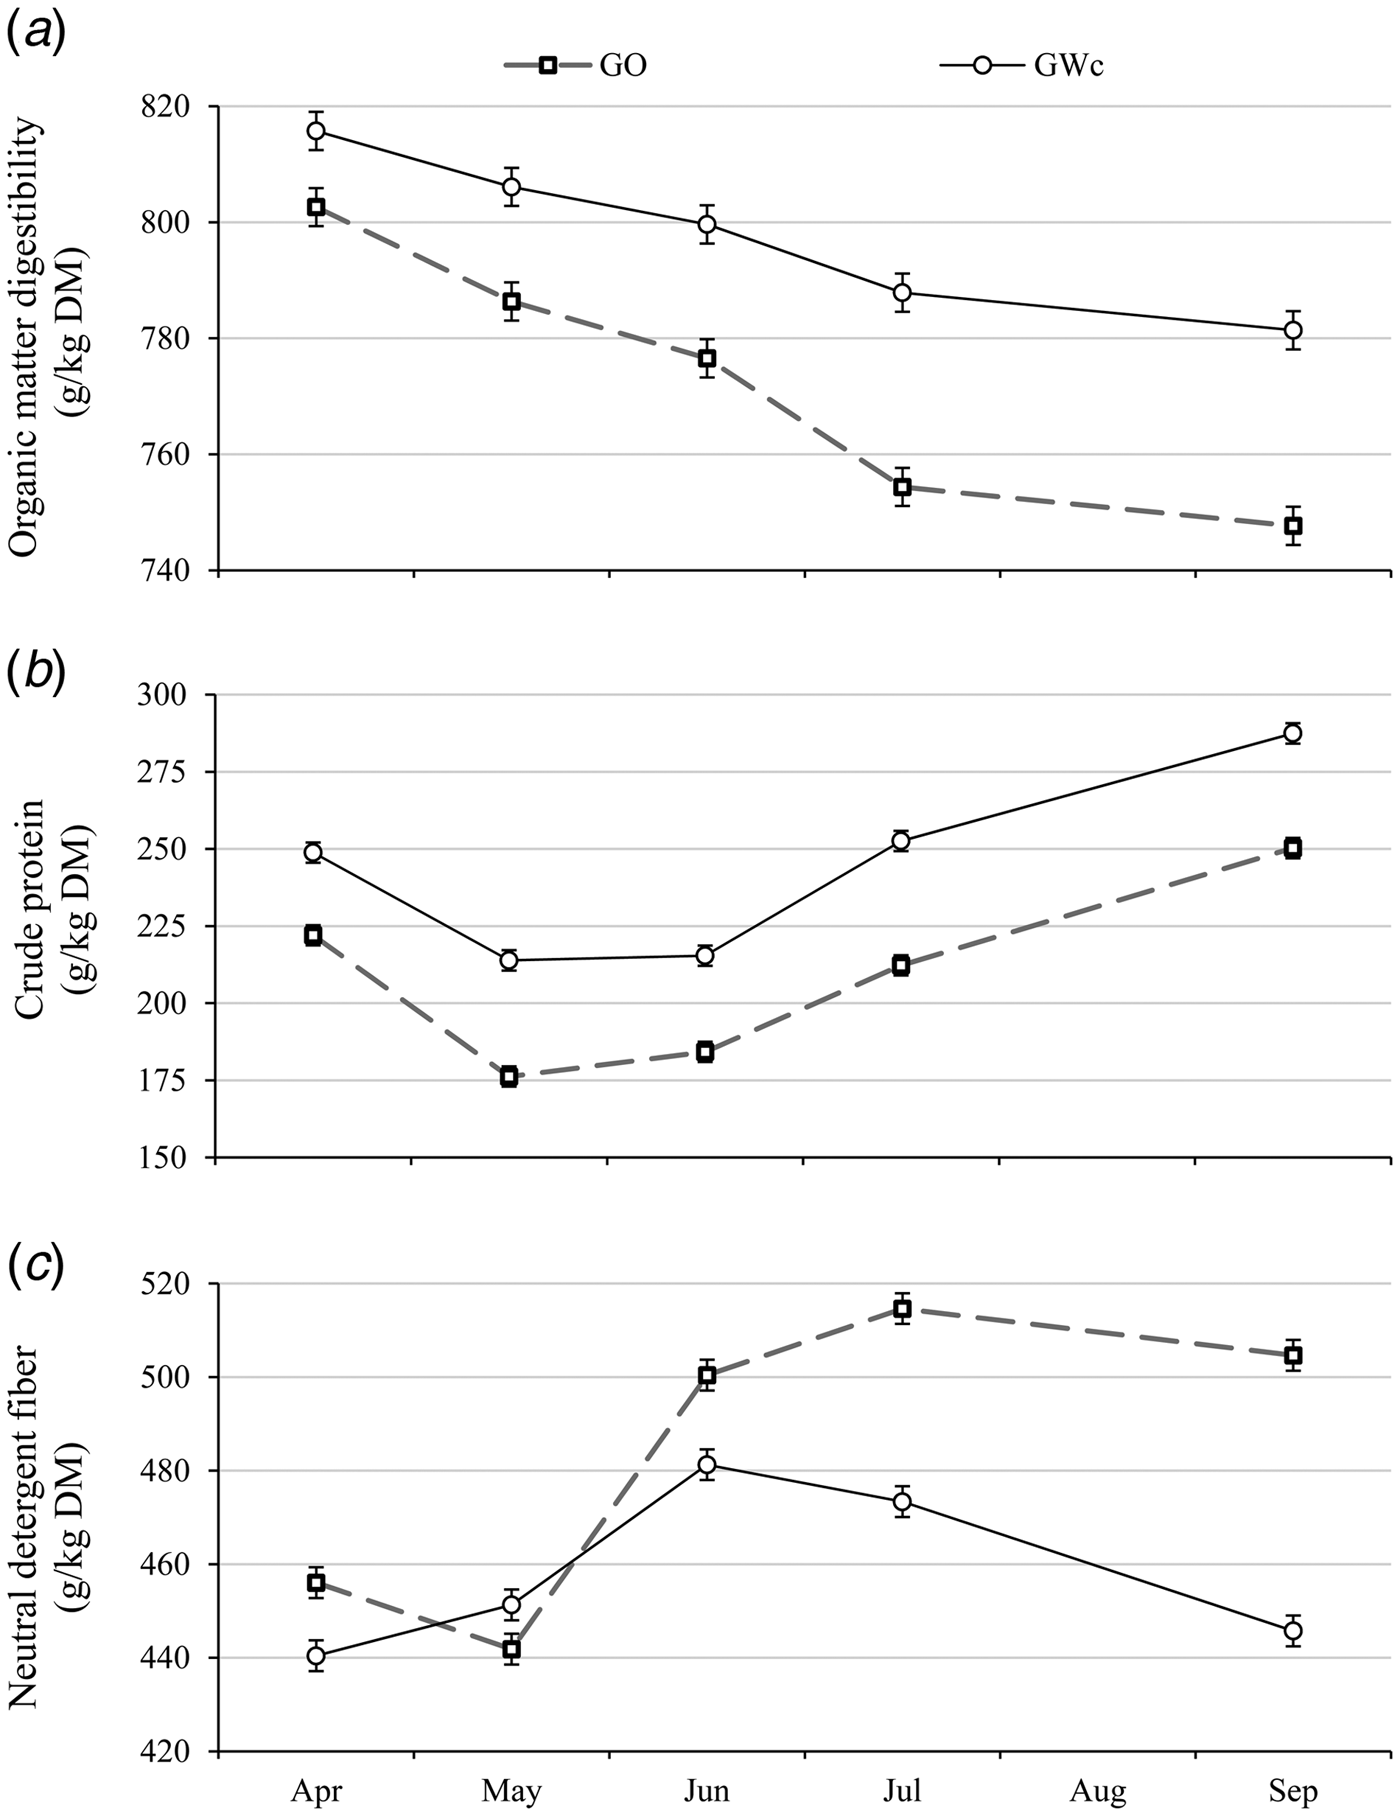
Herbage OMD was > 0.70 and herbage exceeded CP and NDF requirements of dairy cows most of the time (150 g CP/kg DM and 280 g NDF/kg DM) (Fig. 7; NRC 2001), however, herbage quality deteriorated as swards got older (Table 2). Although the low herbage masses promoted high-quality herbage overall (McEvoy et al., Reference McEvoy, O'Donovan, Kennedy, Murphy, Delaby and Boland2009; Enriquez-Hidalgo et al., Reference Enriquez-Hidalgo, Gilliland, Deighton, O'Donovan and Hennessy2014), GWc herbage was of better quality than that of the GO swards. The GWc swards had 0.01–0.03 higher OMD content (P < 0.05; Fig. 7(a)) and 27–40 g/kg DM higher CP content than GO swards (P < 0.001; Fig. 7(b)) across the seasons. The GWc swards had 10% less NDF content (P < 0.01) than the GO swards in July and September (Fig. 7(c)), but swards had similar ADF contents (Tables 1 and 2). A 10% increase in the monthly clover content represented a 1.5% increase in OMD, due to the 9.5% increase in CP content and 22.8% reduction in NDF content in GWc compared with GO. As a result, the GWc swards had 17 and 3% higher annual CP and OMD contents than the GO swards (P < 0.01), respectively, but these differences between swards reduced with increasing N rate (Table 1). Although N fertilizer is known to increase PRG CP content (Whitehead 1995; Andrews et al., Reference Andrews, Scholefield, Abberton, McKenzie, Hodge and Raven2007), the 240N GO swards still had lower CP content than the GWc swards. The reduction in sward clover content seen with increasing N fertilizer application may have been somewhat compensated for by the increase in PRG quality that N fertilizer promotes, which may explain the similar herbage quality across the GWc swards. While the GWc swards had 6% lower annual NDF content than the GO swards (P < 0.05), N rate had no effect on either NDF nor ADF contents (Table 1). Andrews et al. (Reference Andrews, Scholefield, Abberton, McKenzie, Hodge and Raven2007) suggested that an annual sward clover content of 20% may not be enough to enhance the overall feeding value of a mixed sward; however, the improved herbage quality of the GWc swards, even at the highest N rate, when sward clover content was on average 19.6%, contradicts such assertion. It is likely that the additive effect of the frequent grazing (Kleen et al., Reference Kleen, Taube and Gierus2011), the presence of clover, and the low herbage masses may be the reason for the difference. Although GWc swards had greater herbage quality than GO swards, it is possible that when clover is present, a large proportion of the N ingested by cattle is unutilized and excreted as urea (Ledgard et al., Reference Ledgard, Schils, Eriksen and Luo2009). The herbage quality decreased as the grazing season progressed (Fig. 7(a)), but less so in the GWc swards. The seasonal trends in herbage quality are related to the species’ growth patterns: while clover has a continual replacement of leaves (Frame and Newbould, Reference Frame and Newbould1986; Sturite et al., Reference Sturite, Henriksen and Breland2007), the turnover of PRG leaves declines in autumn (Hennessy et al., Reference Hennessy, O'Donovan, French and Laidlaw2008).
Effect of sward type (grass only (GO) and grass white clover (GWc)) on (a) organic matter digestibility, (b) crude protein and (c) neutral detergent fibre contents from 2011 to 2013 grazing seasons. Data presented as least-squares means based regression analysis. Vertical bars represent standard error of the mean.

Implications
The inclusion of clover in the GO swards resulted in increased herbage production and quality that can facilitate feeding more animals with a better-quality feed, thereby reducing the requirement for supplementation with other feedstuffs and with N fertilizer and improving farm sustainability and resilience. Also, indications are that sward clover content and species stability in a mixed sward can be maintained when the current grazing management is applied.
Conclusion
Under frequent and tight grazing management: (1) clover inclusion increased overall annual herbage removed by 2.9 t DM/ha/year, regardless of the N rate applied; (2) the GWc swards receiving no N had as much herbage removed as the GO sward receiving 240 kg N/ha, and the 240N GWc swards produced 1.8 t DM/ha/year more than the 240N GO swards; (3) herbage removed was similar for the two swards in spring, but more herbage was removed from summer onwards when clover was included; (4) N application maintained a low unsown species presence; (5) the management strategy applied in the current experiment may be capable of alleviating the detrimental N fertilizer effect on clover to a point between 60 and 120 kg N/ha; and (6) the increase in herbage nutritional quality due to clover inclusion was low in spring and greatest in summer–autumn, and also decreased with increasing N rate.
Supplementary material
The supplementary material for this article can be found at https://doi.org/10.1017/S0021859618000370.
Acknowledgements
The authors thank S. Fitzgerald, N. Galvin and M. Feeney for technical assistance and the staff of the Dairygold and Moorepark Research Farms for animal care of the and assistance with measurements.
Financial support
The authors are grateful to the Irish Dairy Levy Trust and Teagasc Walsh Fellowship Scheme for funding support.
Conflicts of interest
None.
Ethical standards
Not applicable.