
I. INTRODUCTION
In the very high cycle fatigue (VHCF) regime, interest is generally focused on the crack initiation phase as the life-determining phase (as discussed in the series of VHCF conferences since 1998, e.g., Refs. Reference Stanzl-Tschegg and Mayer1–Reference Berger and Christ5). However, in cases in which the crack initiation starts from natural defects such as inclusions, the crack initiation phase may be shortened significantly, and a substantial amount of the lifetime is spent in the crack propagation phase. Long lifetimes may still be achieved, if the loads are small enough to keep the crack in the near threshold regime. Thus attention in VHCF research has to be broadened from the classical VHCF scenario focused on crack initiation to the effect of very small cyclic loads on crack propagation.
Small cracks initiated from microstructural defects are known to propagate below threshold in an intermittent way due to interactions of the crack tip field with the microstructure. Reference Suresh6,Reference Navarro and de los Rios7 This effect is related to the fact that the crack tip field of these cracks is contained within one grain, and that dislocations emitted by the crack tip move along well-defined slip planes. Now, if the stress amplitude is very low, similar effects may happen to long cracks and may lead to unexpected crack extensions phenomena. Consequently, it may be worthwhile to study the crack extension behavior in the near-threshold regime.
Threshold values and their determination is a classical subject in fracture mechanics, which has been standardized by ASTM E 647. 8 The method proposed there relies on the so-called load-shedding procedure in which the range of the stress intensity factor is decreased until the crack growth rate falls below experimental resolution, which is typically set to be around 10−10 m/cycle. However, there has been a long-lasting controversy on the meaning of the threshold value determined by this method, as crack closure effects can shift this value toward higher values leading to unconservative estimates (e.g., Refs. Reference Newman and Zocher9–Reference Newman and Yamada13). The problems encountered with ASTM E 647 can be solved by an alternative approach developed by, among others, Pippan et al., Reference Pippan15,Reference Pippan, Plöchl, Klanner and Stüwe16 Forth et al., Reference Forth, Newman and Forman11 and Newman et al. Reference Newman, Schneider, Daniel and McKnight12,Reference Newman, Ruschau and Hill14 Starting with a specimen with a sharp notch, a load-free precrack is introduced by compressive cyclic loading. Then the load amplitude is increased in steps until the crack propagates continuously. Since the threshold is approached from below, the disadvantages of the load-shedding method mentioned above are circumvented. The cracks generated by the compression-precracking/constant amplitude procedure seem to be ideal candidates for studying crack growth at very low stress amplitudes and are used in this study to analyze the near-threshold behavior of long cracks in an aluminum alloy.
The paper is organized as follows: In Sec. II, the material and the experimental methods are described, where an overview of the fracture mechanics tests is given in Sec. III. Crack growth of long cracks in the near-threshold region and crack advance of small cracks are related in Sec. IV, which is followed by some concluding remarks.
II. MATERIAL AND EXPERIMENTAL METHODS
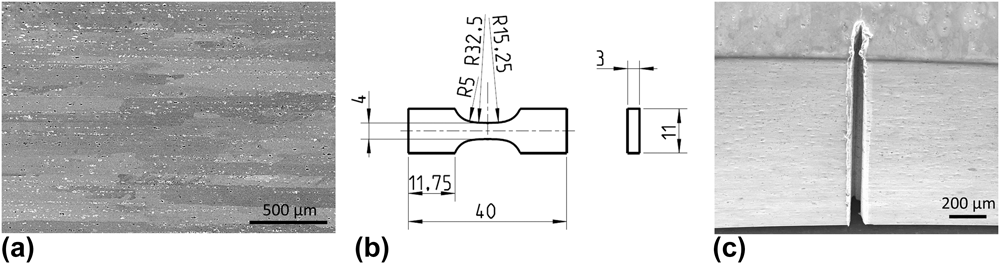
The material examined in this study is the aluminum alloy EN-AW 6082, which was peak-aged (6PA) and overaged (6OA) at the TU Dresden. R p0.2 and R m for the material 6PA have been determined in a tensile test as 336 MPa and 344 MPa, and 262 MPa and 294 MPa for material 6OA, respectively. A rolled sheet with a thickness of 20 mm and the microstructure shown in Fig. 1(a) taken in the rolling direction (RD) served as the base material. The grains are elongated with a maximum extension of up to 2000–3000 µm in RD and 100–200 µm in transverse direction (TD). Two types of primary precipitates can be detected in the microstructure: Mg-based ones [dark spots in Fig. 1(a)] and Fe-based ones [bright spots in Fig. 1(a)], which are arranged in a line-like fashion in RD.
(a) EN-AW 6082 SEM micrograph of the grain structure taken in RD (b) Specimen geometry and (c) The part-through notch located at the specimen radius.

Flat dogbone specimens with a total length of 40 mm and the geometry shown in Fig. 1(b) were machined out of the sheet material both in RD (rd) and TD (td). After mechanical and electrolytic polishing, a part-through notch with a depth of 150–200 µm and a notch radius smaller than 20 µm was cut in the specimen radius using a razor blade polishing technique similar to those proposed by Nishida et al., Reference Nishida, Pezzotti, Mangialardi and Paolini17 see Fig. 1(c). This technique is a common practice in ceramics but can also be used for metals, if the load applied to the razor blade is small enough. The main advantage of this technique is that extremely sharp notches can be made exhibiting only little plastic deformation.
The specimens were prefatigued in compression, so that the precrack is open when unloaded. After applying 500.000 cycles at a stress ratio of R = 20 and a stress level of σmin = −290 MPa for the material 6PA, and σmin = −208 MPa for material 6OA, respectively, the experiment was started. All investigations were performed on a Rumul Mikrotron resonance pulser at a frequency of approximately 104 Hz in laboratory atmosphere. A long-distance microscope was used to monitor the crack growth on the specimen surface, enabling the documentation of the crack propagation when the cyclic load is interrupted by stopping the testing machine. The crack growth rate was calculated using the measured crack length and the number of testing cycles between the scans.
The threshold value was determined using the stepwise increasing load amplitude crack growth test described in Ref. Reference Pippan, Plöchl, Klanner and Stüwe16. After precracking in compression, testing was changed to a push–pull load (R = −1) at a very small stress amplitude (20 MPa) to let the crack propagate. If no crack growth was detected after 500.000 cycles, the stress amplitude was increased by 10%. This procedure was repeated until the crack propagated in a stable manner. The threshold was then defined using the stress amplitude, which led to continuously crack growth.
Once the threshold was known, specific values of the stress amplitude were selected corresponding to ranges to the stress intensity factor just above or just below the threshold value for the starting crack length of 500 µm. The crack was then propagated at constant stress amplitude until the crack advance, visible on the surface, amounted to 100 µm. The stress amplitude was then decreased such that the initial value of the range of the stress intensity factor (SIF) was recovered. This procedure was repeated until the crack reached a length of 1500 µm, or the growth rate fell down to 10−11 m/cycle, which was defined as the criterion for a crack stop. Continuous adjusting of the stress amplitude allows propagating cracks at nearly constant ranges of the SIF with variability of K max and K min of around 10%.
III. EXPERIMENTAL RESULTS
A. Long-crack threshold
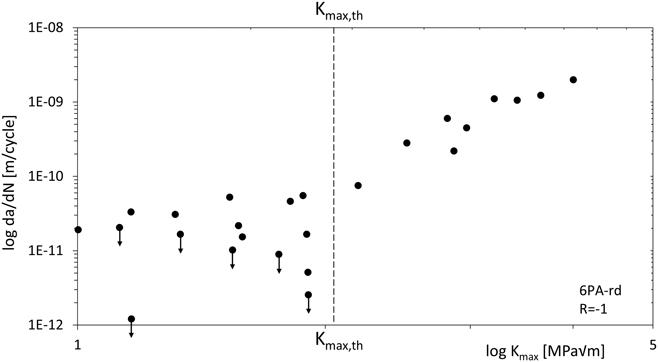
To measure the long-crack threshold, three tests with specimens taken from the peak-aged material 6PA were performed according to the method described in Sec. II. The cutting direction corresponds to the RD (6PA-rd), which means that the crack grows across the elongated grains [compare Fig. 1(a)]. The resulting da/dN versus K max-curve of one experiment is shown in Fig. 2, where the range ΔK was replaced by K max as usual for tests with R = −1. Left to the dashed line, representing the threshold value of K max,th = 2.1 MPa√m (maximum value determined in the tests), the crack stopped repeatedly (black arrows in Fig. 2), so that the stress amplitude had to be increased by 10%. After reaching the threshold value, the crack grows stably at a constant stress amplitude and shows long crack behavior right to the dashed line.
da/dN versus K max-curve with threshold K max,th determination.

Reaching the threshold value further leads to a change of the crack growth rate of at least one order of magnitude. While the crack growth rate is in the range between 10−11 and 10−10 m/cycle below the threshold, it increases to values of 10−10 to 10−9 m/cycle after passing the threshold. This notable transition of the crack growth rate was also observed in the two additional tests with resulting values of K max,th = 1.32 MPa√m and K max,th = 1.56 MPa√m. The variance in the threshold values already points out the high dependency of this material parameter on both, the measurement method and the microstructure. Based on these three experiments, a mean threshold value of K max,th = 1.7 MPa√m was defined as a basis for the subsequent crack propagation tests.
B. Crack growth at K max = const.
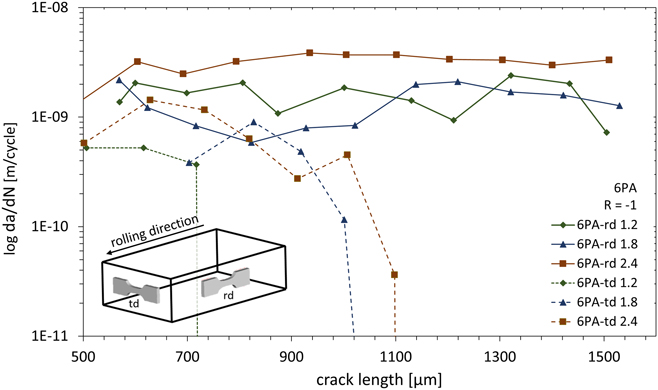
The influence of the microstructure and precipitates on crack growth was investigated in experiments at quasi-constant K max, where the range of measurement was restricted to crack lengths between 500 and 1500 µm, including the notches. While the peak-aged specimens were tested in RD (6PA-rd) and TD (6PA-td), the overaged ones were evaluated only in RD (6OA-rd). On the basis of the determined threshold, SIF values between 0.7 and 2.4 MPa√m were defined. The measured crack propagation rates versus the crack length values of the rd- and td-oriented samples of material 6PA tested at 1.2, 1.8, and 2.4 MPa√m are depicted in Fig. 3.
Crack propagation rates of material 6Pa in rd- and td-orientation.

The rd-oriented specimen tested at the highest K max value of 2.4 MPa√m showed no significant dependency on the microstructure but a nearly constant propagation rate of approximately 3 × 10⁻⁹ m/cycle. Decreasing the SIF to a value of 1.8 MPa√m resulted in a decrease in the crack propagation rate and an increase in the variation over the crack length. Crack propagation rate and the variation at a load of 1.2 MPa√m were comparable to those measured at a load of 1.8 MPa√m. A different behavior was observed for the td-oriented samples since the crack propagation rates at all load amplitudes were lower compared to those machined in the RD. In particular, a sharp decrease in the crack propagation rates was observed after a certain amount of crack extension, resulting in a crack arrest independent of the applied load. The final crack length, in turn, decreased with decreasing K-factor.
No significant differences were found for the rd-oriented specimens machined from material 6OA. Again, the variation in the crack growth rates at constant SIF values increased with decreasing K-values similar to the peak-aged material in rd-orientation.
C. Crack paths
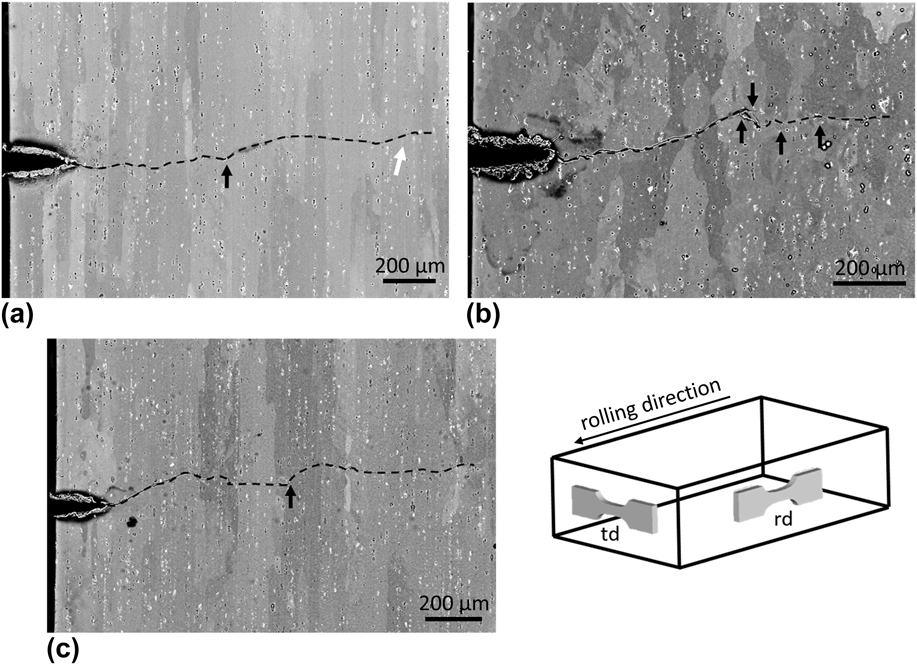
The crack paths visible on the surface were analyzed to further investigate the crack growth behavior at K max = const in dependency of the heat treatment condition and specimen orientation. A comparison of the crack paths of the investigated materials 6PA and 6OA at a load of 1.8 MPa√m is shown in Fig. 4. While the cracks in the rd-oriented samples grew until the crack length of 1500 µm was reached and the test was stopped, the crack in the td-oriented specimen of material 6PA stopped after approximately 1000 µm, see Fig. 3. The predominant crack propagation direction is mode-I with a certain amount of crack kinking (black arrows) or even crack branching when the crack path encounters primary precipitates. It can be seen that these precipitates are aligned in RD (rd) and form irregular clusters in TD (td) with crack branching being related to the occurrence of these clusters.
SEM micrographs showing the crack paths at 1.8 MPa√m: (a) 6PA-rd, (b) 6PA-td, (c) 6OA-rd.

A closer inspection shows that there are occasionally certain sections of the crack path in which the crack seems to propagate in a shear-dominated mode rather than in mode-I [white arrow in Fig. 4(a)]. These sections are normally restricted to one grain and only occur in regions with no primary precipitates. Consequently, they are very rare in the td-specimens where grain boundaries and primary precipitates are not correlated. No significant differences can be found when the crack paths of the peak-aged and the overaged material are compared.
D. Fracture surfaces
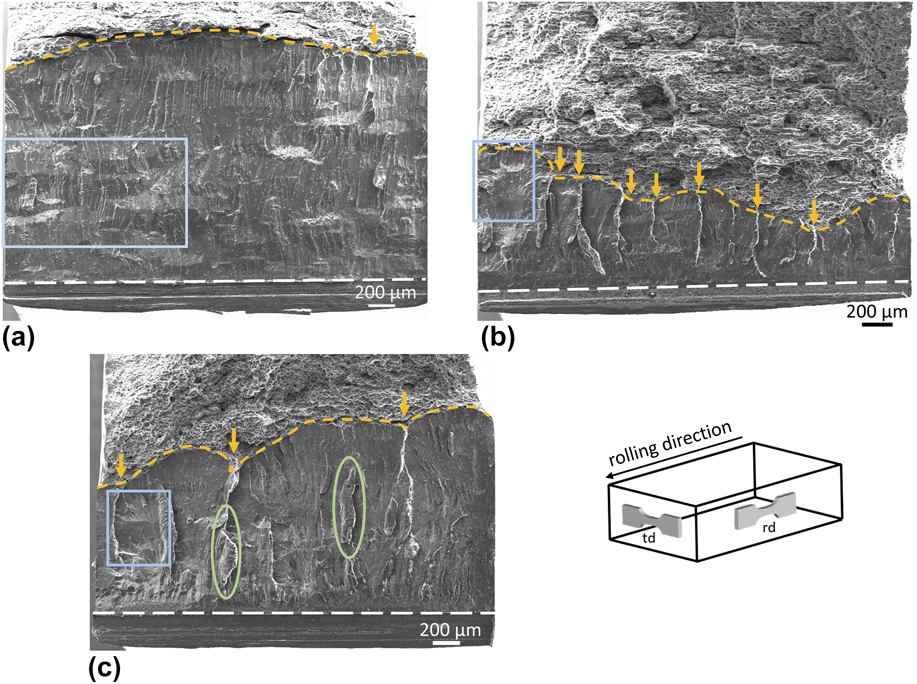
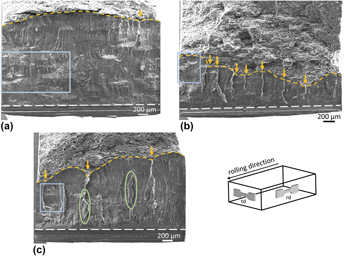
After the crack propagation tests, the fracture surfaces were analyzed to gain additional information on the crack propagation behavior. For this purpose, the specimens were cooled down in liquid nitrogen and cracked in tension to introduce as little plastic deformation as possible. In Fig. 5, the fracture surfaces of specimens in peak-aged and overaged state tested at K max = 2.4 MPa√m, are presented.
SEM micrographs showing the fracture surfaces at 2.4 MPa√m: (a) 6PA-rd, (b) 6PA-td, and (c) 6OA-rd.

Figure 5(a) shows the fracture surface of the rd-oriented specimen of material 6PA. The crack, growing perpendicular to the elongated grains, seems to follow a zigzag path in the near surface regions. An example is the “hilly” structure highlighted by the blue square in Fig. 5(a). This implies that there is a certain amount of shear-controlled crack growth, which will be discussed in Sec. IV. Only a small irregularity of the crack front, marked with the yellow arrow, can be detected. The difference in crack length between the observed specimen front shown on the right side of Fig. 5(a), and the specimen at the back is 60 µm. All in all, the fracture surface is smooth except for the hills mentioned above. This correlates with the measured crack propagation rate, which was nearly constant.
Significantly different characteristics were detected on the fracture surface of the specimen taken from the material 6PA in td-orientation. While the crack grew to a length of approximately 1100 µm on the observed specimen front, shown on the left side of Fig. 5(b), it stopped after a length of approximately 675 µm on the specimen backside. As it can be seen in Fig. 5(b), the crack front is very irregular with many kinks extending as lines into the fracture surface [orange arrows in Fig. 5(b)]. Furthermore, there are hilly regions on the fracture surface, as the ones in the rd-oriented samples, but they are less common in the td-case.
The fracture surface of the material 6OA in rd-orientation is shown in Fig. 5(c). The crack front of the crack propagated at a K max of 2.4 MPa√m is also of irregular form over the specimen width. While the crack grew to a length of approximately 1523 µm on the observation side, [right side in Fig. 5(c)] it stopped after reaching a length of approximately 1031 µm on the specimen backside. As in the case of 6PA-td there are some kinks in the crack front [orange arrows in Fig. 5(c)] with white lines extending into the crack surface. The hilly features which were very frequent in the peak-aged case [Fig. 5(a)] are rare with only one clear hill found [highlighted by blue square in Fig. 5(b)]. However, a new feature occurs in the fracture surfaces of the overaged material in form of ridges on the fracture surface [green ellipse in Fig. 5(c)]. These ridges appeared in a less pronounced form on the fracture surface of the peak-aged material in td-orientation where they were always related to the kinks in the crack front, whereas they showed up as isolated features on the fracture surface in the overaged case.
IV. DISCUSSION
A. Crack propagation rates
Crack growth tests with a constant range of the stress intensity factor reveal that there is a certain minimum crack growth rate required for continuous crack extension. This minimum crack growth rate seems to amount to 10−9 m/cycle. If the crack growth rate falls below this value, the energy input per cycle is not high enough to overcome the microstructural barriers, and chances are high that parts of the crack front lag behind, and the crack will eventually stop. This phenomenon seems to be independent of the material state and specimen orientation, even though there are pronounced differences as to the number of obstacles sampled by the crack front and their efficiency.
There is a physical motivation for a minimum crack propagation rate above 10−10 m/cycle, as the interatomic distance and the length of the Burgers vector in aluminum, respectively, are 2.86 × 10⁻¹⁰ m. Consequently, the crack propagation rate is in the order of one interatomic distance per cycle, which is the discrete minimum crack elongation per cycle according to Zerbst et al. Reference Zerbst, Vormwald, Pippan, Gänser, Sarrazin-Baudoux and Madia18 According to Zerbst et al., smaller crack growth rates (e.g., Refs. Reference Stanzl-Tschegg19–Reference da Fonte, Romeiro, de Freitas, Stanzl-Tschegg, Tschegg and Vasudeven22) can be either attributed to measuring uncertainty or to the fact that crack propagation rates are very often averaged over a certain number of cycles. In the procedure adopted here, this is certainly an effect which has to be taken into consideration, as recordings of the crack advance were made every 100 µm. If a crack stopped between two recordings and propagated afterward, the real crack propagation rate can be close to the above-mentioned value, while the recorded value is much lower with values ranging down to 10−11 m/cycle.
B. Role of microstructural barriers
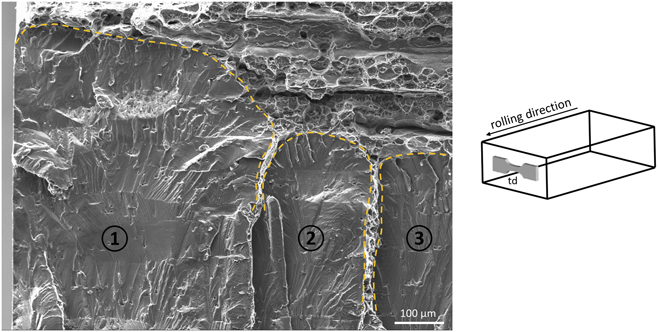
From the crack paths shown in Fig. 4, it can be concluded that the primary precipitates act as microstructural barriers, since they can deviate the crack. The fracture surfaces shown in Fig. 5 indicate that these barriers have a stronger influence in the td-direction than in the rd-direction in the peak-aged state, as the crack front is apparently held up at several locations. A closer inspection (see Fig. 6) of the white lines shown in Fig. 5(b) reveals that these lines are actually ridges of ductile fracture decorated by dimples. This means that the crack front was locally pinned, and that the crack faces were bridged by material ridges, which failed by ductile fracture. Very strong pinning can lead to crack arrest, with a transition stage characterized by partially pinning, leading to a skewed crack front.
Close up of the fracture surface of specimen 6PA-td tested at 2.4 MPa√m showing lines of ductile fracture.

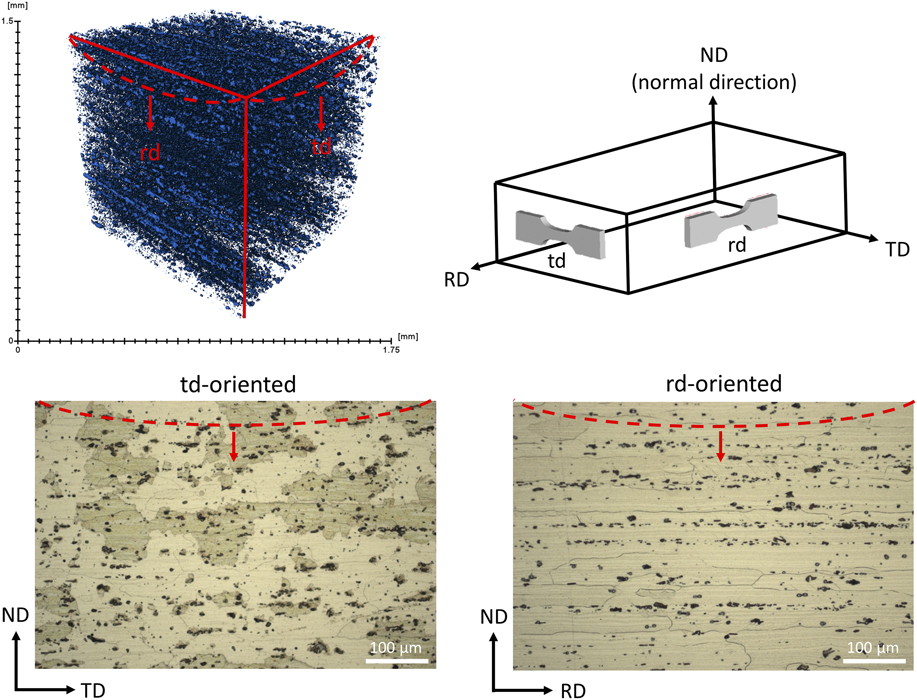
Evidently, the number of pinning points has to be related to the microstructure and to the rolling texture. Comparison of Figs. 5(a) and 5(b) shows that the number of pinning points is significantly reduced in the rd-oriented specimen compared to the td-specimen. This effect may be correlated with the spatial distribution of the primary precipitates, see Fig. 7. In the rd-specimen, the crack front passes through well-defined precipitate lines, which decorate the grain boundaries. It either stops completely or overcomes this line. In other words, local pinning of the crack front is rather unlikely as the complete line acts as a microstructural barrier. In the td-oriented specimen, on the other hand, the crack front passes through local precipitate clusters, which are visible as black dots in Fig. 7 and act as pinning sites. Local propagation of the crack front is possible in precipitate-free areas leading to the kinked crack front shown in Fig. 5(b).
CT scan and micrographs illustrating the position of the crack front according to the primary precipitates.

The pinning potential of primary precipitates seems to be increased in the overaged case, as ridges of ductile fracture and pronounced crack front kinking were observed even in the rd-oriented specimen [see Fig. 5(c)]. It can be conjectured that the coarsening of the secondary precipitates by the heat treatment is accompanied by a migration toward the existing primary precipitates which would then, in turn, explain the increased pinning potential.
C. Plastic zone ahead of crack tip
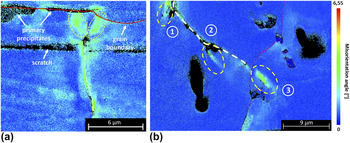
The crack tip fields were analyzed via misorientation mapping derived from an EBSD analysis in a high resolution SEM. The crack tip field of a specimen taken from the material 6PA in rd-orientation tested at 1.8 MPa√m is depicted in Fig. 8(a). The crack had reached a length of about 1500 µm and was growing steadily when the fatigue test was interrupted. The zone ahead of the crack tip marked by the yellow circles is characterized by two regions of increased misorientation which exhibit the expected form of a plastic zone of a mode-I crack. Neither the primary precipitates nor the grain boundary in front of the crack tip appear to have a significant influence on this zone at the time of measurement.
Crack tip field of specimen (a) 6PA-rd tested at 1.8 MPa√m and (b) 6PA-td tested at 0.7 MPa√m.

However, there are cases in which the misorientation distribution and hence the crack tip field deviates significantly from the classical fracture mechanics mode-I case. An example is shown in Fig. 8(b). At points ① and ② in Fig. 8(b), the crack was deviated from its original propagation direction by primary precipitates (Fe-containing primary precipitate at point ① and Mg2Si-containing precipitate at point ②). The misorientation field derived from EBSD-data indicates that the major part of the plastic deformation ahead of the crack tip coincides with the crack path direction. This implies that the crack extension is shear-dominated and is very similar to the stage-I extension of a very small crack. The crack seems to follow a given slip direction until it encounters a barrier in the form of a primary precipitate. Then a new slip direction is selected leading to a different crack extension direction, and shear-controlled crack growth is resumed.
Moreover, the hilly structures visible on the fracture surfaces, which are a quite dominant feature for the peak-aged specimens [see Fig. 5(a)], can be interpreted as the remnants of shear-dominated crack growth. A hill occurs when the extension direction is reversed either by deflection caused by a primary precipitate or by a change of the slip system induced by grain boundaries.
V. CONCLUSIONS
Results of crack growth experiments at very low load amplitudes on peak-aged and overaged aluminum specimens precracked in cyclic compression were presented. It was demonstrated that the method described in Ref. Reference Pippan, Plöchl, Klanner and Stüwe16 is suited for the determination of the long-crack threshold using small specimens. On this basis, crack growth experiments with a nearly constant K max-value propagation rate were performed with specimens taken in RD and TD. The major findings can be summarized as follows.
-
(1) In the near-threshold regime there is a minimum crack propagation rate, which is required for continuous crack propagation. The value of this minimum growth rate corresponds approximately to one Burger’s vector per cycle.
-
(2) Primary precipitates contribute in many ways to the morphology of the crack path. This not only includes crack deflection and crack branching but also some more surprising features.
-
(3) Primary precipitates can pin the crack front, with the amount of pinning depending on the spatial distribution of the precipitates. The “pinning ability” of the primary precipitates is more pronounced in the overaged case.
-
(4) Shear-dominated crack extension similar to that of small stage-I cracks is possible even for very long cracks in the near-threshold regime, if the load amplitude is small enough.
-
(5) Cracks in the near-threshold regime which extend in a shear-dominated mode can be deterred by primary precipitates but remain in the shear-dominated mode afterward.
ACKNOWLEDGMENT
The authors would like to thank the German Research Foundation (DFG) for financial support.