Introduction
Satellite communication systems require linear transmitters for increasingly broadband multi-carrier signals with high peak-average power ratios (PAPR). As single TWT transmitters are replaced by solid-state phased arrays, the demand on efficiency at the element level increases due to thermal limitations. Average efficiency of power amplifiers degrades for high PAPRs since the PA operates in back-off most of the time. The unit-cell size of a phased array decreases linearly with free-space wavelength, while circuit size decreases slower and for high-power densities GaN MMICs are a possible solution. Published examples of GaN PAs at K-band exist in both commercial [Reference Din, Morishita, Yamamoto, Brown, Wojtowicz and Siddiqui1, Reference Reece, Contee and Waiyaki2] and research processes [Reference Noh and Yom3–Reference Friesicke, Jacob and Quay7]. Doherty amplifiers [Reference Campbell, Tran, Kao and Nayak8, Reference Valenta, Davies, Ayllon, Seyfarth and Angeletti9] and a single-ended linear amplifier [Reference Noh and Yom3] have also been designed in GaN at K-band to address back-off efficiency and linearity, respectively.
Envelope tracking (ET) or supply modulation (SM) offers an alternative architecture to single-ended and Doherty amplifiers at K-band. In this approach, the supply voltage changes dynamically with the input amplitude of the modulated drive signal, keeping the amplifier in compressed efficient operation [Reference Asbeck and Popovic10]. Continuous supply modulators, usually based on a fast DC-DC converter [Reference Jeong, Kimball, Kwak, Hsia, Draxler and Asbeck11, Reference Zhang, Rodríguez and Maksimović12], have limited slew rates if operated efficiently, with degraded performance for higher bandwidth signals [Reference Jeong, Kimball, Kwak, Hsia, Draxler and Asbeck11, Reference Olavsbråten and Gecan13]. Alternative discrete supply modulators (DSM), usually based on a bank of switches [Reference Wolff, Bengtsson, Schmidt, Berroth and Heinrich14–Reference Sepahvand, Momenroodaki, Zhang, Popović and Maksimović16], approximate the continuous supply modulator voltage, and can be operated with a lower switching speed and thus perform better for broadband signals [Reference Wolff, Bengtsson, Schmidt, Berroth and Heinrich14].
For GaN implementations of both PA and dynamic supply, modulation bandwidths of up to 80 MHz with continuous SM were demonstrated for a sub-6 GHz PA [Reference Sakata, Lanfranco, Kolmonen, Piirainen, Fujiwara, Shinjo and Asbeck17]. Discrete SM has exceeded this with an eight-level tracker showing 100 MHz modulation bandwidth [Reference Cappello, Pednekar, Florian, Cripps, Popovic and Barton18] and a three-level tracker showing a 120 MHz modulation bandwidth [Reference Wolff, Heinrich and Bengtsson19], both for sub-6 GHz carrier frequencies. X-band implementations of SM have also been demonstrated; however, the modulation bandwidths have not exceeded 20 MHz [Reference Cappello, Florian, Niessen, Paganelli, Schafer and Popovic20, Reference Zai, Li, Schafer and Popovic21]. At K-band, discrete SM with concurrent gate modulation was shown in GaAs for a signal bandwidth of 1 MHz [Reference Forestier, Bouysse, Quere, Mallet, Nebus and Lapierre22]. Higher modulation bandwidths (20 MHz) were achieved at single-digit efficiency with SM and an off-the-shelf GaAs Q-band (44 GHz) amplifier [Reference Yan, Presti, Kimball, Hong, Hsia, Asbeck and Schellenberg23].
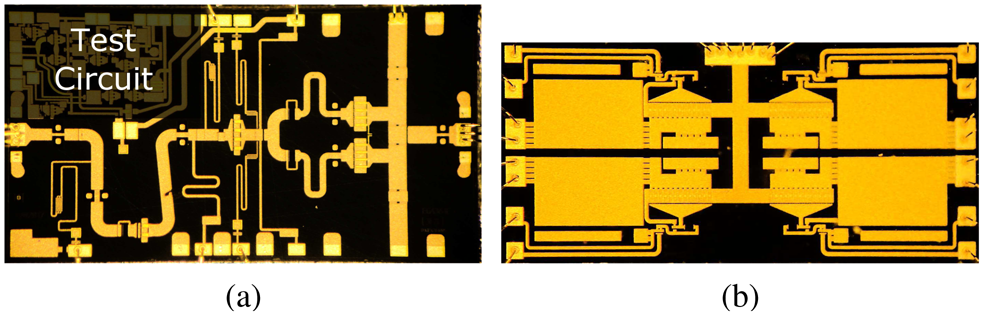
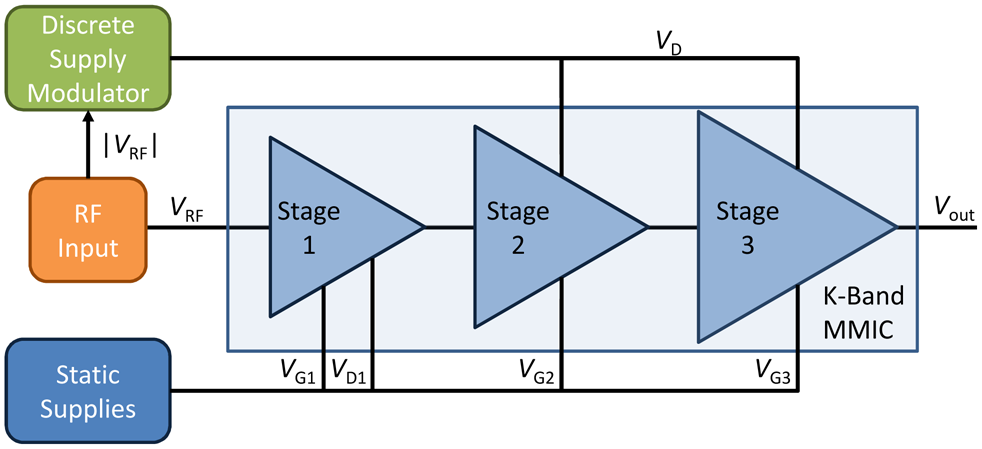
In this work, a three-stage GaN MMIC K-band PA [Reference Duffy, Lasser, Nevett, Roberg and Popović24], Fig. 1(a), designed for satellite repeaters, is tested at 19.8 GHz with drain SM as shown in Fig. 2. An efficient GaN MMIC DSM [Reference Sepahvand, Momenroodaki, Zhang, Popović and Maksimović16], Fig. 1(b), is used to generate the drain supply voltage. The SM shaping function is designed to increase efficiency while improving linearity over that of a PA with a static supply. We employ noise power ratio (NPR) as a linearity metric, widely accepted in the satellite communications community [Reference Din, Morishita, Yamamoto, Brown, Wojtowicz and Siddiqui1, Reference Valenta, Davies, Ayllon, Seyfarth and Angeletti9]. It is obtained by exciting the amplifier under test with a band-limited white noise signal with a narrow notch at the center and measuring the ratio between the average output power outside the notch and the average power in the notch created by intermodulation [Reference Reveyrand, Barataud, Lajoinie, Campovecchio, Nebus, Ngoya, Sombrin and Roques25, Reference Pedro and De Carvalho26]. NPR can be related to measures like adjacent channel power ratio (ACPR), but only for memory-less, third-order systems [Reference Pedro and De Carvalho26]. For some satellite applications NPR values as low as 12 dB are acceptable, while we strive for higher values around 25 dB in this work.
Fabricated GaN MMICs: (a) K-band amplifier (4 mm$\times$ 2 mm) and (b) four-level discrete supply modulator (5.4 mm$\times$
 2.6 mm).

Block diagram of supply-modulated transmitter with a dynamic drain voltage $V_{\rm D}$ on the second and third stage of a three-stage PA, while the first-stage supply is static ($V_{\rm D1} = {\rm const}$
 ). The three gates are statically biased.

Using several methods to reduce the switching speed requirements for the supply modulator, a modulation bandwidth of 100 and 250 MHz are demonstrated. For 100 MHz signals with ${\rm PAPR}\gt 10\, {\rm dB}$ , we demonstrate an average efficiency improvement from 14 to 20% with a simultaneous linearity improvement in NPR from 23 to 26 dB through a shaping function focused on gain linearization. For 250 MHz instantaneous signal bandwidth, there is no observed degradation in NPR and the efficiency is improved by 5 percentage points. The results are an extension of the work in [Reference Duffy, Lasser and Popović27], where the signal bandwidth was limited to 50 MHz. In addition to extending the signal bandwidth as much as five times, we characterize the effects of finite switching speed of a dynamic discrete supply, and develop a new shaping function that circumvents the negative effects of the finite switching speed.
K-band amplifier and discrete supply modulator MMICs
The K-band amplifier in this work is designed in the Qorvo 150-nm Gan-on-SiC process with slot vias. The maximum gate voltage, $V_{\rm D} =$ 28 V, can be used in this process but the presented amplifier uses a maximum of $V_{\rm D} =$
 20 V and is designed for a 100 mA/mm quiescent current. The three-stage amplifier has a 1:2:8 staging ratio with two 8x100 $\mu$
 m transistors with internal source vias in the output stage. The peak output power of the amplifier is 4 W with an efficiency greater than 35% and saturated gain exceeding 20 dB from 18.5 to 24 GHz. A photo of the MMIC can be seen in Fig. 1(a). A detailed discussion of the design and static characterization of the amplifier can be found in [Reference Duffy, Lasser, Nevett, Roberg and Popović24]. It is determined that SM of the last two stages is a good compromise between efficiency improvement and gain linearity.
The DSM is designed in an older, then experimental, version of the Qorvo 150 nm Gan-on-SiC process. This process makes use of circular instead of slot vias. The circuit consists of four hard switching transistors connected to a single output node. The switches are used to toggle between discrete voltages that are supplied externally from the MMIC. Snubber circuits are integrated on MMIC to reduce ringing associated with switching transitions. On-chip gate-drivers are also integrated in GaN to minimize the effects of parasitics on switching. Due to the lack of complementary devices in GaN, the gate-driver circuit uses both active and modified active pull-up drivers designed to minimize quiescent current draw from the driver transistors. Throughout this work, composite efficiency is quoted two ways, one incorporating gate-driver losses, and one without. A photo of the SM circuit can be seen in Fig. 1(b), and a detailed discussion of the design and characterization is presented in [Reference Sepahvand, Momenroodaki, Zhang, Popović and Maksimović16].
Amplifier characterization
The amplifier was initially characterized with a modulated signal under static supply operation for multiple drain voltages and signal bandwidths. The signal used throughout this work is a noise-like NPR test signal [Reference Reveyrand, Barataud, Lajoinie, Campovecchio, Nebus, Ngoya, Sombrin and Roques25]. Carriers (30 000) are created in the frequency domain and assigned a random uniformly distributed (0–2$\pi$ ) phase. Several carriers are removed from the center of the signal to create a notch, in this case with a 1% bandwidth. This signal is then converted into the time-domain, the PAPR is computed and tested for $10.5\pm 0.5\, {\rm dB}$
 . Signals outside this specification are discarded and a new signal with random phase is created until an acceptable signal is found and sent to an arbitrary waveform generator (AWG).
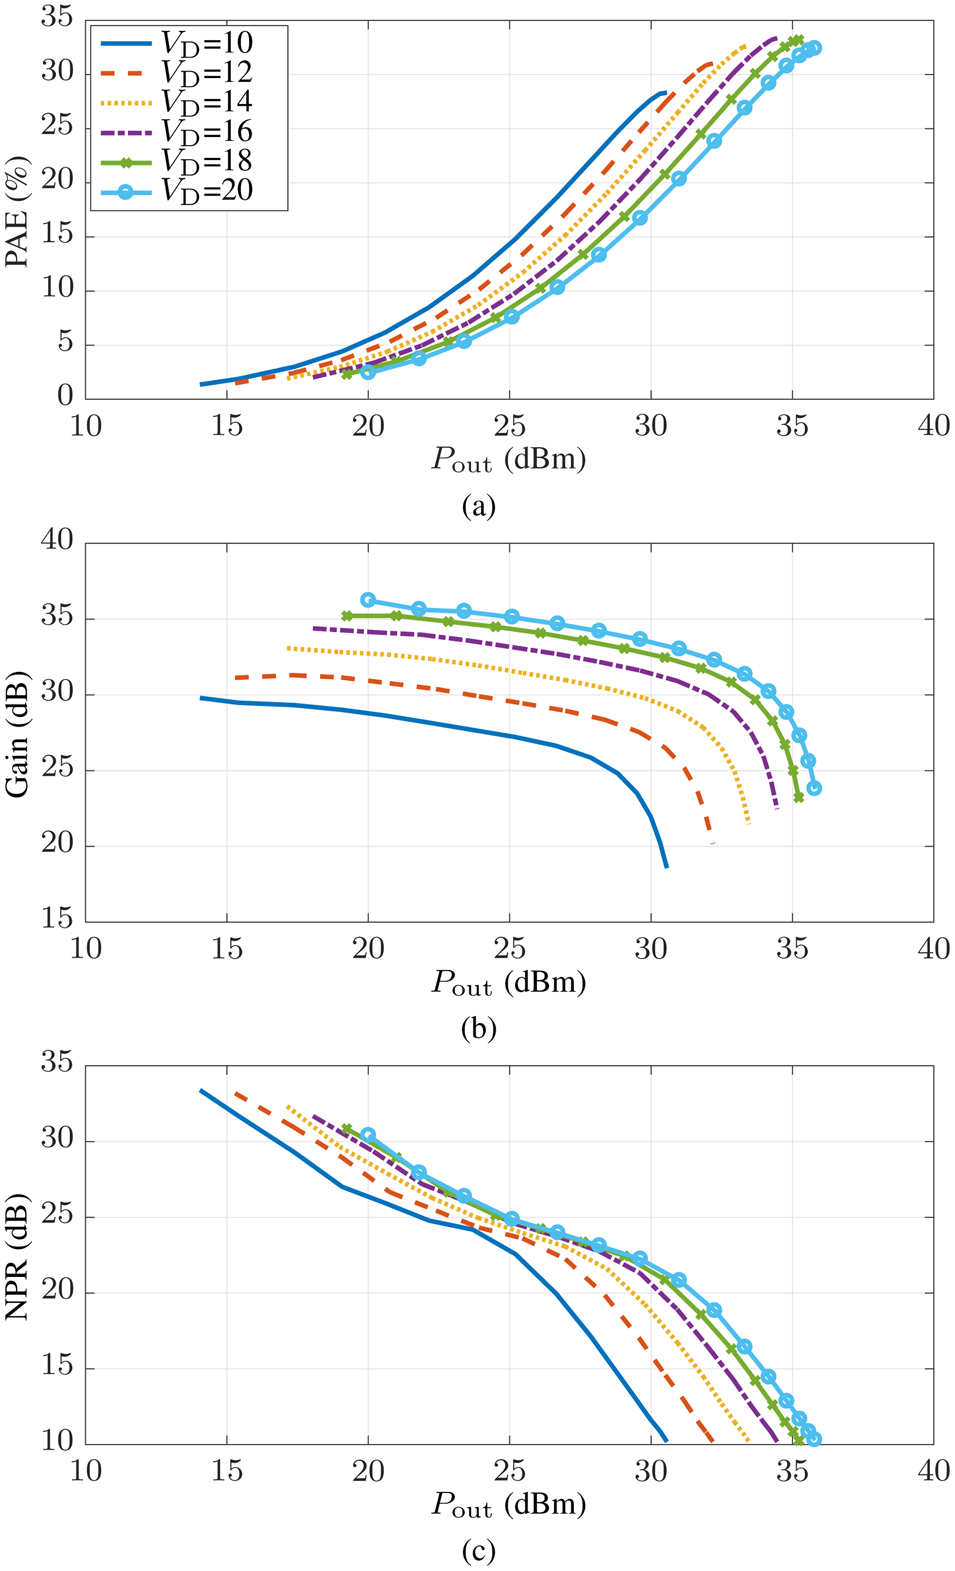
Characterization is first done for $V_{\rm D}$ = {10, 12, 14, 16, 18, 20} V seen in Fig. 3 with a 50 MHz noise-like signal at 19.8 GHz. As can be seen in Fig. 3(a) changing the drain voltage moves the peak efficiency point from $P_{\rm out}$
 = 36 dBm for a 20 V supply to $P_{\rm out}$
 = 30 dBm for a 10 V supply. These curves help estimate the maximum possible improvement from SM. For SM ranging from 10 to 20 V, the efficiency should be the envelope of these curves, showing a maximum achievable efficiency improvement of $\sim$
 10 pp. Also of interest is the effect of $V_{\rm D}$
 on NPR. Lower drain voltages move the 20 dB NPR point to lower output powers $P_{\rm out}$
 by 5 dB as seen in Fig. 3(c). The gain variation due to supply variation exceeds 5 dB. By effective shaping function $V_D\lpar V_{in}\rpar$
 design, a part of the gain variation can compensate the gain variation due to drive level.
Amplifier performance at 19.8 GHz with a 50 MHz noise-like signal for $V_{\rm D}$ = {10,12,14,16,18,20} V. Performance is shown over $P_{\rm out}$
 for (a) PAE, (b) gain, and (c) NPR.

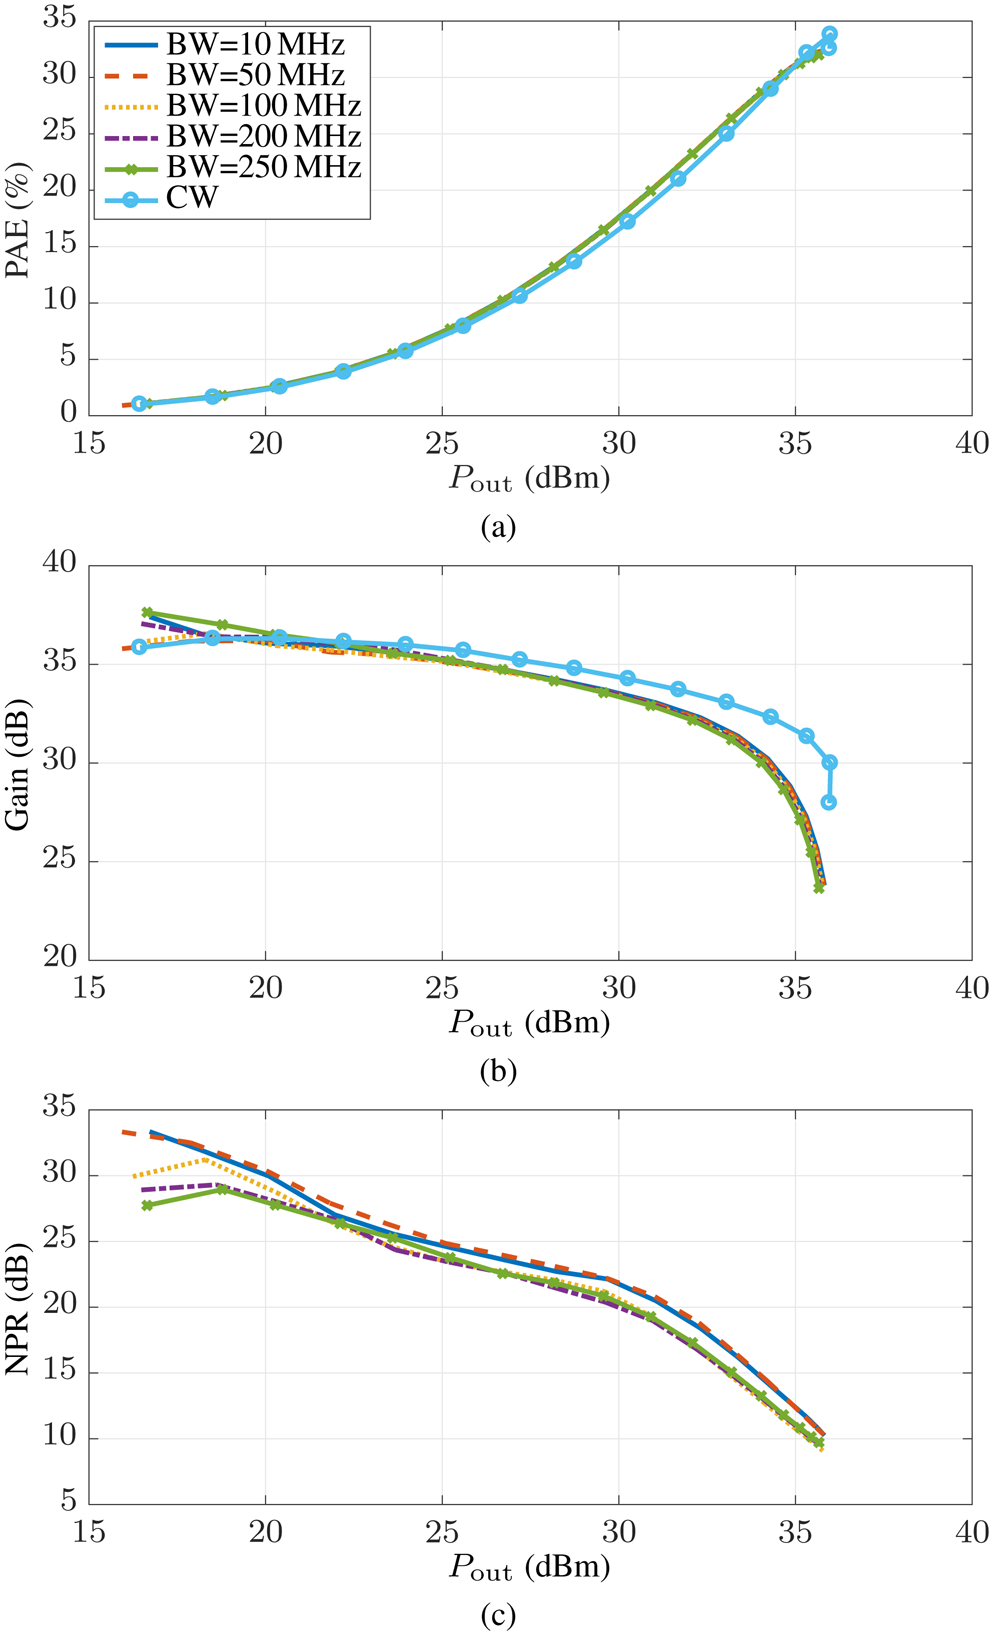
Further characterization is performed using noise-like signals for a range of bandwidths (BW)={10, 50, 100, 200, 250} MHz, and CW testing is also done for reference. Measurement results are shown in Fig. 4 for modulated signals keeping the same PAPR for all bandwidths. The PAE and gain of the amplifier are almost identical for the five signal bandwidths shown. Performance variation does not become obvious until linearity is investigated in Fig. 4(c). Here the biggest degradation in NPR can be seen between 50 and 100 MHz signal bandwidths. NPR reduces by 1–2 dB for $P_{\rm out}$ $\gt$
 25 dB. Based on this characterization, which shows consistent performance as signal bandwidth increases, we conclude that this amplifier is suitable for broadband signals.
Measured (a) PAE, (b) gain, and (c) NPR at 19.8 GHz with $V_{\rm D} = 20\, {\rm V}$ for noise-like signal bandwidths = {10,50,100,200,250} MHz as a function of $P_{\rm out}$
 .

Supply modulation test bench
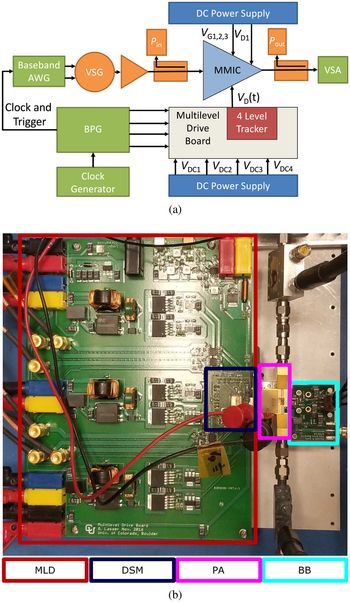
The supply modulated PA is characterized using the test bench shown in Fig. 5(a). A 2.5 GHz clock is generated for the bit pattern generator (BPG). The BPG then generates the clock and trigger signal for the baseband AWG allowing accurate alignment of the instrument up to 800 ps. The BPG simultaneously generates the control signals for the four-level DSM which are amplified and level shifted through the multi-level driver (MLD). The signal from the AWG is upconverted by a vector signal generator to 19.8 GHz and amplified by a driver. Average power measurements are taken before and after the PA and calibrated to the plane of reference of the DUT. Signals are received by a vector signal analyzer (VSA) which also provides the 10 MHz reference clock for the setup.
(a) Block diagram of test setup. Gate bias voltages 1, 2, and 3 are independently set. Drain supply voltage $V_{{\rm D1}}$ is static, while dynamic drain voltages $V_{{\rm D2}} = V_{{\rm D3}}$
 are provided by a four-level tracker controlled by a bit pattern generator (BPG) that commutates four external voltages, $V_{{\rm DC1}}\comma\; \, V_{{\rm DC2}}\comma\; \, V_{{\rm DC3}}$
 , and $V_{{\rm DC4}}$
 . (b) Photograph of test setup. Multi-level driver (MLD), discrete supply modulator (DSM), power amplifier (PA), and bias board (BB) are explicitly labeled.

The four-level DSM used to generate the discrete dynamic drain voltage is connected to the two final stages of the amplifier through spring-loaded pins. This interconnect is made as short as possible to minimize added inductance. A separate bias board (BB) provides the static voltages for $V_{\rm D1}$ , $V_{\rm G1}$
 , and $V_{\rm G2}$
 . The static bias connections are bonded directly to off-MMIC 100 pF singe-layer capacitors which are then bonded to the BB SMD capacitors for low-frequency bypassing. The RF and drain supply paths are aligned using methods described in [Reference Lasser, Duffy and Popović28]. The minimum pulse width of the DSM is limited to 8 ns by two chips on the MLD: the ADCMP601 logical comparator and the ISO721M digital isolator chip.
The amplifier is tested using the signals described in section “Amplifier characterization”. The signal generation bandwidth is approximately 1 GHz, however the signal receiver bandwidth (for IQ data) is limited by a maximum IF bandwidth of 140 MHz and a sampling rate of 170 MHz. Received data are time and phase aligned in post processing. Full-spectrum measurements are taken at every power level to check stability. A photograph of the power amplifier test fixtures is shown in Fig. 5(b).
Distortion mitigation in DSM
Based on the promising characterization results from the previous section, the amplifier was tested with higher bandwidth signals than previously reported (50 MHz). This testing is inhibited by two factors in the test setup. First, the multi-level drive board cannot support pulse widths lower than 8 ns. Further, the VSA cannot receive IQ data for a signal with greater than 140 MHz bandwidth. The pulse width limitation means that the DSM control signal needs to be modified from the ideal discretization of a continuous SM shaping function for higher bandwidth signals. To prevent signal clipping for short, high amplitude pulses, the drain supply pulses for these levels are stretched to comply with the maximum switching clock [Reference Cappello, Pednekar, Florian, Cripps, Popovic and Barton18, Reference Wolff, Heinrich and Bengtsson29, Reference Lasser, Duffy, Vance and Popović30].
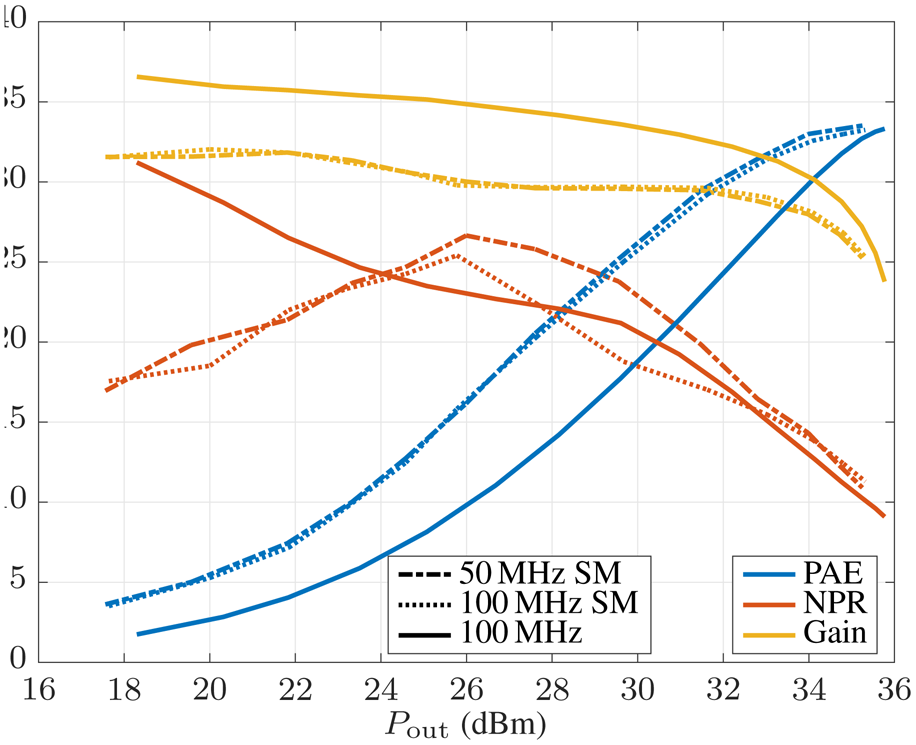
With these limitations in mind, testing is done with a 50 and 100 MHz signal with a SF based on four uniformly distributed drain voltages between 10 and 20 V for a flat gain response of 28 dB, as shown in [Reference Duffy, Lasser and Popović27]. The results of this testing are compared to those with a static supply in Fig. 6. PAE and gain are identical ($\lt$ 0.1 pp variation in PAE; $\lt$
 0.1 dB variation in gain) for the SM cases. Linearity on the other hand matches in backoff at $P_{\rm out}$
 $\lt$
 25 dBm, but deviates between 26 and 32 dBm. In backoff, the four-level DSM is behaving similarly to a static supply (10 V) with rare switching events. In the higher output power regions, the same is happening with the DSM behaving as a static supply (20 V) with rare switching events. The region in the middle corresponds to the area where the SM is fully utilized, which is also indicated by the largest increase in PAE over the static case. With an infinite switching speed this would not be problematic, however the test bench is limited to a 8 ns pulse width clock (as discussed in section “Supply modulation test bench”).
Measurement results for three cases: supply modulation of a 50 MHz signal, supply modulation of a 100 MHz signal, and a static supply for a 100 MHz signal. The 100 MHz supply modulation case shows a degradation in NPR while maintaining gain and PAE compared to the 50 MHz case.

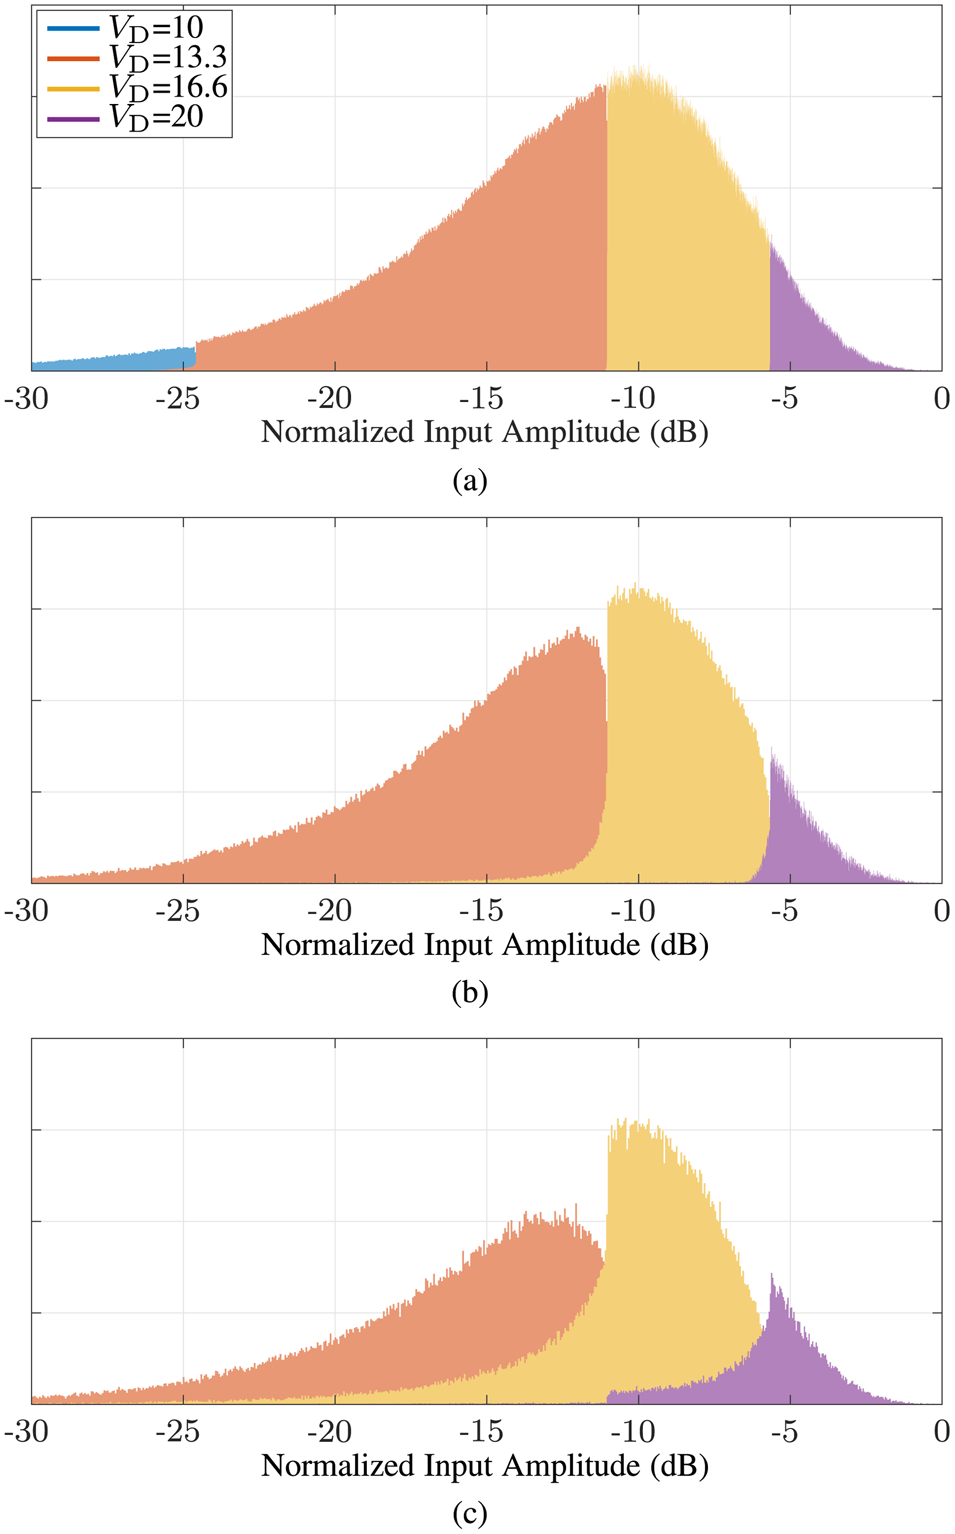
The non-ideal switching incidents can be visualized by plotting the estimated probability density function (PDF) of the signal amplitude separated for the discrete drain voltage levels $V_{\rm D}$ , as shown in Fig. 7. The PDF for a 10 MHz signal can be seen in Fig. 7(a), and approaches an ideal case; the four discrete voltage levels are clearly separated from one another and the overall shape resembles a continuous PDF. Increasing the signal bandwidth to 50 MHz, seen in Fig. 7(b), causes a deviation from this ideal case. At the low end, $V_{\rm D} = 10\, {\rm V}$
 is absorbed into the higher voltage levels. At the other transition points, the PDFs of the voltage levels overlap. This means that the higher voltage will be used for lower input power levels than intended, causing a gain expansion at those points. Moving to a 100 MHz signal bandwidth, the previously discussed issues become exacerbated, seen in Fig. 7(c). There is now a large amount of overlap between the voltage levels, to the point that the envelope of the PDFs no longer resembles the shape of the original signal PDF.
Probability density functions (PDF) of different $V_{\rm D}$ s for $P_{\rm in} = -2\, {\rm dBm}$
 , shown for a (a) 10 MHz, (b) 50 MHz, and (c) a 100 MHz signal. As the signal bandwidth increases, the minimum pulse width of the DSM (8 ns) results in the different $V_{\rm D}$
 values blending together.

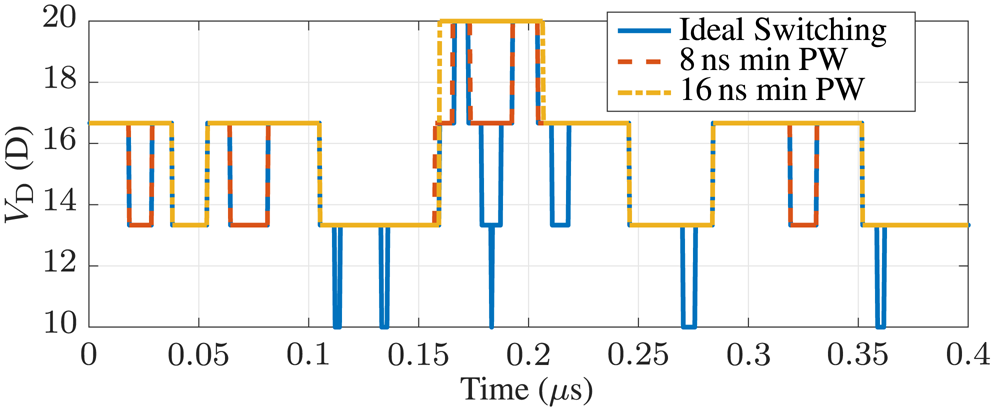
To further analyze the effect of insufficient switching speed, we test the PA using a 50 MHz signal. We compare an 8 ns minimum pulse width to a 16 ns minimum pulse width, which emulates the 8 ns case for a 100 MHz signal. This allows time-domain data capture with the bandwidth-limited VSA. The resulting drain voltages for the two cases compared with the ideal drain waveform can be seen in Fig. 8. We note that the increased pulse width signals cannot follow the short pulses to low supply levels. In the shown time frame, the lowest drain voltage level is only used by the ideal switching trajectory. The differences between the 8 and 16 ns minimum pulse width signals are most prominently seen in the transitions between levels two and three.
Time domain drain voltage waveforms for discrete supply modulation of a 50 MHz noise-like signal with an infinite switching speed, a minimum pulse width of 8 and 16 ns.

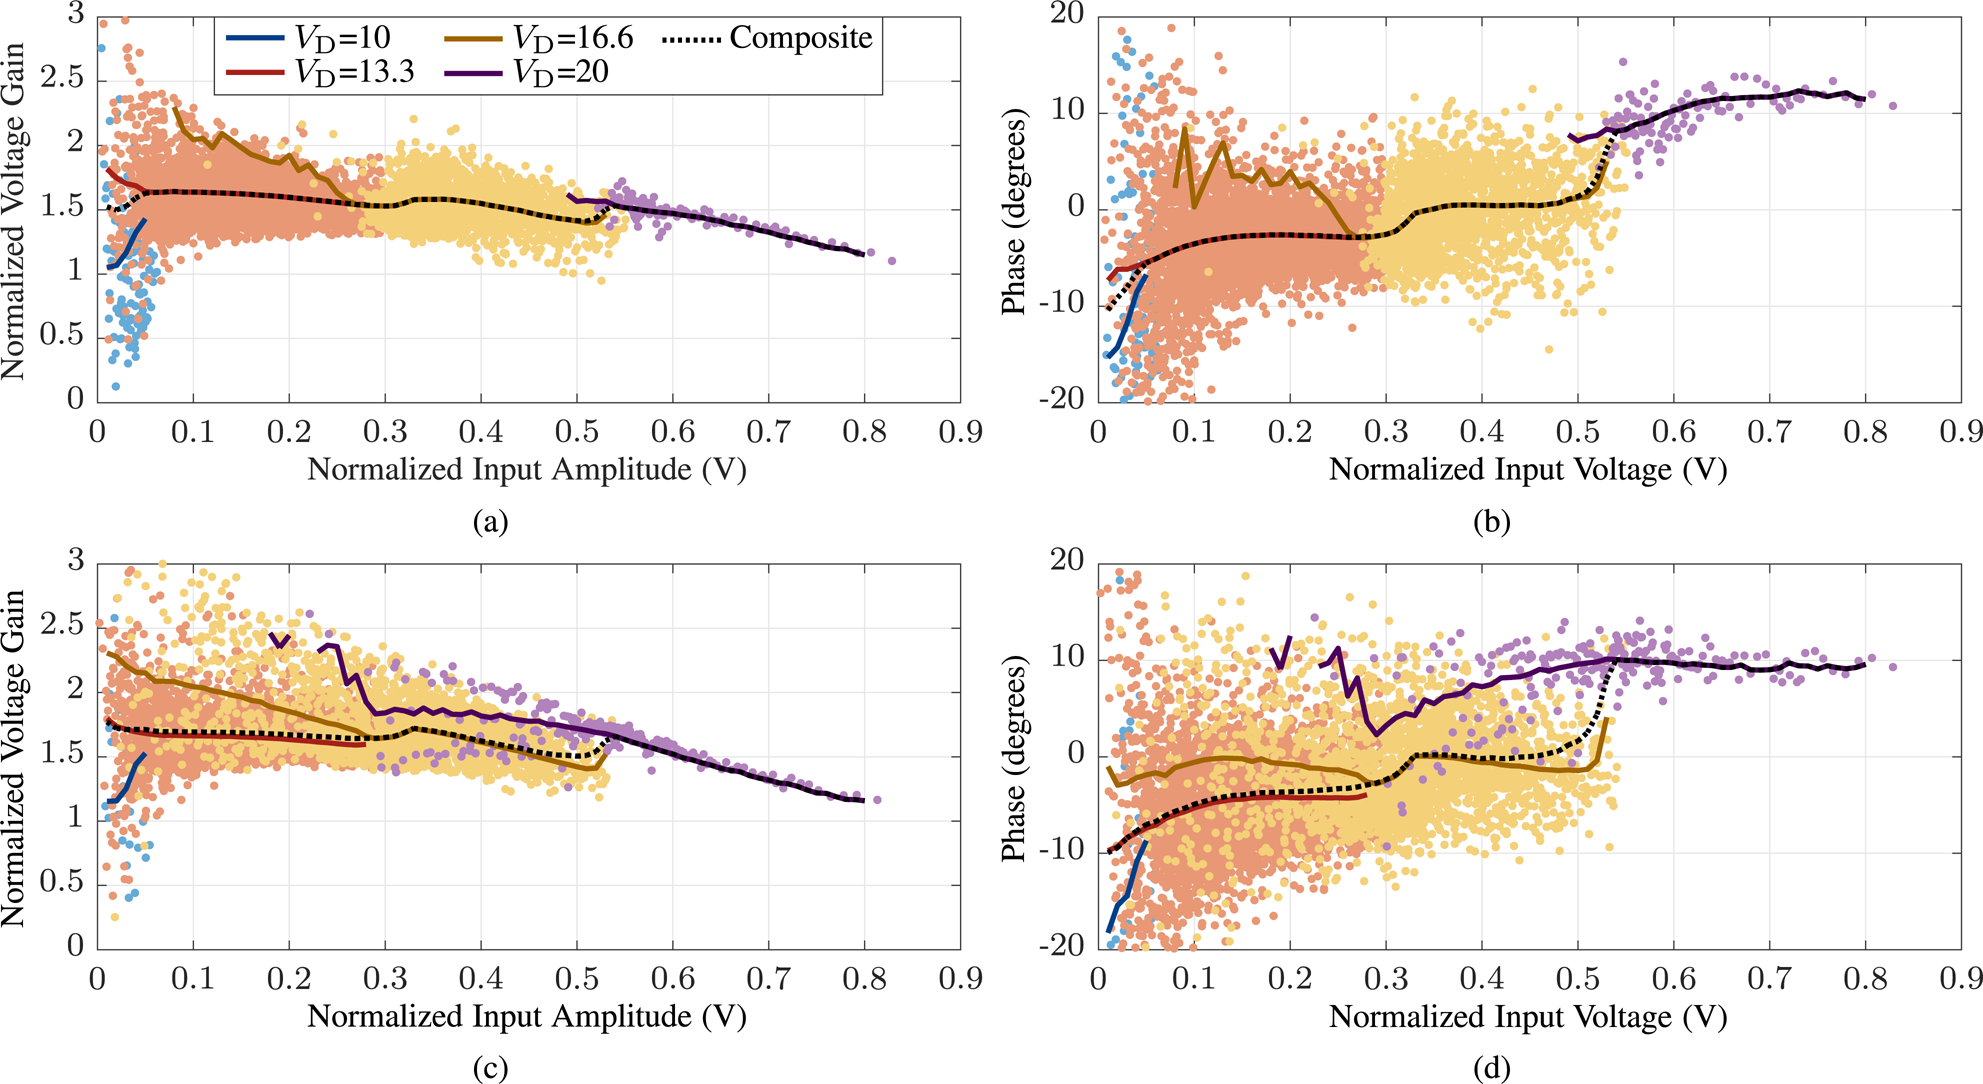
AM/AM and AM/PM results for those measurements are shown in Fig. 9 with Figs 9(a)–9(d) showing the 50 MHz results with a 8 ns minimum pulse width, and Figs 9(c) and 9(d) showing the 50 MHz results with a 16 ns minimum pulse width (emulating a 100 MHz signal). For the 8 ns case, a clear distinction can be seen between the four voltage levels. For this power level (30 dBm) and minimum pulse width, the lowest voltage level is effectively unused. The composite signal trendline follows the individual trendlines for each voltage respective on region. For the 16 ns case, there is a thickening of the AM/AM and AM/PM time domain data as compared to the 8 ns case. Additionally, the composite trendline deviates from the individual voltage trendlines, indicating that the imperfect switching transitions have a non-negligible impact on the AM/AM and AM/PM.
Measured supply modulation performance at 19.8 GHz for a minimum pulse width={8,16} ns showing (a,c) AM/AM and (b,d) AM/PM, respectively, for a 50 MHz NPR for $P_{\rm in} = -2\, {\rm dBm}$ and $P_{\rm out} = 30\, {\rm dBm}$
 . Points are colored based on which drain voltage level $V_{\rm D}$
 is active for a given input. The lower minimum pulse width case has a tighter spread of points and the individual levels are clearly separated. For the higher minimum pulse width case, the points are more spread out and the different levels blend together. The composite trendline also is not as well matched to the individual-level trendlines.

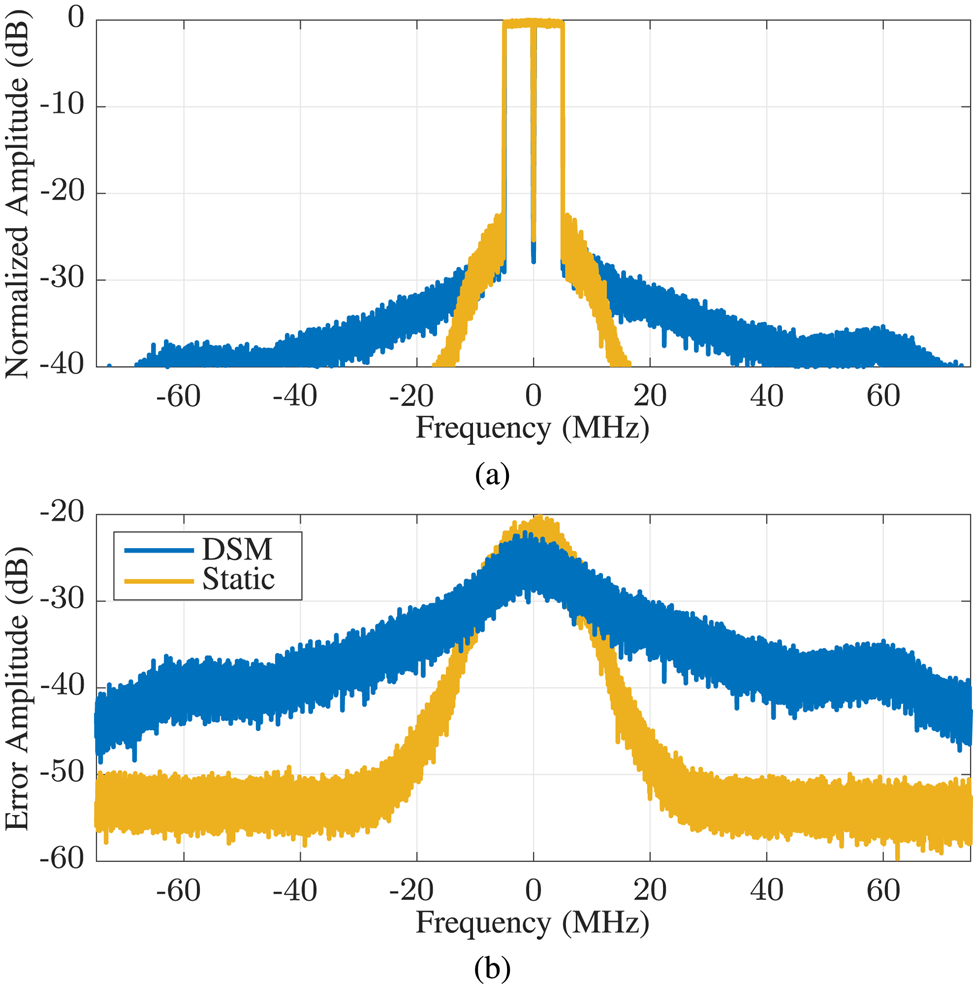
The effect from reduced DSM switching speed performance is important, but it is not the only cause of distortion. Measurements show the emulated 100 MHz signal still outperforms the actual 100 MHz signal in terms of NPR by up to 4 dB. One obvious contributor of distortion is switching noise introduced by the discrete nature of discrete SM. While shaping function design is meant to minimize the gain step between each voltage level, a rapid transition between those steps remains. A result of this is added broadband noise, as seen in Fig. 10 for a 10 MHz signal. The data are gathered and then the original signal is subtracted, leaving only the error signal. The static supply distortion drops down to the receiver noise-floor within a 40 MHz bandwidth. Conversely, in the SM case, the error signal is still 10 dB above the receiver noise-floor within the 150 MHz bandwidth. It can be seen that the in-band distortion is actually lower for the DSM case, meaning that an in-band metric like NPR will improve while an out-of-band metric like ACPR will degrade.
(a) Spectrum at $P_{\rm out} = 28\, {\rm dBm}$ with a 10 MHz NPR signal for a static supply and discrete supply modulation. (b) Spectrum with original NPR signal subtracted, showing more clearly the distortion.

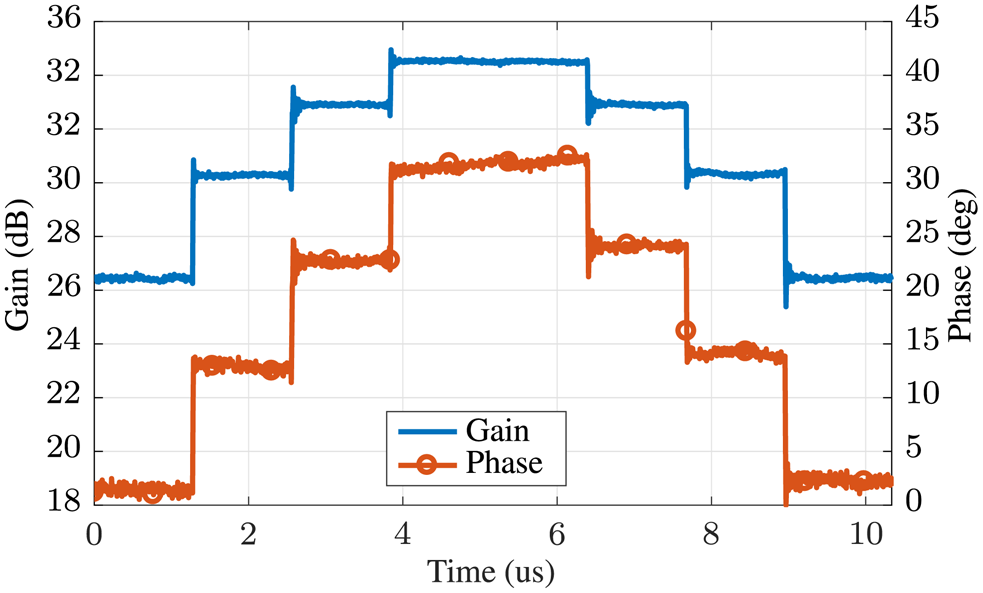
In the time domain, this distortion can be visualized as in Fig. 11 where the amplifier is driven with a CW signal and its drain is modulated. There are two things of note here. One is the jump in gain and phase during the transitions from one voltage level to another. While the shaping functions in this work are designed for flat gain, they do not account of phase. This can be observed in Fig. 9 where the amplitude is flat across input voltage while there is an approximately 10 deg variation in phase for each level transition. These discontinuities in performance can lead to broadband spectral content, as in the case of a square wave or step function. Also of note is the ripple at each voltage transition. Upward transitions tend to ripple upwards and then the damped oscillation moves to a steady state, downward transitions do the opposite. The ripple frequency introduced during each transition is approximately 150 MHz. This ripple has an impact on linearity, especially when the signals become more broadband and the transient time is comparable to the average pulse-width duration.
Gain and phase of the amplifier driven with a $\overline {P}_{\rm in} = -2\, {\rm dBm}$ CW signal at 19.8 GHz. The drain is modulated with a staircase using four equally spaced voltages between 10 and 20 V.

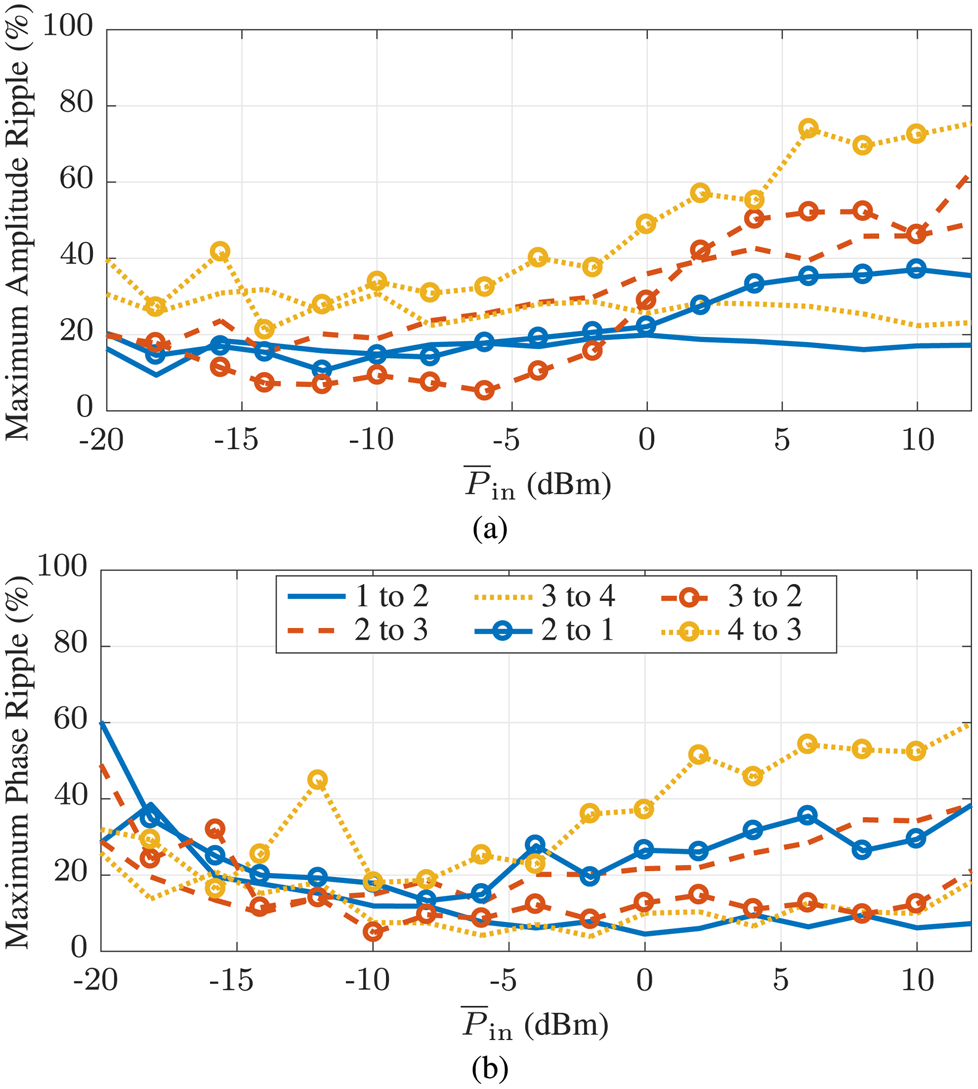
To quantify the amount of variation possible during switching transitions, we define the relative amplitude ripple between levels $m$ and $n$
 as:

where $\hat {V}_{{RF}m\comma \, n}$ is the peak RF amplitude deviation in the level $m$
 to $n$
 transition, and $\overline {V}_{{RF}i}$
 is the average RF amplitude at level $i$
 . This amplitude ripple and a similarly defined phase ripple can be seen in Fig. 12. The ripple during transitions, particularly during downward ones, is up to 70 % of the amplitude step. This means that during this transient the amplifier will behave as though it has almost half the desired gain level, which impacts linearity. More switching incidents will have a larger effect on dynamic amplifier performance.
Relative amplitude and phase ripple for each of the six switching transitions of Fig. 11 as a function of $\overline {P}_{\rm in}$ . (a) Voltage amplitude ripple, (b) phase ripple.

With these key distortion processes in mind, we develop strategies that will reduce distortion caused by DSM for more broadband signals:
• Moving the switching points away from the peak probability point of the signal as seen in Fig. 7. This could involve making changes in the SF used.
• Increasing the minimum voltage level for SM ($\gt$
 10 V). This will trade off efficiency improvement and linearity degradation, see Fig. 11.
• Reducing the number of DSM levels from 4 to 3 or 2. This should trade off a reduction in switching events (and thus the effects of transients on the signal output) with a reduced DSM resolution.

These strategies were investigated experimentally by increasing the minimum drain voltage of the DSM. Also examined is the use of the four-level DSM as a three- and a two-level DSM. This is done to further reduce switching events and thus the effect of transients on the amplifier output. We note that the supply modulator is more efficient for fewer levels, as unused levels will not draw driver current.
Dynamic amplifier testing
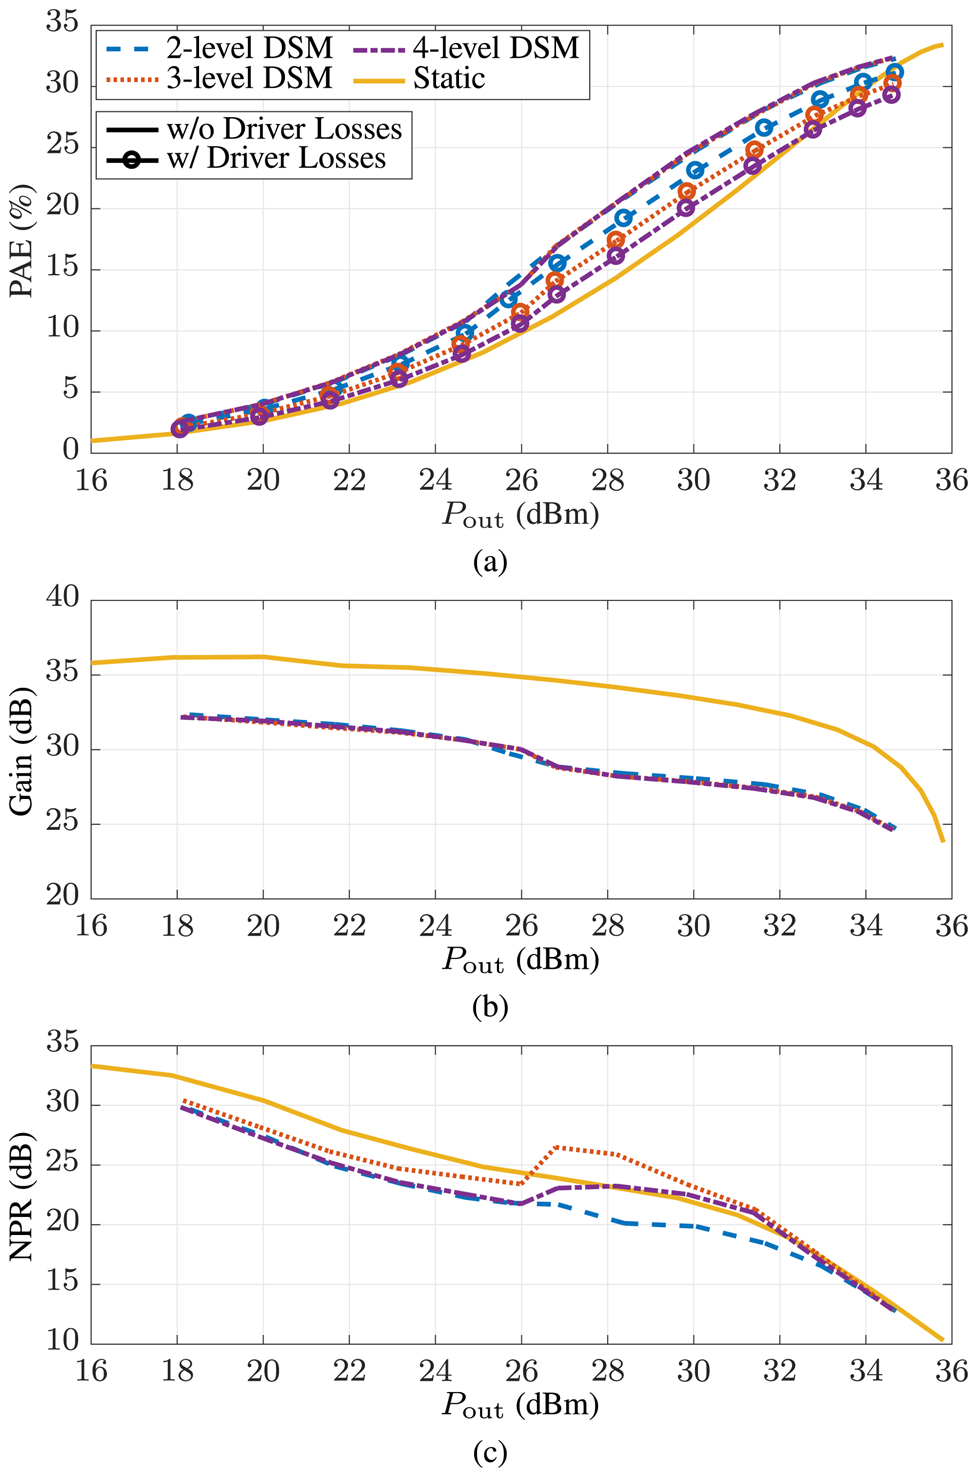
The 100 MHz signal case from Fig. 6 is reexamined making use of a higher minimum $V_{\rm D}$ of 16 V, because this level gives the best tradeoff between linearity and efficiency, improving the linearity over that of a static supply. Measurements are then conducted with the existing supply modulator operating as two-, three-, or four-level DSM, and all three cases result in the same gain and raw PAE, as shown in Fig. 13. With driver losses taken into account, the PAE degrades more as the number of levels increases. The two-level has the worst and the three-level the best linearity. Between $P_{\rm out} = 26$
 and 33 dBm, the three-level DSM outperforms static supply linearity, at points by 3 dB. This is coupled with a 6–7pp improvement in PAE without accounting for driver losses. Taking into account driver losses halves this benefit. If a specific NPR is desired, the amplifier could be driven to a higher (1–5 dB) $P_{\rm out}$
 level while maintaining the same linearity of a static supply further improving efficiency.
Amplifier performance for a 100 MHz NPR signal at 19.8 GHz for a static supply and DSM with two-, three-, and four-levels with a minimum drain voltage of 16 V and a maximum drain voltage of 20 V. Performance is shown over $P_{\rm out}$ for (a) PAE (efficiency measurements without driver losses are lines while those including driver losses have markers), (b) gain, and (c) NPR.

The degradation of the two-level case is to be expected as the two voltage levels have too much variation between them leading to an AM/AM and AM/PM that do not match a flat response. Three-level SM has fewer switching events and thus should result in fewer transients than a four-level DSM, doing a much better job of tracking the signal than the two-level case. This does not mean that a three-level tracker is always the optimal case, but works well for the switching speed limitation and transients of the investigated DSM. For an unlimited switching speed, more supply levels will result in better linearity, though this might happen at the cost of DSM efficiency and system complexity.
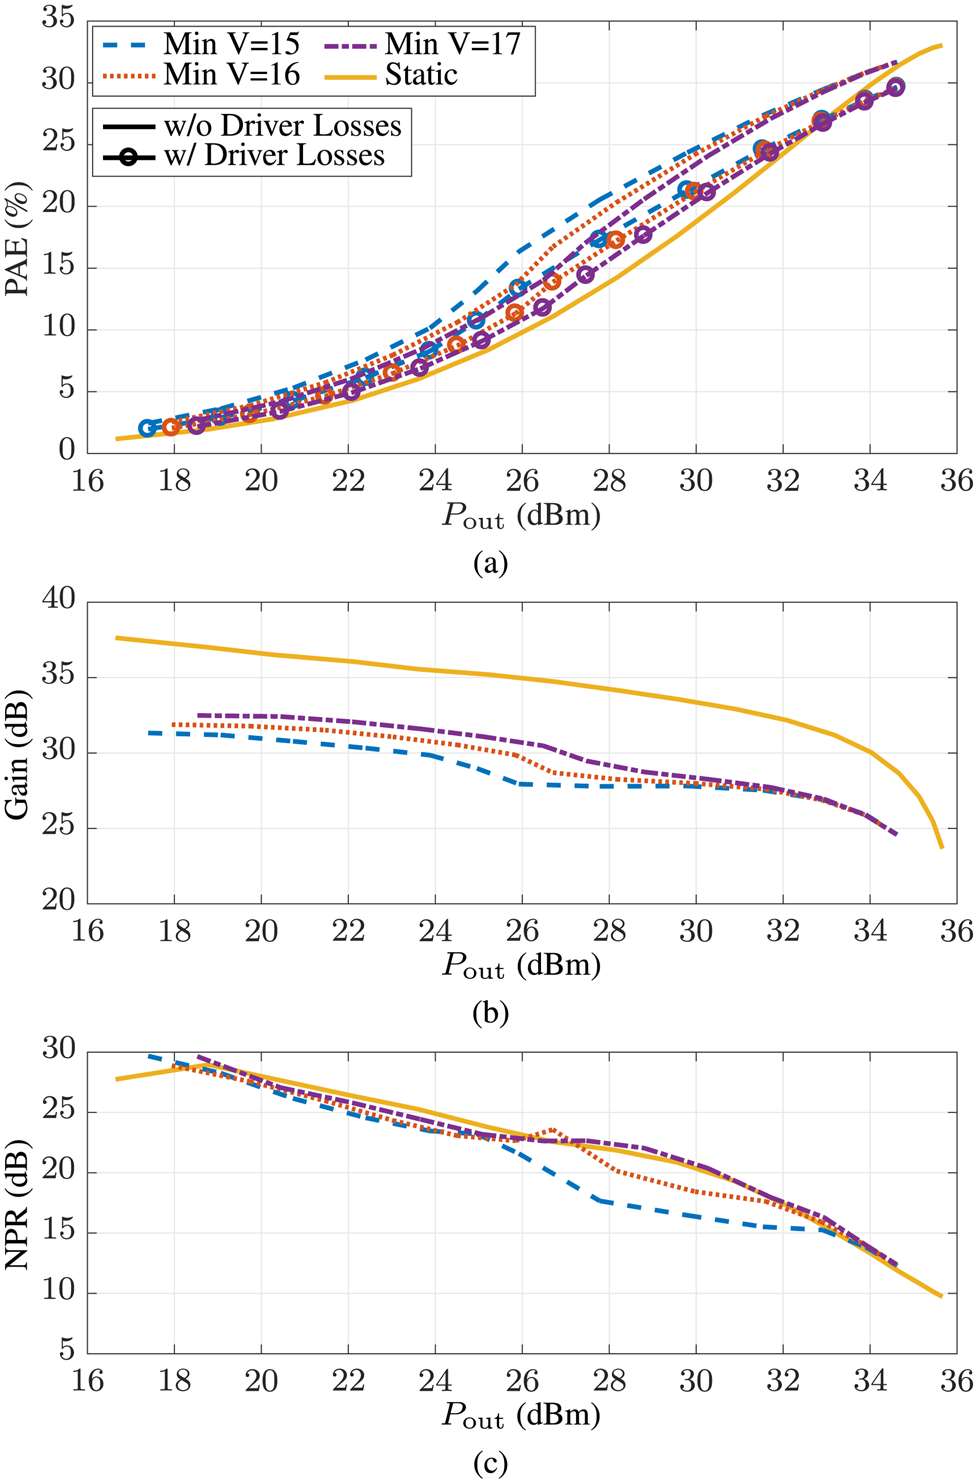
With this in mind, we moved to a 250 MHz signal. Because the three-level DSM performed best on the 100 MHz signal, it was also used with the 250 MHz signal. The minimum $V_{\rm D}$ is varied from 15 to 17 V. It can be seen from Fig. 14 that all three cases offer an improvement in PAE with the highest efficiency improvement corresponding to the lowest minimum $V_{\rm D}$
 . The back-off gain varies as a function of drain voltage with the highest drain voltage resulting in the highest average gain. Linearity also varies as a function of drain voltage, with the 15 V SF behaving the worst and the 17 V consistently exceeding or equalling the performance of the static supply for $P_{\rm out}$
 $\gt$
 26 dBm. For this case (17 V), the efficiency improves by 5pp not factoring in DSM driver losses and 2pp including driver losses.
Amplifier performance for a 250 MHz NPR signal at 19.8 GHz for a static supply and DSM a three-level DSM using a minimum voltage of 15,16, and 17 V for a maximum voltage of 20 V. Performance is shown over $P_{\rm out}$ for (a) PAE (efficiency measurements without driver losses are lines while those including driver losses have markers), (b) gain, and (c) NPR.

Conclusion
A three-stage K-band GaN MMIC amplifier is characterized at 19.8 GHz using a switching speed-limited DSM and noise-like signals with a bandwidth up to 250 MHz. Causes of distortion for high-bandwidth signals are examined and identified to be related to the insufficient switching speed of the DSM, prohibiting the gain linearization effect of the constant gain shaping function. Another cause are the switching events themselves, which induce amplitude and phase ripple. We find that by reducing the number of supply levels and raising the lowest supply level, a simultaneous improvement in efficiency and linearity is possible.
For a 100 MHz signal with a three-level DSM, the NPR is improved by as much as 3 dB when compared to static supply operation between $P_{\rm out} = 26\hbox {--}32\, {\rm dBm}$ . At the same time, average efficiency is improved from about 14 to 20 %, or by 6–7 pp without driver losses, and by 3–3.5 pp factoring in driver losses. For this DSM configuration, fewer switching levels mean a more efficient DSM. Applying the same methods to a 250 MHz bandwidth signal allows to match the NPR performance of the static PA while improving efficiency by 5pp without accounting driver losses.
We show that the shaping function design can be used with discrete SM to improve amplifier linearity without the need for DPD. This method is successfully applied for the in-band distortion metric NPR. Due to distortions introduced by switching transitions, an improvement in ACPR is not implicit from these results. To the best of the authors knowledge, this is the first demonstration of SM with an efficient GaN tracker for a 250 MHz bandwidth signal without a linearity penalty.
Acknowledgement
This work was funded by Lockheed Martin Corporation, award # 4102673517.02.
 Maxwell Robert Duffy received the B.S. degree in electrical engineering from The College of New Jersey, Ewing, NJ, USA, in 2015, and the M.S. and Ph.D. degrees in electrical engineering from the University of Colorado, Boulder, CO, USA, in 2017 and 2020 respectively. From 2013 to 2015, he was a Test Engineer with Linearizer Technology, Ewing, NJ, where he worked supporting the production of analog pre-distortion linearizers. His Ph.D. research focused on efficient power amplifier design and architectures. Since 2020 he has been at Northrop Grumman, Redondo Beach, CA, USA, working on millimeter-wave circuits and their applications.
 Gregor Lasser received the Dipl.-Ing. and the Dr. Techn. degrees in electrical engineering (both with distinction) from Vienna University of Technology, Vienna, Austria, in 2008 and 2014, respectively. Since 2016, he has served as the Vice Chair of the IEEE Denver joint AP-S/MTT section. Since 2017, he has been an Assistant Research Professor with the University of Colorado Boulder, CO, USA, where he is working on broadband supply-modulated power amplifiers and compact intelligent antenna systems. Dr. Lasser received the second position of the EEEfCOM Innovation Award in 2008 for the RFID testbed developed during his Diploma thesis and the Faculty Award of the Faculty of Electrical Engineering and Information Technology, Vienna University of Technology for the presentation of his Doctoral dissertation entitled “Passive RFID for Automotive Sensor Applications”. In 2017, he won the best paper award at IEEE WAMICON for his work on analog predistortion of GaN power amplifiers.
 Zoya Popović is a Distinguished Professor and the Lockheed Martin Endowed Chair of Electrical Engineering at the University of Colorado. She obtained her Dipl.Ing. degree at the University of Belgrade, Serbia, and her Ph.D. degree at Caltech. In 2001/03 and 2014, she was a Visiting Professor with the Technical University of Munich, Germany and ISAE in Toulouse, France, respectively. She holds a Chair of Excellence at Carlos III University in Madrid, Spain, in 2018/2019. She has graduated 58 Ph.D.s and currently advises 14 doctoral students. Her research interests are in high-efficiency power amplifiers and transmitters, microwave and millimeter-wave high-performance circuits for communications and radar, medical applications of microwaves, and wireless powering. She is a Fellow of the IEEE and the recipient of two IEEE MTT Microwave Prizes for best journal papers, the White House NSF Presidential Faculty Fellow award, the URSI Issac Koga Gold Medal, the ASEE/HP Terman Medal, and the German Humboldt Research Award. She was elected as a foreign member of the Serbian Academy of Sciences and Arts in 2006. She was named IEEE MTT Distinguished Educator in 2013 and the University of Colorado Distinguished Research Lecturer in 2015.