Introduction
Drought is one of the environmental factors that can cause a great reduction in rice yield. Different types of drought can be classified in relation to rainfall and the growing environment, and the stage of crop development (Kamoshita et al., Reference Kamoshita, Babu, Boopathi and Fukai2008). The main effect of drought is dry matter accumulation (Kumar et al., Reference Kumar, Sarawgi, Ramos, Amarante, Ismail and Wade2006; Beheshti and Behboodi fard, Reference Beheshti and Behboodi fard2010) and/or severe yield reduction (Kumar et al., Reference Kumar, Bernier, Verulkar, Lafitte and Atlin2008). Drought during the vegetative stage of plant development may reduce yields less than drought during the terminal stage because of the opportunity for plant growth recovery later in the growing season. However, early drought can inhibit vegetative development and reduce tiller number (Bernier et al., Reference Bernier, Atlin, Serraj, Kumar and Spaner2008), leaf area (Farooq et al., Reference Farooq, Kobayashi, Ito, Wahid and Serraj2010) and dry matter (Kumar et al., Reference Kumar, Sarawgi, Ramos, Amarante, Ismail and Wade2006). Late heading and flowering, followed by a short grain-filling period, can be associated with higher yields when drought stress is experienced early in the growing season, during the vegetative phase (Van Ginkel et al., Reference Van Ginkel, Calhoun, Gebeyehu, Miranda, Tian-you, Pargas Lara, Trethowan, Sayre, Crossa and Rajaram1998; Yang and Zhang, Reference Yang and Zhang2006; Cattivelli et al., Reference Cattivelli, Rizza, Badeck, Mazzucotelli, Mastrangelo, Francia, Marè, Tondelli and Stanca2008).
Upland rice can adapt very well to tropical and subtropical areas with aerobic soils and undulating land. However, all upland rice fields are subjected to mild drought stress conditions, with more severe stress developing between major rainfall events, particularly under conditions of high evapotranspiration (Kamoshita et al., Reference Kamoshita, Babu, Boopathi and Fukai2008). In Asia, around 13 million ha of the total area planted to rice are occupied by upland rice cultivars (Acuña et al., Reference Acuña, Lafitte and Wade2008). The chronic low yield of upland rice cultivars is largely due to the limitations of infertile upland soils and/or abiotic stresses, and to the low harvest index of traditional cultivars (George et al., Reference George, Magbanua, Roder, Van Keer, Trebuil and Reoma2001; Saito et al., Reference Saito, Linquist, Atlin, Phanthaboon, Shiraiwa and Horie2006). However, Srihanoo and Sanitchon (Reference Srihanoo and Sanitchon2011) reportedly showed that the yields of indigenous upland rice germplasm in Thailand can range from about 700 to more than 3400 kg/ha, suggesting that some varieties are well adaptive to upland conditions.
The lack of sources of drought tolerance for upland rice has been a major obstacle in upland rice breeding programmes. The advantage of existing genetic resources is that they can assist in the development of drought-resistant cultivars for upland rice field systems. Traditional rice breeding can be slow due to a lack of understanding of the traits and mechanisms that confer adaptation characteristics (Bernier et al., Reference Bernier, Serraj, Kumar, Venuprasad, Impa, Gowda, Oane, Spaner and Atlin2009). Leaf rolling (LR) and leaf death (LD) are plant traits during the vegetative stage, which have a high heritability (0.8) but a low association with yield. Leaf water potential (LWP) is a popular trait for use in drought screening programmes (Jongdee et al., Reference Jongdee, Fukai and Cooper2002; Pantuwan et al., Reference Pantuwan, Fukai, Cooper, Rajatasereekul and O'Toole2002a, Reference Pantuwan, Fukai, Cooper, Rajatasereekul and O'Tooleb); however, percentage recovery is one of the most important traits related to grain yield (GY) in the evaluation of the impact of early wet season drought. The objectives of this study were (1) to identify different plant traits and their association with early drought tolerance in upland rice varieties, and (2) to identify potential germplasm sources for early drought tolerance.
Materials and methods
Experimental sites, design and genotypes
The experiment was conducted at Khon Kean University under greenhouse conditions. A total of sixty indigenous upland rice varieties supplied by the Research Center for Plant Breeding for Sustainable Agriculture at Khon Kean University were evaluated in rainy seasons (June –December) in 2011 and 2012. The experimental design was a factorial experiment with a randomized complete block (RCB) design with three replications; factor A comprised 2 water regimes and factor B had 60 varieties of upland rice.
Soil and water condition treatments
Soil samples were collected from three randomly selected points, with the sampling being done by an auger at a depth of 0–15 and 15–30 cm from upland rice fields in Ban Wang War village, Banhad district, Khon Kaen province. Soil texture in this locality was loamy sand, with pH 6.3 and 0.28% organic matter. The soil samples were dried at 105°C for 72 h followed by weighing to calculate soil density, based on the method of the International Atomic Energy Agency (IAEA) (2008) and Black (Reference Black1965). Soil density was 1.32 g/cm3. The second part of the soil samples was air-dried separately for different soil sampling depths. Then, individual pots (30 cm in diameter and 30 cm in depth) were filled using the soil from different sampling levels. Individual pots had 25 cm depth of soil and 17.5 kg/pot (according to the soil density). Seeds were sown at a rate of four to five seeds/pot and later thinned to two plants/pot at 14 d after sowing (DAS).
Water management in this experiment was based on soil evaporation and plant water use, following the method of Doorenbos and Pruitt (Reference Doorenbos, Pruitt, Doorenbos and Pruitt1992). In the control (non-stress) condition, soil water was maintained at field capacity before sowing by calculating crop evapotranspiration (ETcrop) and then adding sufficient water to maintain the field capacity throughout the growing period; ETcrop = ET0× K c, where ETcrop is the crop evapotranspiration (mm/d); K c is the crop coefficient (dimensionless); ET0 is the reference crop evapotranspiration (mm/d). Reference crop evapotranspiration (ET0) was calculated from E 0× K p, where E 0 is the water evaporation at the KKU field and K p = 0.7 (constant). The crop coefficient (K c) of rice is different with the plant growth stage, with months 1 and 2 having 1.1–1.5 mm/d, and months 3 and 4 having 1.1–1.3 mm/d and 0.95–1.05 mm/d in the last component of the growth period (Doorenbos and Kassam, Reference Doorenbos, Kassam, Doorenbos and Kassam1986).
In stress conditions, the water was drained out at 28 DAS and then restored at 56 DAS, with soil moisture being maintained in the same non-stress condition as before draining.
Data collection
LR was scored following the method proposed by De Datta et al. (Reference De Datta, Malabuyoc and Aragon1988), using a scale range from 1 to 5, with 1 = unrolled, turgid, 2 = leaf rim starts to roll, 3 = leaf has a shape of V, 4 = rolled leaf rim covers part of the leaf blade and 5 = leaf is rolled like an onion leaf. LR was measured at 44 (LR1) and 49 (LR2) DAS in 2011 and at 41 (LR1) and 45 (LR2) DAS in 2012.
LD was scored following the method proposed by De Datta et al. (Reference De Datta, Malabuyoc and Aragon1988), using a scale range from 0 to 10, based on the percentage of the estimated total leaf area that was dead, with 0 = no symptom, 1 = dead leaf tip area less than 10%, 2 = 25% of dead leaf area, 3 = 50% of dead leaf area, 4 = more than 50% of dead leaf area and 25% of plant, 5 = 50% of plant was dead, 6 = more than 50% of plant was dead but not exceeding 70% of plant, 7 = 70% of plant was dead, 8 = more than 70% of plant was dead and 9 = all leaves were dead. The LDS was measured in the third expanded leaf at 45 DAS in 2011 and at 50 DAS in 2012.
Recovery (RE) was scored following the method proposed by IRRI (1996), using the following score range: 1 = 90–100% RE; 3 = 70–89% RE; 5 = 40–69% RE; 7 = 20–39% RE; 9 = 0–19% RE. The RE rating score was recorded at 10 d after re-watering (66 DAS) in both 2011 and 2012.
Mid-day LWP (10.00–14.00 h) was determined at 50 DAS in 2011 and at 47 DAS in 2012. For each measurement, one last fully expanded leaf was randomly sampled from each pot. To prevent transpiration, a long-narrow plastic bag (2 cm wide and 20 cm long) was placed over the leaf tip and pulled down to cover the whole leaf blade. Then, the leaf was cut with scissors just above the leaf collar. The leaf sample was immediately taken to measure the rate of LWP using a pressure chamber (Model 3005 Plant Water Status Console; Soilmoisture Equipment, USA).
Drought tolerance index (DTI) was determined after harvesting following the method of Nautiyal et al. (Reference Nautiyal, Nageswara Rao and Joshi2002). This method was used to determine the DTI of groundnut (Arachis hypogaea L.), with a slight modification made to take into account the GY, root and shoot dry matter in rice. Dry matter, root dry matter and GY in both experiments were used for estimating the DTI as follows: DTI = stress treatment/non-stress treatment.
Plant stem dry matter was separated from the panicles and oven-dried at 80°C for 72 h; root dry matter was filtered using a sieve to separate out the sand. It was then oven-dried at 80°C for 72 h. GY was based on grain weight at 14% moisture after air-drying.
Data analysis
Yield and yield components were analysed according to the RCB design (Gomez and Gomez, Reference Gomez and Gomez1984), and means comparisons were made by Duncan's multiple range test. The combined analysis of the 2-year data followed Barlett's test (Gomez and Gomez, Reference Gomez and Gomez1984). Correlation and linear regression analyses were conducted for the test traits.
Results
Genetic variation as revealed by analysis of variance
The analysis of variance under early drought conditions in a greenhouse in both 2011 and 2012 showed a high level of variation in criteria being reflected by the distribution of the traits representing the different water conditions. Overall, eight traits [except root dry weight (RDW)] showed a significant variation in 2011, with significant differences also being observed under the stress and control conditions. In 2012, the eight criteria traits (except LR1) also exhibited a significant variation (Supplementary Table S1, available online). All the criteria traits in both experiments (except RDW in 2011 and LR1 in 2012) showed significant interactions between genotype and water status. The results indicated that the criteria traits were significantly influenced by genotype, water condition and the interaction of these two factors.
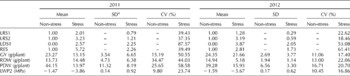
Phenotypic variation among the genotypes for each trait was confirmed by basic statistical parameters including means, standard deviation and coefficient of variation (Table 1). The coefficient of variation under non-stress conditions ranged from 9.80% to 34.47% in 2011 and from 10.45% to 16.71% in 2012. However, under water stress conditions, it ranged from 23.74% to 87.57% and 16.86% to 61.41% in 2011 and 2012, respectively. When compared with non-stress conditions, the mean values of the leaf rolling score (LRS), LDS and recovery score (RES) were increased under stress conditions. In contrast, the LWP, RDW, plant dry weight (PDW) and GY declined in response to the stress conditions.
Means, standard deviations (SD) and coefficients of variation (CV) for the tested traits under non-stress and stress conditions in the wet seasons of 2011 and 2012

LRS1 and LRS2, leaf rolling score at the first and second measurements; LDS, leaf death score; RES, recovery score; GY, grain yield; RDW, root dry weight; PDW, plant dry weight; LWP2, leaf water potential at the second measurement.
a SD and CV (%) were not determined under non-stress conditions.
Genetic correlations among the tested traits
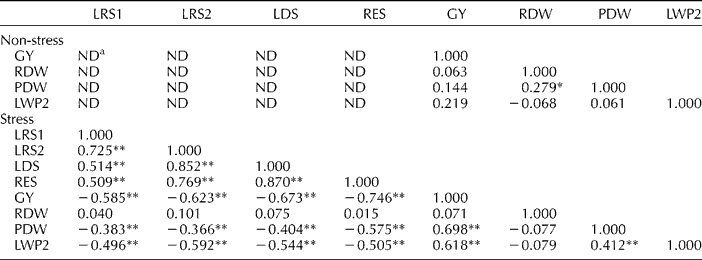
Pearson's correlations among the eight criteria traits were calculated (Table 2). A range of 1–26 correlation pairs reached significance levels under the non-stress and stress conditions, respectively. Leaf-related traits, such as leaf rolling score 2 (LRS2) and LDS, LRS and RES, and LDS and RES, had positive correlations of r= 0.852, r= 0.760 and r= 0.870 under stress conditions, respectively. Under stress conditions, GY was negatively correlated with LRS2, LDS and RES (r= − 0.623, − 0.673 and r= − 0.746, respectively). In contrast, GY was positively correlated with PDW and LWP2 (r= 0.698 and r= 0.618, respectively). The results showed relatively high correlations between the criteria traits under the stress conditions. Surprisingly, RDW was not correlated with other criteria under stress conditions, but was correlated with PDW under non-stress conditions.
Correlation coefficients between the traits under early drought conditions using the combined data for two years (2011 and 2012)

LRS1 and LRS2, leaf rolling score at the first and second measurements; LDS, leaf death score; RES, recovery score; GY, grain yield; RDW, root dry weight; PDW, plant dry weight; LWP2, leaf water potential at the second measurement.
Values were significant at * P< 0.05 and ** P< 0.01.
a ND indicates that LRS1, LRS2, LDS and RES were not determined under non-stress conditions.
Drought tolerance indices
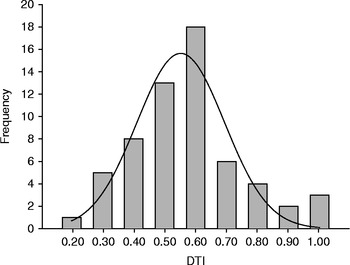
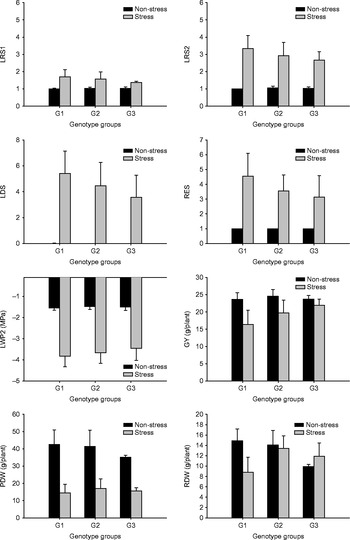
The DTI for three traits (RDW, PDW and GY) was calculated in all the tested upland rice genotypes. Among these three traits, the DTI for PDW had the lowest value of 0.32, while the DTI for RDW had the highest value of 1.17 in 2011. However, in 2012, the DTI for RDW had the lowest value of 0.35, while the DTI for GY had the highest value of 0.90. The DTI values ranged from 0.29 to 1.06, reflecting different levels of drought tolerance among the genotypes (Fig. 1). Based on the DTI values, the tested upland rice genotypes were classified into three groups. A total of 45 accessions showed drought susceptibility, with DTI values being lower than 0.70 (G1); ten accessions showed moderate drought tolerance, with DTI values between 0.70 and 0.90 (G2); and five accessions showed drought tolerance, with DTI values being greater than 0.90 (G3) (Supplementary Table S2, available online). The mean values and standard deviations for each trait in the three groups are shown in Fig. 2.
Frequency distribution of the drought tolerance index (DTI) for drought tolerance in the tested upland rice germplasm.

Mean values and standard deviations for the eight traits in three rice groups under non-stress and stress conditions. Based on the drought tolerance index, the tested rice accessions were classified into three groups. G1, G2 and G3 represent susceptible, moderate tolerance and tolerance of drought conditions, respectively. Bars represent the standard deviation of means in the three groups (N= 45, 10 and 5 for G1, G2 and G3, respectively). LRS1 and LRS2, leaf rolling score at the first and second measurements; LDS, leaf death score; RES, recovery score; LWP2, leaf water potential at the second measurement; GY, grain yield; PDW, plant dry weight; RDW, root dry weight.

Under non-stress conditions, the mean values of LRS1, LRS2, LDS, RES and LWP2 were similar in all the groups. In contrast, under stress conditions, the mean values of LRS1, LRS2, LDS, RES and LWP2 were lowest in G3, moderate in G2 and highest in G1. The mean values of LRS1, LRS2, LDS, RES and LWP2 showed substantial increases from G3 to G2 and G1 (Fig. 2).
The mean values of GY, RDW and PDW were lowest in G3, moderate in G2 and highest in G1 under non-stress conditions, while under stress conditions, the mean values of GY and PDW tended to decrease from G3 to G2 and G1. Surprisingly, the mean value of RDW in G3 increased under stress conditions when compared with non-stress conditions (Fig. 2). The results indicated that classifying the upland rice accessions into three groups based on DTI values could be an effective means for the identification of drought tolerance among the accessions.
Relationship of DTI and pre-harvesting traits under the conditions of drought stress
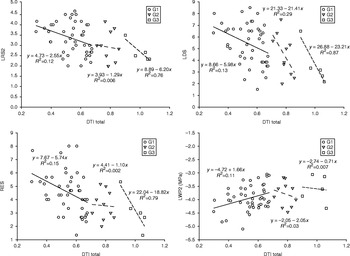
Correlation analysis revealed a significant difference between the criteria traits under both the non-stress and stress conditions (Table 1). Based on harvesting time, the criteria traits can be divided into two stages: pre- and post-harvest. Pre-harvest comprised LRS1, LRS2, LDS, RES and LWP2; post-harvest comprised PDW, RDW and GY. The post-harvested traits were used for the DTI to classify the upland rice accessions in relation to drought tolerance. The relationship was defined within the context of the three groups based on the DTI values. LRS1, LRS2, LDS and RES had a close relationship with DTI (R 2= 0.76, 0.87 and 0.79, respectively) in G3 (tolerant), while the relationship decreased substantially from G3 to G2 and then to G1 (Fig. 3). In contrast, LWP2 in G3 had the R2 value lower than that in G2 and G1, indicating that the LWP2 value in G3 was more stable than that in the other groups. The results indicated that LRS1, LRS2, LDS, RES and LWP2 were related to post-harvest parameters.
Relationship between the drought tolerance index (DTI) and leaf rolling score at the second measurement (LRS2), leaf death score (LDS), recovery score (RES) and leaf water potential at the second measurement (LWP2) in the three groups of genotypes (G1, G2 and G3) under stress conditions for the two years combined.

Discussion
Genetic variation for drought tolerance in upland rice genotypes, and the importance of related traits in drought tolerance evaluation
The development of new rice genotypes tolerant to drought stress will increase and stabilize rice yield, and could potentially save water (Zhou et al., Reference Zhou, Tian, Zhu, Fu, Wang and Sun2006). The investigation among primitive cultivars, landraces, wild species and world collections for drought tolerance is the most common approach adopted for identifying potential donors for breeding programmes (Kumar et al., Reference Kumar, Verulkar, Dixit, Chauhan, Bernier, Venuprasad, Zhao and Shrivastava2009; Thomson et al., Reference Thomson, Ismail, McCouch, Mackill, Pareek, Sopory and Bohnert2010). According to the centres of origin, South and Southeast Asia are the areas of origin of rice (Oryza sativa), where 90% of world's rice is produced and consumed (Hibberd et al., Reference Hibberd, Sheehy and Langdale2008). In Asia, around 13 million ha of rice-planted area are occupied by upland rice cultivars (Acuña et al., Reference Acuña, Lafitte and Wade2008). The ancestors of this crop are semi-aquatic, and they are not yet fully adapted to the aerobic systems, because of its limited tolerance to water deficits.
In this study, 60 upland rice varieties from Thailand were used to identify the traits related to early drought tolerance in upland rice varieties, and to identify the potential sources of germplasm for early drought tolerance. The analysis of variance of data related to early drought conditions in a greenhouse environment in 2011 and 2012 showed high levels of criteria variation reflected by drought. All criteria traits in both experiments, with the exception of RDW in 2011 and LR1 in 2012, showed significant interactions between genotype and water status. The results showed that the criteria traits were significantly influenced by genotype, water conditions and their interaction (Supplementary Table S1, available online), and indicated that drought is complicated and difficult in terms of field management and variation in plant phenology (Manickavelu et al., Reference Manickavelu, Nadarajan, Ganesh, Gnanamalar and Babu2006).
The level of drought influenced the root character, with severe conditions leading to increased RDW as a defence mechanism (Almekinders and De Boef, Reference Almekinders and De Boef2000; Kanbar et al., Reference Kanbar, Toorchi and Shashidhar2009). In this study, the experiment conducted in 2011 was associated with greater severity of water stress than that conducted in 2012, with this being reflected in a higher level of final LDS (~6.5) and lower level of genotype recovery (~6) (Supplementary Fig. S1, available online). The Mean RDW of rice germplasm increased in response to drought (Table 1; Supplementary Fig. S1, available online); however, the results of analysis of variance were non-significant (Table 1) due to the measurement of this trait being made after re-watering and of trait plasticity under re-watering.
Some of the plant responses that have been recorded in plants in response to drought have included shortened life cycles, proliferations of roots for improved water uptake (Yue et al., Reference Yue, Xue, Xiong, Yu, Luo, Cui, Jin, Xing and Zhang2006), reduced water loss (Blum, Reference Blum and Blum2011), water use efficiency (Zhang et al., Reference Zhang, Tang, Peng, Xing, Qin, Laza and Punzalan2012) and drought tolerance via osmotic adjustment and desiccation tolerance (Yue et al., Reference Yue, Xue, Xiong, Yu, Luo, Cui, Jin, Xing and Zhang2006). In the present study, traits related to early drought tolerance were analysed. The results showed that the leaf-related traits LRS, LDS, RES and LWP were associated with GY (r= − 0.623, − 0.673, − 0.746 and 0.618, respectively). LR was related to LD (r= 0.69, P< 0.01) but dependent on the period of drought, with long and severe stress affecting both traits (Kamoshita et al., Reference Kamoshita, Babu, Boopathi and Fukai2008; Gana, Reference Gana2011; Bunnag and Pongthai, Reference Bunnag and Pongthai2013). Rice plants reduce water loss by rolling their leaves under the conditions of low soil moisture (Blum, Reference Blum and Blum2011). The rolling of the leaves is associated with stomata closure to reduce water loss; it also reduces gas exchange between the plant and the ambient air.
The reduced CO2 intake after LR results in reduced photosynthesis. This mechanism improves the plant's survival under conditions of drought stress, but is also associated with reduced yield (Bernier et al., Reference Bernier, Atlin, Serraj, Kumar and Spaner2008; Ping et al., Reference Ping, Wen, Dong, Li and Yu2011). This is the reason for the negative correlation between GY and LRS, LDS and RES. Upland rice genotypes that can maintain a higher rate of LWP, a lower rate of LR, a lower rate of LD and a higher ability of recovery are associated with higher GY under conditions of early drought, as reported previously (Dingkuhn et al., Reference Dingkuhn, Cruz, O'Toole and Dörffling1989; Jongdee et al., Reference Jongdee, Fukai and Cooper2002; Hu et al., Reference Hu, Jiang, Cao and Luo2004; Bunnag and Pongthai, Reference Bunnag and Pongthai2013).
Genotypes with the Way Rarem allele (qtl12.1) of quantitative trait loci have been shown to exhibit a reduced rate of LR and leaf drying, and a higher LWP, under severe drought conditions (Bernier et al., Reference Bernier, Serraj, Kumar, Venuprasad, Impa, Gowda, Oane, Spaner and Atlin2009). Upland genotypic variation in relation to LWP has been shown to exist in this study, and is was negatively correlated with drought score (r= − 0.75, P< 0.01, n= 42), which varied in relation to plant size (Mitchell et al., Reference Mitchell, Siamhan, Wamala, Risimeri, Chinyamakobvu, Henderson and Fukai1998; Jongdee et al., Reference Jongdee, Fukai and Cooper2002; Pantuwan et al., Reference Pantuwan, Fukai, Cooper, Rajatasereekul and O'Toole2002a, Reference Pantuwan, Fukai, Cooper, Rajatasereekul and O'Tooleb). Plant recovery was one of the important traits identified in early drought screening, with plants having a higher ability to maintain LWP being associated with a greater ability for recovery after a period of drought stress.
DTI as selection criteria for drought tolerance
The development of drought-resistant cultivars with a higher yield potential is one of the main objectives of rainfed rice breeding programmes. The identification of rice accessions with tolerance to drought is necessary for genetic research and breeding. Drought screening is a complicated trait to be addressed through the conventional approach of selection for yield and its stability over locations and years. The low heritability of yield under stress, the inherent variation under field conditions, and the limitation that there is usually only one experimental drought crop per year is reflected in a slow rate of progress (Eid, Reference Eid2009; Venuprasad et al., Reference Venuprasad, Dalid, Valle, Zhao, Espiritu, Cruz, Amante, Kumar and Atlin2009). Studies under greenhouse conditions provide an alternative option for early drought tolerance selection. Plant and root dry matter accumulation could be important traits of the recovery period, leading to higher yields, following early water deficits. However, all three traits are influenced by rice plant growth characteristics. For example, in relation to the value of RDW, it was found that G3 genotypes with high levels of early drought tolerance had high values under stress conditions, but had the lowest values under non-stress conditions (Fig. 2).
In this study, to avoid the potential influence of rice growth characteristics on drought tolerance evaluation, a DTI was calculated from the ratio of the value of three traits (RDW, PDW and GY) under non-stress and stress conditions. Based on the DTI value, the upland rice accessions were classified into three groups: G1 (susceptible); G2 (moderate tolerance); G3 (tolerant).
Compared with the other groups, G3 with a higher DTI value had the lowest mean value for LRS, LDS, RES and LWP under stress conditions. In contrast, PDW and GY showed the least reduction under drought stress conditions. Interestingly, the RDW values in G3 showed an increase under drought stress conditions, while the values decreased in the other groups. The root characteristics, including deeper and thicker roots (Yadav et al., Reference Yadav, Courtois, Huang and McLaren1997), root pulling resistance (Pantuwan et al., Reference Pantuwan, Fukai, Cooper, Rajatasereekul and O'Toole2002a, Reference Pantuwan, Fukai, Cooper, Rajatasereekul and O'Tooleb) and greater root penetration (Ali et al., Reference Ali, Pathan, Zhang, Bai, Sarkarung and Nguyen2000; Clark et al., Reference Clark, Aphale and Barraclough2000), could improve the adaptation of rice to drought through enhancing water uptake. The relationship between pre-harvest (leaf-related traits) and the DTI was also determined. LRS1 and LRS2, LDS and RES had a high relationship with DTI (R 2 = 0.76, 0.87 and 0.79, respectively) in G3 (Fig. 3), with the pattern of value distribution tending to decrease when the DTI increased. In contrast, LWP2 in G3 showed greater stability than that in the other groups. These results indicated that LRS1 and LRS2, LDS, RES and LWP2 were related to post-harvesting traits (i.e. yield). DTI provides a consistent selection trait for genotypes with potential drought tolerance, although it may differ with different screening methods (Ahadiyat et al., Reference Ahadiyat, Hidayat and Susanto2012). The traits that were found to be most useful for early drought screening in this experiment were LR, LD, LWP, RE and DTI.
Conclusions
Thai indigenous upland rice genotypes showed variations in their responses to early drought under greenhouse conditions in studies undertaken in 2011 and 2012.Among the criteria traits used to evaluate the association with early drought tolerance, the traits associated with drought tolerance included plant recovery ability, lower LRS and LDS, maintenance of high LWP and high DTI. This information is potentially useful for future breeders in genotype selection for early drought tolerance in upland rice, especially the DTI. In addition, of the 60 test accessions, five were identified as being drought-tolerant varieties, which have the potential for providing a source of drought-tolerant genes in future breeding programmes.
Supplementary material
To view supplementary material for this article, please visit http://dx.doi.org/10.1017/S1479262115000428
Acknowledgements
This research was supported by the Plant Breeding Research Centre for Sustainable Agriculture and Research Center of Agricultural Biotechnology for Sustainable Economy, Khon Kaen University, Thailand. The authors thank Dr John Schiller of the University of Queensland, Australia, for proofreading the manuscript. They also thank the Thailand Research Fund (Project code: IRG5780003) and the Faculty of Agriculture, Khon Kaen University, for providing financial support for manuscript preparation. J. Sanitchon is grateful to Khon Kaen University under Incubation Researcher Project for providing financial support.