The Positive and Negative Affect Schedule (PANAS) was created by Watson, Clark, and Tellegen in 1988. In Brazil, there is a special need for studies considering the PANAS psychometric properties. The Brazilian version of PANAS (Pereira, Calvanho, & Cunha, Reference Pereira, Calvano and Cunha1992) consists of a translated instrument. It is over 20 years old and thus requires adaptation despite the recent efforts in cross-cultural research. The scale has large potential in Brazil especially because of its simplicity and objectiveness in the context of the educational and social problems affecting most regions of the country. Besides, educational levels pose a major challenge in psychological testing in both ways: item comprehension and response.
When studied as a trait, affect is an important object in Psychology, since it consists of a mostly instinctual reaction of the organism, being important in the formation of complex emotions (Zajonc, Reference Zajonc1980). On the cognitive perspective, affect has been considered to take an important role in judgment and choice depending on its valence (Higgins, Reference Higgins1997) – positive or negative – as well as on specific forms of such valence (e.g. anger, fear and sadness) (Lerner & Keltner, Reference Lerner and Keltner2000).
Watson et al. (Reference Watson, Clark and Tellegen1988) observed that two main dimensions usually consistently emerged in researches related to affect. Watson et al. (Reference Watson, Clark and Tellegen1988) reviewed those studies and found strong evidence that a factorial dyad resulted from rotating solutions using the the varimax method, which often defines them as positive and negative affect. However, considering non-rotated solutions, they observed a single dimension ‘pleasant-unpleasant’ and excitement. Watson et al. (Reference Watson, Clark and Tellegen1988) reinforced that the orthogonal rotation of the factors is the best representation of PANAS’s latent structure because of this opposing relationship (‘pleasant-unpleasant’) in the factor loadings. Besides the well established initial orthogonal structure proposed in Watson et al. (Reference Watson, Clark and Tellegen1988), there have been recent advancements on the discussion of the factor structure of the PANAS. Leue and Beauducel (Reference Leue and Beaducel2011) state that during the past decade there have been a growing number of studies, cross-cultural included, investigating the two-factor model of affect by confirmatory factor analysis. From those studies, not only orthogonal structures were accepted as solutions but also oblique structures, considering positive and negative affect to be correlated. Beyond the two-factor model, some studies even suggest new factor models for the PANAS (e.g. three factor models, higher order models and models extracted while using the short and expanded form of the PANAS).
Watson et al. (Reference Watson, Clark and Tellegen1988) define Positive Affect as the magnitude of how much a person feels enthusiastic, active and alert. High levels of Positive Affect experience would correspond to the feeling of energy, focus and pleasant engagement to activities. Diversely, a low experience of the same kind of affect could be represented by feelings such as sadness and lethargy. Negative Affect would show its consequences in the opposite way, represented by subjective suffering and unpleasant engagement, which would be reflected in states such as anger, disgust, guilty, fear and nervousness. As follows, a low experience of negative affect would be related to an affective state of calmness and serenity.
The PANAS was created to represent the above mentioned traits and was structured as a list composed by 60 items, organized in 20 different categories. Each 10 categories corresponded to a dimension of affect: negative or positive (Watson et al., Reference Watson, Clark and Tellegen1988). The items were structured with single words intended to reflect these affective states. The initial version of the PANAS was named as PANAS-X. The final version of the instrument consists of 20 items selected after strict analyses upon the psychometric characteristics of its full form.
Because of its strong psychometric characteristics, the scale has been largely used, including in Brazil. The translated version to Brazilian Portuguese was obtained in the studies by Pereira et al. (Reference Pereira, Calvano and Cunha1992), although the study did not count with an investigation on its psychometric properties or parameters. The authors made modifications concerning its instructions, especially including the expression “I feel”, in order to help participants achieve a personal level of response. The type of response provided was also different, consisting of levels of agreement with the item stated. The main version (Watson et al., Reference Watson, Clark and Tellegen1988) provided responses over the intensity of the feeling expressed in the item.
The PANAS has been present in several studies since it holds high concordance level with other scales, as investigated by Engelmann and Pereira (Reference Engelmann and Pereira1994). It was compared to two other instruments – the Subjective Well-Being Scale (SWBS, Lawrence & Liang, Reference Lawrence and Liang1988) and the Present Affect States Schedule (PASS, Engelmann, Reference Engelmann1986, Reference Engelmann1987). Crawford and Henry (Reference Crawford and Henry2004) also investigated the relationship of the PANAS with other scales such as the Depression Anxiety and Stress Scale (DASS) and the Hospital Anxiety and Depression Scale (HADS), showing that the PANAS has a consistent measure when assessing depression and anxiety.
With regards to cross-cultural researches, Thompson (Reference Thompson2007) has been involved in efforts to develop an international version for the PANAS. For the sake of advances in cross-cultural studies about affect, it is important to obtain validity, reliability, factorial stability and measurements in international level in order to be compared. Besides, the author highlights that the main problem found during these studies still resides in the difficulty to find good translations of the scales that could fully match the meanings of the original instrument. The research conducted by Thompson (Reference Thompson2007) with international students indicates that despite the simple wording, the focal groups reported ambiguity for the meanings of items as “proud” and “excitement”.
Considering the findings of Thompson (Reference Thompson2007) and the discussed need for a review on the version published by Pereira et al. (Reference Pereira, Calvano and Cunha1992), the proposal of this research was to verify the psychometric properties of the PANAS scale, considering the item analysis paradigm from item response theory (IRT), the dimensionality assessment through an exploratory factor analysis (EFA), as well as the consistency of each dimension while respecting the assumptions of the methods for the main analysis (Linacre, Reference Linacre2011).
It is important to obtain more information on the dynamics of the PANAS scale in order to advance in studies of affect in Brazil. That requires understanding possible issues related to the translation of the scale and/or cultural aspects with regards to the constructs involved in the instrument. The data obtained can also provide further information for new cross-cultural studies involving Brazilian samples.
IRT methods were conducted in order to provide an important approach to item calibration. Difficulty parameters obtained for each item can provide information on which are the easiest and hardest. IRT modeling enables to understand individual response patterns. Therefore it is a subject-independent statistical analysis that allows understanding the idiosyncrasies of Brazilian samples. Also, there is clinical use in IRT modeling since professionals are able to understand the patients’ behavior regarding a difficult or easy item. That is helpful for intervention as well as for normative data. On a dimensional perspective, IRT modeling also provides a framework where items are evaluated under how effectively they can provide an estimated model compared to the empirical responses obtained, considering trait levels. An item with dimensionality problem informs that some other trait is influencing responses and that would reflect on model fit.
Method
Participants
Since this study used an online form to apply the PANAS scale, the sample was composed by a variety of participants, with a total n = 354 respondents, n = 115 male and n = 239 female, with an average age of 29.5 (SD = 10,18). Concerning educational level, 148 (41,81%) of the sample had basic level education (below bachelor level), 121 (34,18%) had university level and 85 (24,01%) had post-graduation degrees.
The subjects were recruited through online Brazilian communities and through email lists. Subjects had to identify their nationality according to country and city so it was possible to identify their origins. Participants responded a PANAS online form after reading and signing an online Statement of Consent presenting the objective of the research. The data collection period was between march of 2010 and march of 2011.
Instrument
The version adopted for this research was obtained through the translation by Pereira et al. (Reference Pereira, Calvano and Cunha1992), which consisted of a likert scale of five degrees of concordance and a time reference scale related to how the subject felt about his/her affective state by the time he/she responded to the scale. In order to make it clear for the participants that they should report their affective state at the moment of response, the following instructions were given: “Below you will find a list with sentences aimed at identifying your feelings. After each sentence you will be asked to choose ‘totally agree’, ‘agree’, ‘disagree’, ‘totally disagree’ or ‘indifferent’. please choose the option that best expresses your feelings at the very moment or reading. There are no right or wrong answers, just be as sincere as possible.” Response categories of the likert scale were related to how strongly they agreed about the perceived affective state expressed in the item. The response categories were: “totally disagree”, “disagree”, “indifferent”, “agree” and “totally agree”. The repeated use of the expression “I feel” in the items was maintained according to the suggestions found in Pereira et al. (Reference Pereira, Calvano and Cunha1992), in order to reinforce a personal statement, e.g. the participant had to reflect about his/her affective state.
Procedure
As stated before, this research used an online form containing a PANAS scale, through the web applet of Google Docs that enables creating online surveys. The link was posted to the web address of a blog maintained for the purpose of this research only.
Gosling, Vazire, Srivastava and John (Reference Gosling, Vazire, Srivastava and John2004) state that the fast growth of the internet provided new opportunities for researchers, in a new way to access subjects for survey type researches. Gosling et al. (Reference Gosling, Vazire, Srivastava and John2004) informed that a total sample of 361,793 participants, obtained through 510 publications, showed that it was possible to obtain a good diversified sample considering gender, economic status, geographic region and age through the internet. Gosling et al.’s results (2004) also show that concordance between traditional and virtual surveys is high, which proofs its reliability.
Data Analysis
For the data analysis, this research used two statistical software: SPSS (IBM) and Winsteps 3.72.3 (Linacre, Reference Linacre2011). O’Connor (Reference O’Connor2000) recommends two different methods for dimensionality analysis: Velicer’s minimum average partial (MAP) Test and parallel analysis. Velicer’s MAP analysis allows combining a complete principal component analysis (PCA) with a series of matrices of partial correlations.
As a second recommended dimension extraction method, parallel analysis calculates eigenvalues from random data sets that correspond to the total sample with regards to the number of persons and items (O’Connor, Reference O’Connor2000). For a more detailed dimensionality assessment, we proceeded with an EFA under the principal components method, considering the rotation of the factors in order to make interpretability of data possible. For the item analysis by the item response theory (IRT), the chosen method was the Rasch model for polytomous items. It was based on the Partial Credit Model’s (PCM) methodology provided by Winsteps software (Linacre, Reference Linacre2011) in order to verify fit statistics, parameters and test and item information functions.
Results
The data analysis confirmed the unidimensional assumption required for both item lists for each dimension. The factor loadings indicate that the PANAS holds good validity indexes in the Brazilian sample. It was also possible to verify that both scales, ‘negative’ and ‘positive affect’, have reliability indexes beyond acceptability, with high coefficients. The item analysis and fit statistics given by the PCM also indicate an excellent quality for items, making it possible to state that the PANAS provides items with good prediction capacity, locating persons along the trait continuum, as expected. Notwithstanding the good psychometric properties, there are important considerations due to an specific issue detected on both analyses.
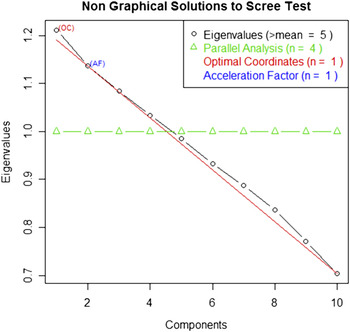
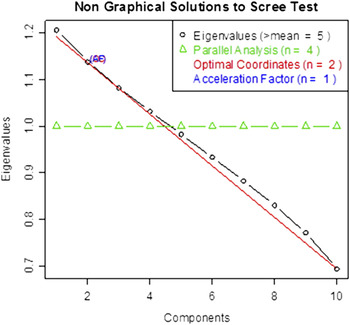
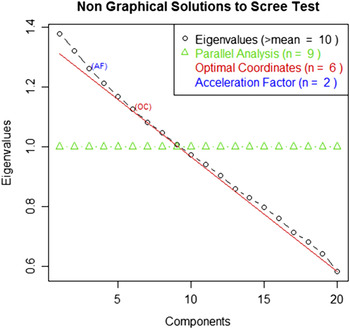
Velicer’s MAP test showed unidimenstionality for both positive and negative affect scales in the PANAS. The parallel analysis also supported the retention of the factors and a non graphical solution displays one acceleration factor also for each subscale (Figures 1, 2 and 3) and two acceleration factors when both scales are plotted together. The acceleration factor indicates the position where the “elbow” of the scree plot settles. It thus consists of a non graphical solution to the Cattel subjective scree test (Raiche, Riopel, & Blais, Reference Raiche, Riopel and Blais2006).
Scree plot for the Positive Affect dimension.

Scree plot for the Negative Affect dimension.

PANAS’ scree plot including both subscales (PA and NA).

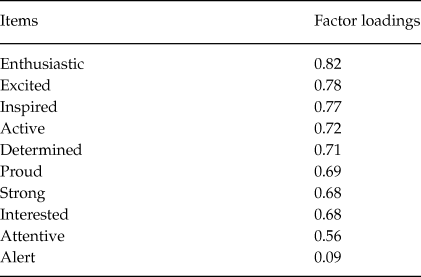
The EFA procedure for the positive affect scale had good results for factorability considering the Kaiser-Meyer-Olkin (KMO) measure of sampling adequacy KMO = .89. KMO index is interpreted according to Kaiser (Reference Kaiser1974), who states that KMO values are acceptable above 0.60. The scale holds a moderate consistency level, evaluated according to a Cronbach’s Alpha of .84. The factor accumulated an eigenvalue of 4.68, with 46% of the variance explained.
The scale presented a problem only for a particular item, – ‘I feel alert’ – which had a factor loading of r = .09. By excluding the item, the scale would gain even more reliability with the alpha rising to Crombach’s Alpha = .88. All of the other items had factor loadings above r = .50 (Table 1), considering the highest loadings for items ‘I feel enthusiastic’ (r = .82), ‘I feel excited’ (r = .78) and ‘I feel inspired’ (r = .77). The item analysis in the next steps provides useful information on item ‘I feel alert’, reason why it fails considering positive affect as a dimension.
Exploratory Factor Analysis for the ‘positive affect’ scale

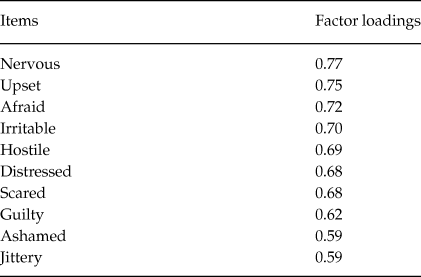
The negative affect (Table 2) scale also showed good results for factorability considering KMO = .88. The negative affect scale holds a high consistency for (α = .90). The factor accumulated an eigenvalue of 4.70, with 47.05% of the variance explained, with a residual factor of 1,17 (11%). All items had factor loadings almost above r = .60. The lowest factor loadings were ‘I feel ashamed’ (r = .59) and ‘I feel distressed’ (r = .59). The items with the best loadings were ‘I feel nervous’ (r = .76), ‘I feel upset’ (r = .75) and ‘I feel scared’ (r = .72).
Exploratory Factor Analysis for the ‘negative affect’ scale

Considering both scales while performing an exploratory factor analysis (principal components method), the data maintained the good factorability observed in the past procedures, with a KMO = .90. The total variance accounted by the model was of 49.73% considering a two-factors model. Nevertheless, a third factor was detected but accounted for only 5.85% of the variance. The first and second factors scored eigenvalues of 7.19 and 2.76 respectively. As explained before, considering the results of the non-graphical solution, such as the acceleration factor, only the two first factors were retained.
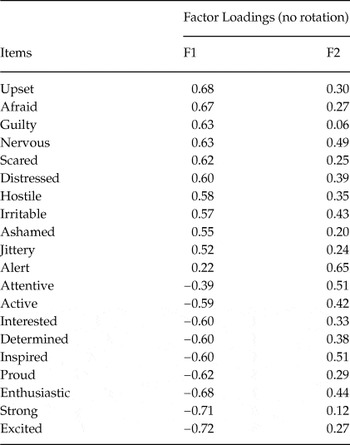
Factor loadings (Table 3) were most significant for the first factor with all the items loading above .30. Item “I feel alert” was an exception to that, with a loading of r = .22, and positive and negative affect items loading with opposite arithmetic signals, which suggests it represents both of the PANAS’s original dimensions. This also reflects the results already exposed in Watson et al. (Reference Watson, Clark and Tellegen1988) concerning a general first dimension for a non-rotated solution interpreted as pleasant-unpleasant. A second factor loads a total of 11 items, both positive and negative affect with the same arithmetic signal. That reflects another dimension suggested in Watson et al. (Reference Watson, Clark and Tellegen1988), ‘excitement’. Rotation was needed in order to optimize interpretation of the factors.
Exploratory Factor Analysis - data without rotation

According to the contributions of Watson et al. (Reference Watson, Clark and Tellegen1988), PANAS’ items are better represented through the varimax rotation, portraying the factors in an orthogonal relationship. Notwithstanding this research also performed an oblique rotation (promax), specially taking under consideration the complexity of the prior EFA results with the complete item set and the findings discussed in Leue and Beauducel (Reference Leue and Beaducel2011).
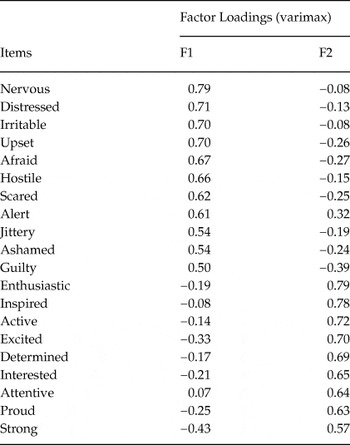
The results of the varimax rotation method (Table 4) converged to a solution (two fixed factors), with the first dimension loading predominantly negative affect items, while the second dimension held high factor loadings for positive affect items. Item “I feel alert” showed a high factor loading for the negative affect dimension (r = .61) but also loaded in the second dimension with an acceptable factor loading (r = .32). That revealed some concern about cross-loading, even though it meant item “I feel alert” represented mostly a negative affect. In the first dimension, the items with the highest factor loadings were “I feel nervous” (r = .79), “I feel distressed” (r = .71) and “I feel irritable” (r = .70). In the second and positive affect dimension, the items with the highest factor loadings were “I feel enthusiastic” (r = .79), “I feel inspired” (r = .78) and “I feel active” (r = .71).
Exploratory Factor Analysis – varimax rotation method

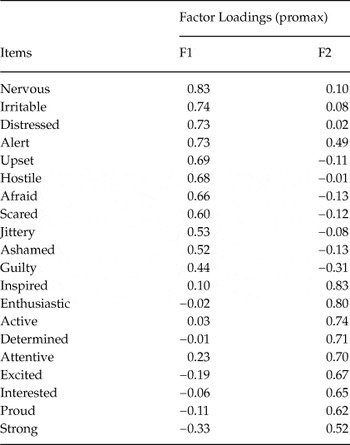
Considering oblique rotation (Table 5), this research performed a promax type, once the result of the component correlation matrix was higher for that method (r = −.42) between the first and second dimensions. Both factors remained respectively negative affect and positive affect, with the same structure, showing that it is possible to find oblique solutions for the PANAS, even when displaying higher loadings. The pattern matrix output had the highest loadings in the first factor for the items “I feel nervous” (r = .83), “I feel irritable” (r = .74) and “Ifeel distressed”(r = .73). On the second factor, the highest loadings were items “I feel inspired”(r = .83), “I feel enthusiastic” (r = .80) and “I feel active” (r = .73). The problem observed for item “I feel alert” remained with cross-loadings in both factors, with an even higher loading than in the varimax rotation for a factor loading of r = .73 in the negative affect and r = .49 in the second factor. That means that the item is represented both as a negative and positive affect, but predominantly a negative feeling. Despite the findings on factor loadings, the current paper maintained the alertness item as a positive affect item, in order to achieve a deeper understanding on its assessment problems on a trait level through PCM.
Exploratory Factor Analysis – promax rotation method

Considering the PCM analysis, fit statistics was assessed observing the output values for ‘infit’ and ‘outfit’ in order to estimate the dynamics per item according to the individual’s ability. de Ayala (Reference de Ayala2009) states that these statistics are related to the behavior of the response pattern for the items of the instrument. ‘Infit’ statistics are t-standardized information-weighted mean square statistics, which is sensitive to unexpected responses to items near a person’s ability location (θ).
‘Outfit’ statistics, however, is concerned with whether or not a person gives unexpected responses to items far from one’s ability measure. The values used for this purpose are the MnSq and ZStd. The first consists of a mean-square value considering it fitter as the closer it gets to 1.00. ZStd is a t-standardized value for the MnSq. de Ayala (Reference de Ayala2009) suggests that cut point values for both ‘infit’ and ‘outfit’ should be between .50 and 1.50, with values above or below indicating items fit problems.
RMSE is the root mean square standard error and provides the square-root of the average error variance according to the model’s specifications. As we report in this article, the Model RMSE, it reflects a ‘best case’ reliability, which reports an upper limit to the reliability of measures based on the set of items for the current sample. True standard deviation (True SD) is provided as the sample’s standard deviation of the estimates, after subtracting the error variance from the observed variance. The item reliability index provided in the summary for each scale reflects how it is possible to make discrimination from a highly measured item to one measured lowly. This is a separation measure that means the reproducibility of relative measure location (Linacre, Reference Linacre2011).
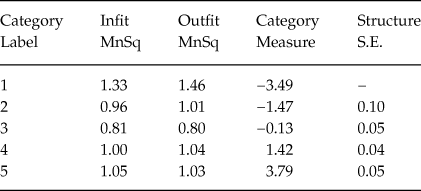
The category response structures were analyzed for both scales before doing more specific item analysis. Considering the ‘positive affect’ scale (Table 6), the category structure for the responses were well adjusted in general, with fit statistics and measures behaving as expected for a rating scale under the PCM model. The steps (response categories) had item characteristic curves (ICCs) with the ability measure growing within the scale. The ability measures were respectively: θ = −3.49 for category 1; θ = −1.47 for category 2; θ = −0.13 for category 3; θ = 1.42 for category 4; θ = 3.79 for category 5.
Positive affect’ scale response category structure summary

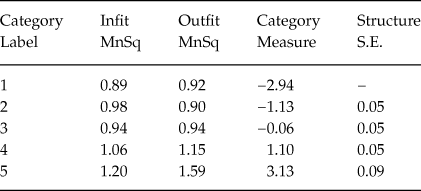
The ‘negative affect’ scale (Table 7) also had good fit measures, although category 5 had surpassed the acceptable range value specifically for outfit, with MnSq = 1.59. Although the fit problem was not alarming, it is necessary to question the adequacy of the response categories in translated version used for this article in future researches with the PANAS.
‘Negative affect’ scale response category structure summary

The steps also portrayed a structure that respected the growth of the ability measures for the ICCs according to the expected: θ = −2.98 for category 1; θ = −1.13 for category 2; θ = −0.06 for category 3; θ = 1.10 for category 4; θ = 3.13 for category 5.
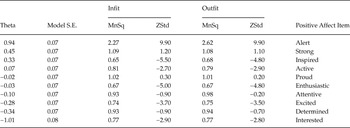
After observing the category structure issues, we analyzed each item in both scales. For the ‘positive affect’ scale (Table 8), the item with highest difficulty was ‘I feel alert’, with location at θ = 0.94. But that is also the item with the worst fit statistics, with infit of MnSq = 2.27 (ZStd = 9.90) and outfit of MnSq = 2.62 (ZStd = 9.90). A more specific analysis of the item shows that the average ability does not ascend with the category score. That suggests an inversion of the item score.
Parameters and fit statistics for the ‘positive affect’ scale

Besides, the fit statistic shows that the item is not capable of predicting individuals located either near or far from the item measure. The following item with higher difficulty is ‘I feel strong’ located at θ = 0.45, with acceptable fit statistics for an infit of MnSq = 1.09 (ZStd = 1.20) and an outfit of MnSq = 1.08 (ZStd = 1.10).
The “easiest” item for the positive affect scale is “I feel interested”, with location at θ = −1.01. The item with the best fit is “I feel proud”, located at θ = −0.02, with an infit of MnSq = 1.02 (ZStd = 0.30) and outfit of MnSq = 1.01 (ZStd = 0.20). The positive affect scale has excellent item reliability, 0.98, for an RMSE = 0.07, separation index of 6.94, and true SD = 0.49, for a Chi-Square of χ2 = 7530.53 significant for a p < .001.
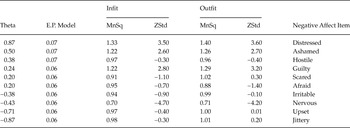
On the analysis of the ‘negative affect’ scale (Table 9), the item with highest difficulty was ‘I feel distressed’, with location at θ = 0.87, for an infit of MnSq = 1.33 (ZStd = 3.50) and outfit of MnSq = 1.40 (ZStd = 3.60). The easiest item was “I feel jittery”, located at θ = −0.87, with an infit of MnSq = 0.98 (ZStd = −0.30) and outfit of MnSq = 1.01 (ZStd = 0.20), which is also the item with best item statistics. The negative affect scale also had excellent item reliability, 0.99, for an RMSE = 0.06, separation index of 8.28, and true SD = 0.53, for Chi-Square of χ2 = 7752.31 significant for a p < .001.
Parameters and fit statistics for the ‘negative affect’ scale

Discussion
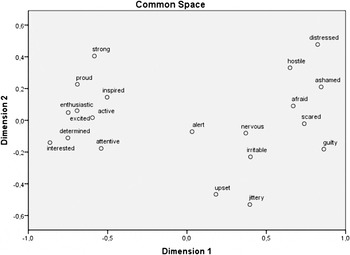
Considering the results obtained, the PANAS scale holds excellent psychometric qualities. Nevertheless, we found a dimensional representation issue regarding the version used. That was related to item ‘I feel alert’, which, according to the factor analysis’ results, represents a different trait. The item also showed representation problems in the general factor for the non-rotated solution, while only appears in the excitement dimension in this case. With a PROXSCAL analysis, the map obtained (Figure 4) shows the item closer to the ‘negative affect’ dimension, with Tucker coefficient of congruence = .98. Considering the data, Brazilians hold ‘alert’ as a predominantly negative affect trait– the cross-loadings show a clear ambiguity, especially considering the promax rotation. The trait ‘alertness’ may be more characteristic of the production standards of the American culture, reason why the original scale portrays the trait as a positive affect item.
Dimensionality map through the PROXSCAL method plotting both ‘positive affect and negative affect’.

Pereira et al. (Reference Pereira, Calvano and Cunha1992) had similar findings concerning this item. Notwithstanding, it is important to clarify the limitations of this study concerning cross-cultural comparisons due to sample-size and research design. The instruction to consider the ‘moment of reading’ in the study is an approximation to the trait-level approach. That means the PCM provides a limited insight. Further studies should be taken aiming for a better understanding of the trait instructions for the PANAS. A larger sample should be used for cultural comparisons. Concerning item ‘I feel alert’, similar findings can be seen in Robles and Páez (Reference Robles and Páez2003). They evaluated a Mexican (Spanish) version for the PANAS. The study showed a small positive factor loading of .24 for the item as a negative trait, while the rest of the items have a negative small factor loading.
The item analysis showed it was possible to observe the same inversion empirically, as stated before, even though the cross-loading for the item provided a factor loading above .30 on positive affect. Both scales have an acceptable range of item difficulty, considering the reliability indexes. The scales are also able to make optimal discrimination between individuals and their respective ability parameters. The results prove once more that the PANAS scale is a reliable instrument for both research and practical use. It is as well a good reference for the creation of new scales aiming at the perception of affect as one of its variables. It is also important to state that cross-cultural studies should be encouraged according to the magnitude of the potential impact of cultural issues on the perception of affect. Researchers and studies related to Brazilian samples should be aware to detect similar problems related to item “I feel alert” since that may jeopardize estimations and cause biased results.