Introduction
The Waterberg quartz-hematite-PGE deposit, ~15 km WNW of Mookgophong (former Naboomspruit), Waterberg District, Limpopo Province (South Africa) was discovered in 1923 and marks the first find of ‘platinum’ in economically feasible quantities in South Africa (Wagner and Trevor, Reference Wagner and Trevor1923; Wagner, Reference Wagner1929a,b; McDonald and Tredoux, Reference McDonald and Tredoux2005). Waterberg is a rare example of a hydrothermal Pt-bearing quartz-vein deposit, with veins structurally controlled in a NNE–SSW trending fault set. Part I of this study (Oberthür et al., Reference Oberthür, Melcher, Fußwinkel, Van den Kerkhof and Sosa2018) deals with the ore mineralogy and geochemistry of the ore minerals and also gives details about the regional geology and history of the mine. The present paper (Part II) focuses on the chemical characterization of the quartz veins, the host of the PGE mineralization. Besides petrographic and ore petrographic observations, the methods employed include cathodoluminescence (CL) microscopy, quartz trace-element analysis (EPMA, LA-ICP-MS), stable isotope (δ18O) analysis, and fluid-inclusion microthermometry. By distinguishing different quartz generations, the present study enables a better characterization of the changing physicochemical parameters during multistage mineralization and cooling.
The Waterberg deposit is positioned on the Welgevonden fault related to the Thabazimbi–Murchison Lineament (TML; see Oberthür et al., Reference Oberthür, Melcher, Fußwinkel, Van den Kerkhof and Sosa2018, Part I for details), a major crustal suture zone at the northern margin of the Kaapvaal Craton (Armitage, Reference Armitage, McDonald and Tredoux2007). The TML is known as a long-living fault system with a history reaching back to the mid-Archean that has been periodically reactivated (McDonald and Tredoux, Reference McDonald and Tredoux2005). The platinum mineralization of the Main Lode can be traced laterally for ~500 m, thus only a small section of the fault is mineralized. The age of the PGE mineralization is largely unknown even though McDonald and Tredoux (Reference McDonald and Tredoux2005) suggested relatively young ages of <180 Ma (related to Pangaea breakup), possibly attributed to later episodes of fault reactivation until recent times. In the present study we included laser ablation U-Pb and (U-Th)/He radiometric age determination of hematite, which is associated with the PGE mineralization. Contrary to earlier suggestions, our study shows that young ages for the mineralization can be excluded.
Armitage et al. (Reference Armitage, McDonald and Tredoux2007) conducted mineralogical and fluid-inclusion studies, along with performing detailed geological mapping of the Waterberg platinum deposit. According to these authors, the geometry and trapping temperatures of quartz associated with the Pt mineralization suggest an introduction of the platinum via a fluid phase that homogenized at ~200°C and that itself was part of a complex succession of hydrothermal events, ranging from high-temperature fluids with homogenization temperatures (Th) of up to 400°C hot ore-bearing solutions to low-temperature fluids that crosscut the existing mineralization and in part also remobilized earlier PGE. Van den Kerkhof and Sosa (Reference Van den Kerkhof and Sosa2009) identified four generations of quartz, whereby early mineralizing quartz, here referred to as Qtz-2a is related to the precipitation of the ore minerals including the PGM. Fluids involved in the ore deposition were of low salinity (~6 wt.% NaCl eq.). According to these authors, different quartz generations represent pulses of hot fluid infiltration followed by cooling.
General petrography and mineralogy
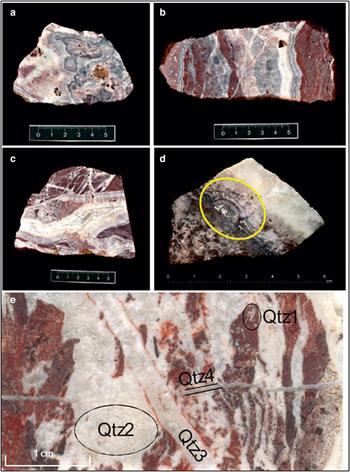
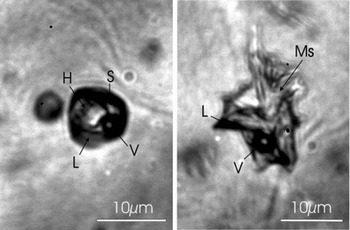
The Waterberg deposit is a fault-bound hydrothermal quartz-hematite-PGM vein deposit. Hematite is the predominating opaque mineral (up to 10 vol.%), and sulfides are very sparse. Characteristic of all samples are reddish, brecciated angular fragments (termed “felsite” by Wagner and Trevor, Reference Wagner and Trevor1923) and part of the 2.06 Ga Rooiberg group (Armitage et al., Reference Armitage, McDonald and Tredoux2007). The brecciated fragments are impregnated with patches of white quartz, obviously the first generation of quartz (Qtz-1). The PGM-bearing quartz veins are multiply banded indicating numerous pulses of fluid infiltration producing cementing quartz generations (Fig. 1). Microscopic studies revealed three generations of white quartz veins and veinlets showing cross-cutting relationships (Van den Kerkhof and Sosa, Reference Van den Kerkhof and Sosa2009). The different quartz types can be distinguished by their morphology, CL and trace-element signature. The dominant Qtz-2 forms the cement between the reddish fragments as well as larger zoned veins with radial-fibrous aggregates, botryoidal textures and druses. The platinum-group minerals (PGM) are associated with Qtz-2 and occur together with hematite/specularite. Goethite replaces hematite in altered samples. Many Qtz-2 crystals exhibit well-developed growth zoning and are crowded with minute hematite inclusions arranged parallel to the crystal faces between successive growth zones. Green mica which forms common solid inclusions in Qtz-2 could not be identified with certainty, but the Raman spectrum shows no similarity with chlorite (probably ganterite, Ba-muscovite or bayerite). Aqueous fluid inclusions (H2O–NaCl) occasionally contain fine-grained fibrous muscovite, as confirmed by Raman analysis (Fig. 10).
(a–d) Photographs of ore samples from the Waterberg deposit. Note multiple banding of quartz veins. (d) Pt mineralization (metallic white, yellow mark) in banded quartz vein (Qtz-2) grown on Qtz-1. (e) Quartz generations Qtz-1 to Qtz-4 in sample “F”. Qtz-1 = Quartz within the felsic fragments; Qtz-2 = massive quartz veins; Qtz-3 = sharp quartz vein; Qtz-4 = late cross-cutting veinlet.

Qtz-3 forms thin veins with similar properties as Qtz-2, but both quartz vein types show cross-cutting relationships. Qtz-4 occurs as very fine veinlets, which cross-cut all other quartz types (Fig. 1e). The Qtz-2 veins typically show crustiform and reniform banding, with prismatic crystals in the centre of these veins forming comb structures. In the centre of the veins, fine-grained vuggy textures show evidence of late open-space filling. Some of the vugs are filled with cuspate masses of specular hematite. All these textures are characteristic of an epithermal environment of mineralization (McDonald et al., Reference McDonald, Ohnenstetter, Rowe, Tredoux, Pattrick and Vaughan1999).
Samples and methods
Most of the samples studied were obtained from museum collections including the collections of E. Reuning (samples collected in 1925), Museum für Naturkunde in Berlin and P. Ramdohr at the University of Heidelberg. Further samples were loans from the Natural History Museum in London, the Council for Geoscience in Pretoria, and the University of Cape Town, South Africa (see Oberthür et al., Reference Oberthür, Melcher, Fußwinkel, Van den Kerkhof and Sosa2018 for details on the sample material). Sixteen polished thin sections were prepared for petrographic, CL and EPMA studies. Twenty-eight doubly-polished ca. 200 µm thick plates were prepared for fluid-inclusion studies. Polished sections were used for LA-ICP-MS, stable isotope (δ18O) analysis and hematite geochronology.
Phase transitions in fluid inclusions were investigated by using a Linkam THMS 600 heating-freezing stage cooled with liquid nitrogen (Shepherd, Reference Shepherd1981). The stage was calibrated by a set of synthetic fluid-inclusion standards. For temperatures around –56.6°C (the melting point of CO2) and around 0°C, the accuracy is better than 0.5°C, whereas for temperatures between 200 and 600°C, the accuracy is better than 5°C. Salinities were calculated using the revised equations of Bodnar and Vityk (Reference Bodnar, Vityk, De Vivo and Frezzotti1994).
Raman analysis was performed using a Horiba–Jobin–Yvon HR-Raman spectrometer provided with a 488 nm (blue) laser. This was done in order to check the presence of gases like CO2 in the fluid inclusions, and for identifying daughter phases.
Cathodoluminescence techniques have been demonstrated to be successful in unravelling complex mineralization (e.g. Van den Kerkhof and Hein, Reference Van den Kerkhof and Hein2001), notably in hydrothermal ore deposits (Wilkinson, Reference Wilkinson2001). We applied optical cathodoluminescence microscopy (O-CL) as well as CL-supported scanning electron microscopy (SEM-CL). O-CL studies were carried out using a hot cathode HC3-LM-Simon-Neuser CL microscope (Neuser et al., Reference Neuser, Bruhn, Götze, Habermann and Richter1995) equipped with a Kappa DX 40C Peltier-cooled camera. The operating conditions were 14 kV acceleration voltage and a beam current of < 1 mA, corresponding to 20–40 μA/mm2 beam current density. Studies with an electron microprobe (JEOL JXA 8900RL) equipped with a CL-detector (200–900 nm) have the advantage of combining CL-imaging and wavelength resolving trace-element analysis. The main trace elements were quantitatively measured in quartz with an acceleration potential of 20 kV, a beam current of 80 nA and with the following detection limits (calculated as the 2-sigma deviation of the error by counting statistics of the background signals): Al (5 µg/g), Fe (10 µg/g), K (7 µg/g) and Ti (8 µg/g). The spot size of the open beam was 2 µm. Details of the analytical protocol are described in Kronz et al. (Reference Kronz, Van den Kerkhof, Müller, Götze and Möckel2012).
Laser ablation ICP-MS analysis in quartz was performed for the following 25 elements (with typical detection limits given in μg/g in brackets): 29Si (400), 47,49Ti (5), 27Al (5), 57Fe (20), 55Mn (1), 43Ca (500), 23Na (20), 39K (10), 31P (20), 7Li (2), 34S (200), 75As (2), 53Cr (20), 60Ni (3), 63Cu (2), 208Pb (0.1), 35Cl (1000), 75As (2), 106Pd (0.04), 121,123Sb (0.3), 182W (0.1), 195Pt (0.2), 197Au (0.05), 232Th (0.02) and 238U (0.02) at spot sizes of ~100 µm. A VG PQ2+ mass spectrometer equipped with an S-option to raise sensitivity was used. The laser ablation system was a 266 nm Nd:YAG VG UV microprobe. Analysis was performed with 7 Hz repetition rate of the firing laser, recording the counts resolved for 30 s acquisition time, 1 point per peak jump mode, and 2–3 mJ energy on the sample surface. Silicon was measured as the internal standard with NIST SRM 612 as an external calibration standard (Rocholl et al., Reference Rocholl, Simon, Jochum, Bruhn, Gehann, Kramar, Luecke, Molzahn, Pernicka, Seufert, Spettel and Stummeier1997).
High-precision in situ oxygen isotope analysis was carried out using an ArF laser. The advantage of this method is the lack of oxygen isotope fractionation during laser ablation (see Wiechert and Hoefs, Reference Wiechert and Hoefs1995 for details).
Unconventional, hematite-based geochronology was applied on tabular, well developed crystals several mm in size and on fine-grained, massive aggregates. The U-Pb radiometric age determination has been performed by LA-ICP-MS on polished mounts. Due to the presence of common Pb, the hematites were screened by laser ablation analyses along lines prior to spot analyses. We used zircon reference materials as the study of Ciobanu et al. (Reference Ciobanu, Wade, Cook, Schmidt Mumm and Giles2013) has shown its applicability for U-Pb geochronology of hematite. Hematite (U-Th)/He thermochronology was performed on ~100 µg sized fragments. The degassing of the radiogenic helium took place in the full-metal gas extraction line of GÖochron laboratories similarly to the routine zircon measurements (see details in Tatzel et al., Reference Tatzel, Dunkl and von Eynatten2017). For the dissolution of hematite we used 6N ultrapure HCl in a pressurized Teflon bomb at 140°C. Danišík et al. (Reference Danišík, Evans, Ramanaidou, Mc-Donald, Mayers and McInnes2013) reported the evaporation of uranium during thermal degassing of helium, when hematite is transforming into another crystal lattice. This loss of U would result in ‘too old’ ages. That is why we controlled the U loss by trace-element analysis of unheated aliquots. The ratios of the mean U and Th concentrations in the heated/unheated aliquots were used as correction factor for the (U-Th)/He ages of the tabular hematite. In case of massive hematite the U loss is minor and badly constrained, thus no correction was applied.
Results
Cathodoluminescence microscopy of quartz
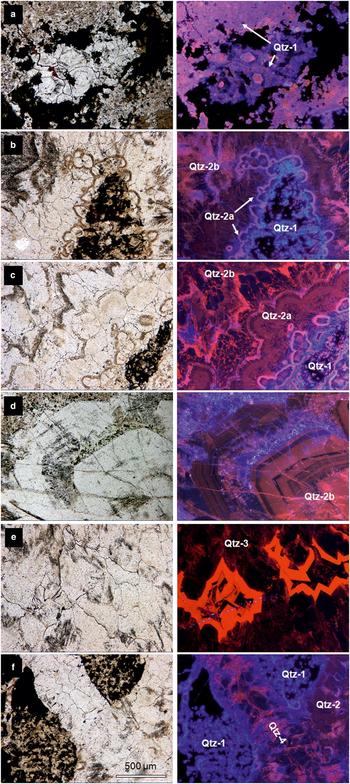
The CL colours of quartz are extremely diverse. Blue, magenta/pink, red, brown, and dull (almost non-luminescent) quartz has been mostly observed (Fig. 2a–f). The luminescence colours are related to both primary textures like growth zoning, and secondary textures like diffusion rims marking grain boundaries. The felsite Qtz-1 shows dominantly patchy blue and/or magenta CL, whereas the vein quartz shows dominantly brown, red and dull CL. Qtz-1 is highly impure, has many inclusions and is intimately intergrown with opaque minerals. The quartz grains show typically irregular to roundish morphology. Locally, idiomorphic quartz growth nuclei with pink CL were observed (Fig. 2a).
Selected microphotographs of Qtz-1 to Qtz-4 in optical cathodoluminescence (all photos the same scale, long edge = 1.75 mm). (a) Qtz-1 in between opaque phases showing intense blue and magenta CL colours. Sometimes idiomorphic quartz crystals can be distinguished (b) Qtz-1 overgrown by Qtz-2. Botryoidal textures are typical for the early hydrothermal quartz phase (Qtz-2a), whereas later Qtz-2b forms as comb quartz. (c) Successive quartz generations Qtz-1 (blue CL), Qtz-2a (brown and magenta CL), Qtz-2b (red and non-luminescent). (d) Large idiomorphic crystal (Qtz-2b) showing growth zones. Next page: (e) Central part of a Qtz-3 vein showing bright red and non-luminescent zones (f) Qtz-4 consisting of quartz crystals (brown CL) with growth zoning cemented by quartz with reddish CL cross-cuts Qtz-1 (blue CL) and Qtz-2 (mainly brown CL).
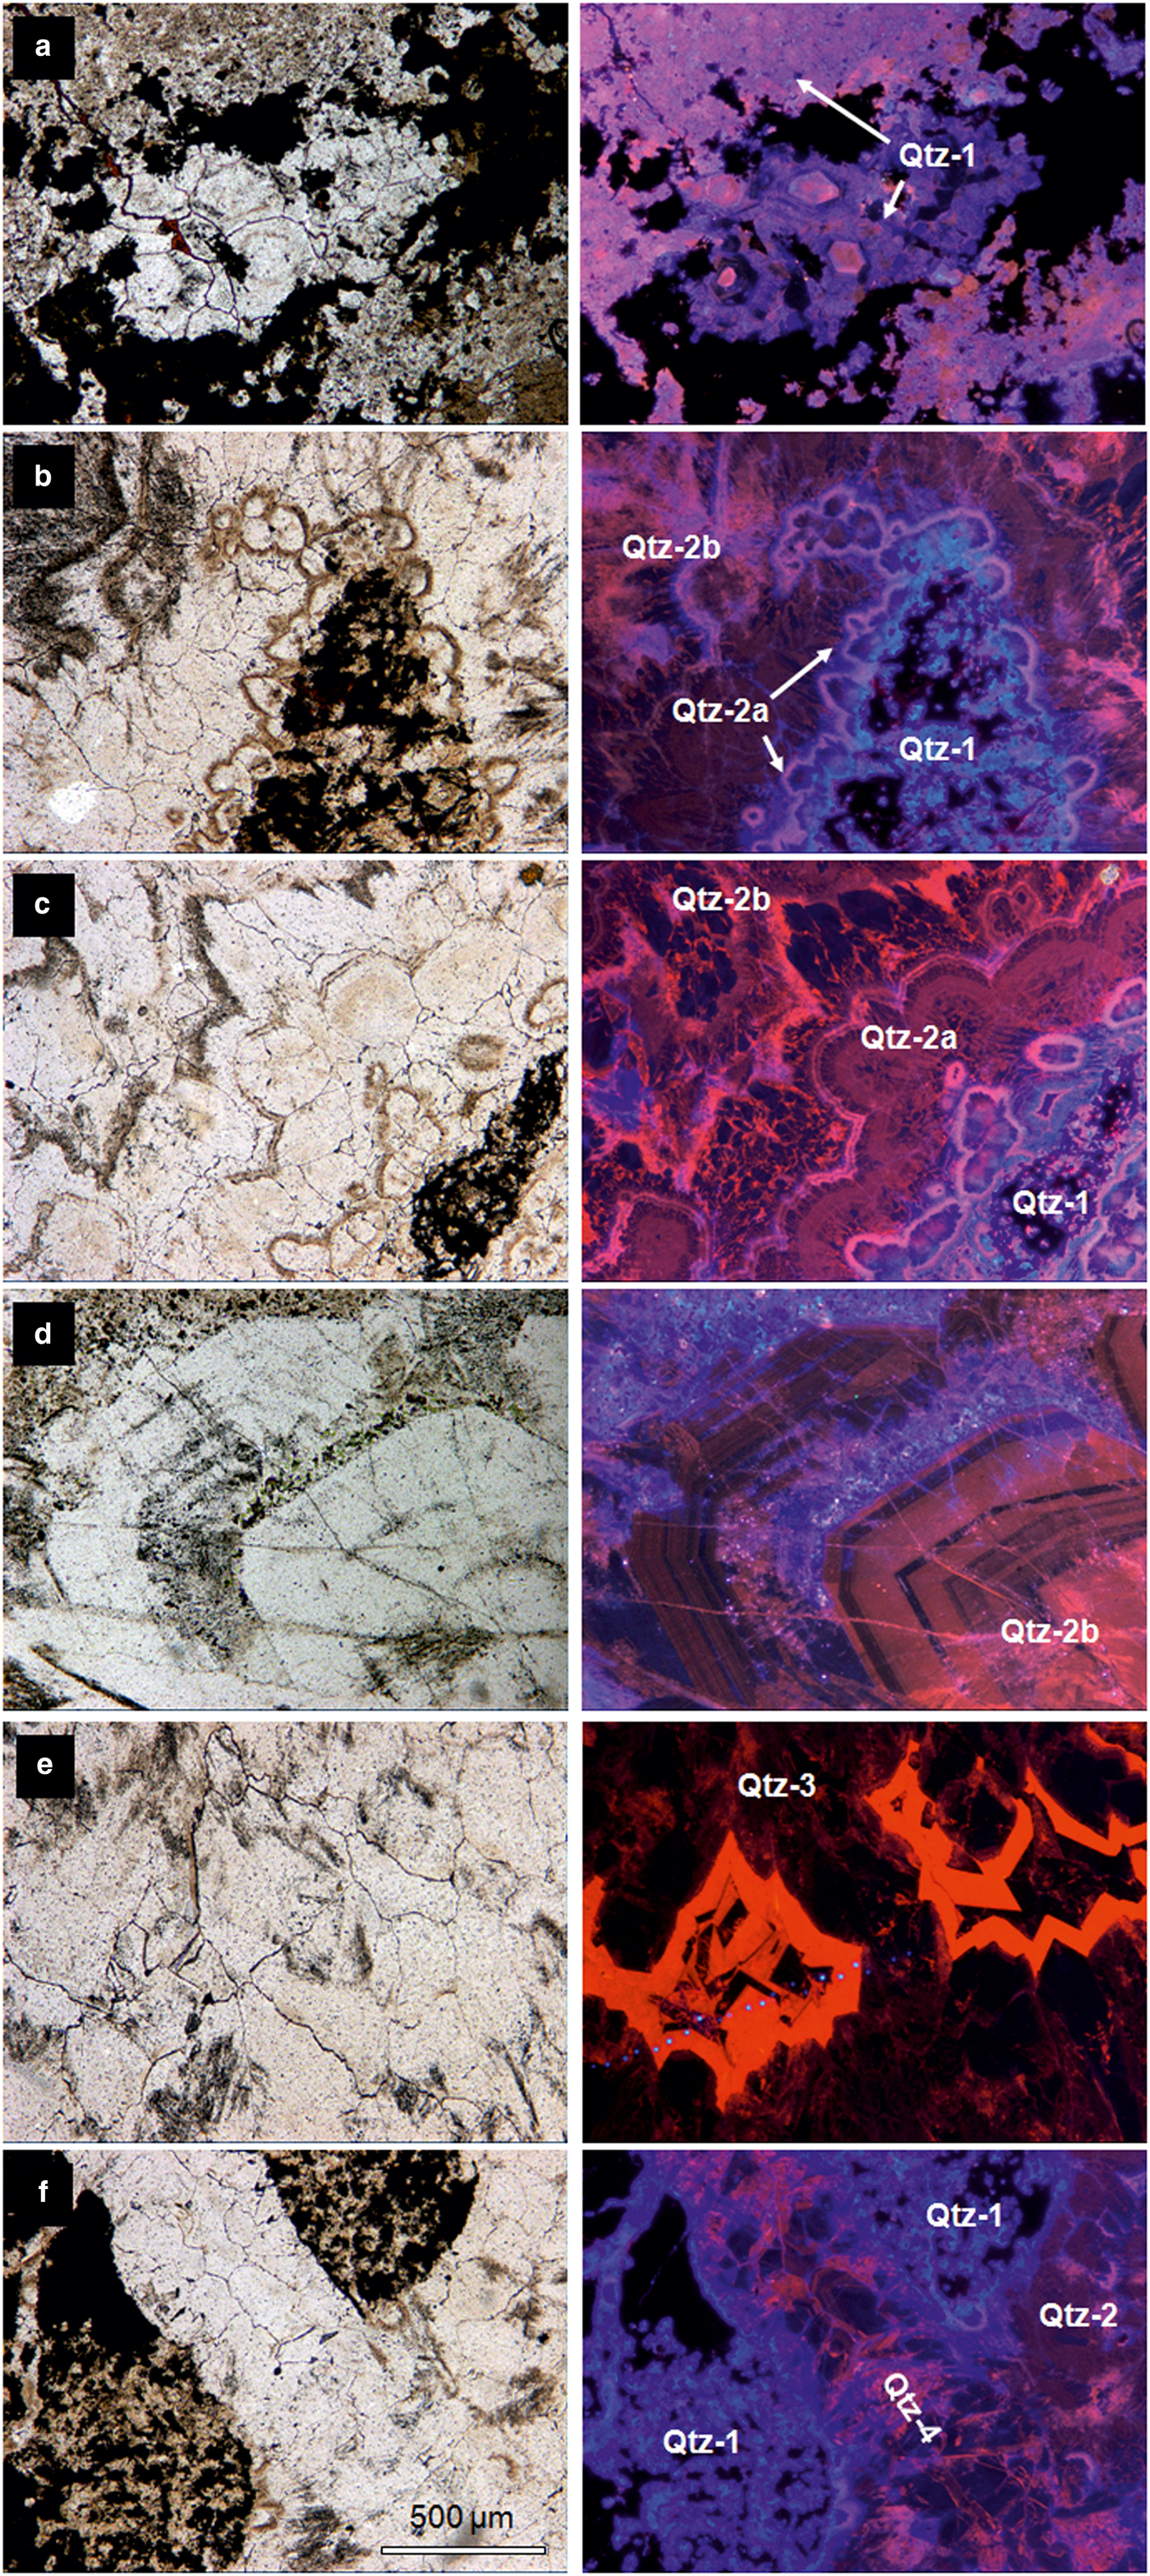
Qtz-2 is the dominant vein quartz, which cements the reddish host rock fragments or forms cm-wide aggregates. The first stage of quartz mineralization, formed directly on the felsic fragments, is characterized by banded milky quartz grading to botryoidal radial-fibrous aggregates concentrating along the vein boundaries (Qtz-2a). The botryoidal forms are marked by roundish fringes with very fine inclusions and magenta CL (pointing to Fe3+-rich quartz, see below, Fig. 2b–c). The overall CL of Qtz-2a is brown, even when parts of the quartz adjacent to Qtz-1 may show shades of bluish CL, probably as an effect of late diffusion of trace elements (notably Ti) from the felsites into the vein quartz, after quartz deposition. Blue CL is also observed along the contacts with opaque minerals, probably also as a result of Ti diffusion. The central parts of the veins typically contain clear prismatic quartz and druses, defined as Qtz-2b. This quartz mainly consists of comb quartz and zoned idiomorphic quartz crystals with red, brown and dull luminescence. Growth zoning developed in many of these quartzes (Fig. 2d). The cores of quartz crystals are often dark dull-luminescent, whereas the latest quartz growth zones in the centre of the veins show bright orange-red CL colours.
Barren Qtz-3 and Qtz-4 form thin (<1 cm) veinlets with similar properties as Qtz-2, but the veins show a cross-cutting relationship. Also the first stage of Qtz-3 is characterized by botryoidal quartz, even when less common here. The late-stage dull luminescent quartz with bright orange-red growth zones was also observed for Qtz-3 (Fig. 2e). Barren Qtz-4 is mainly sparry and dull luminescent; the early-stage botryoidal quartz type is missing here (Fig. 2f).
Trace-element analysis
EPMA
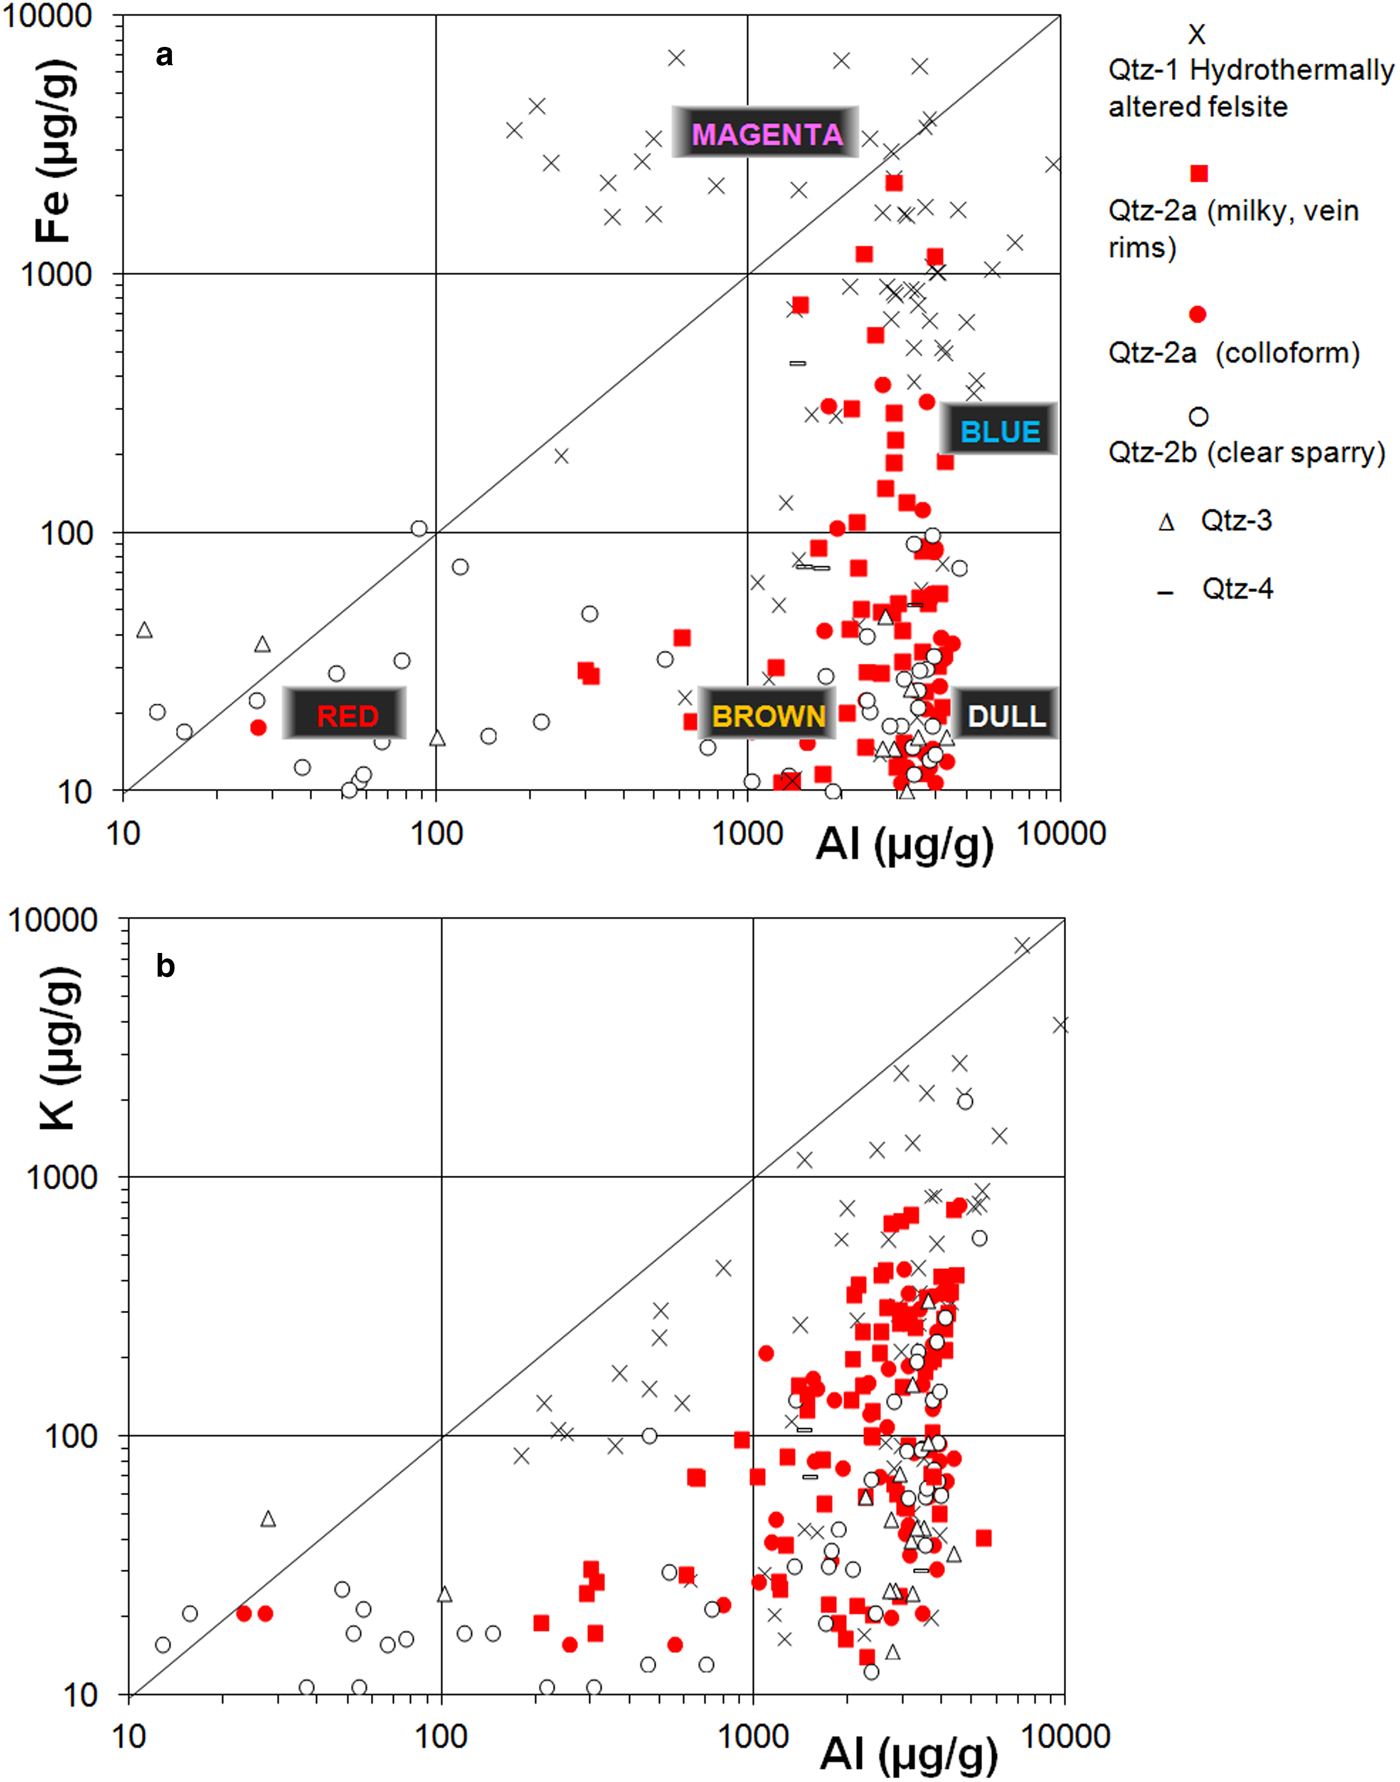
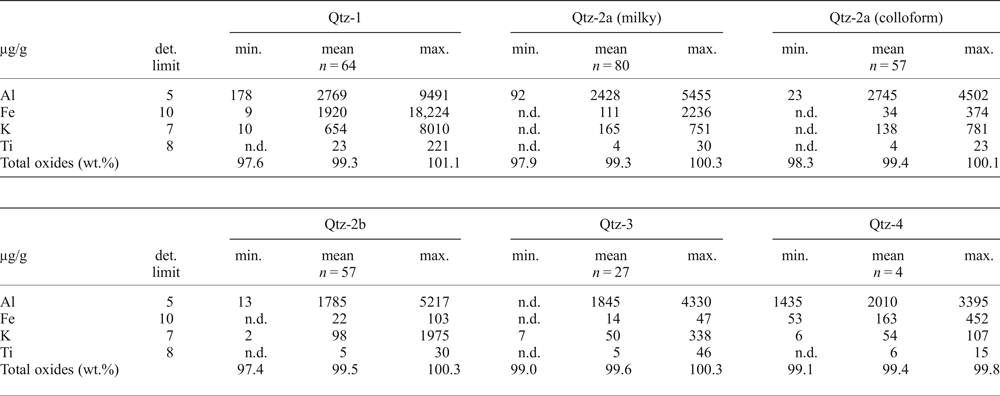
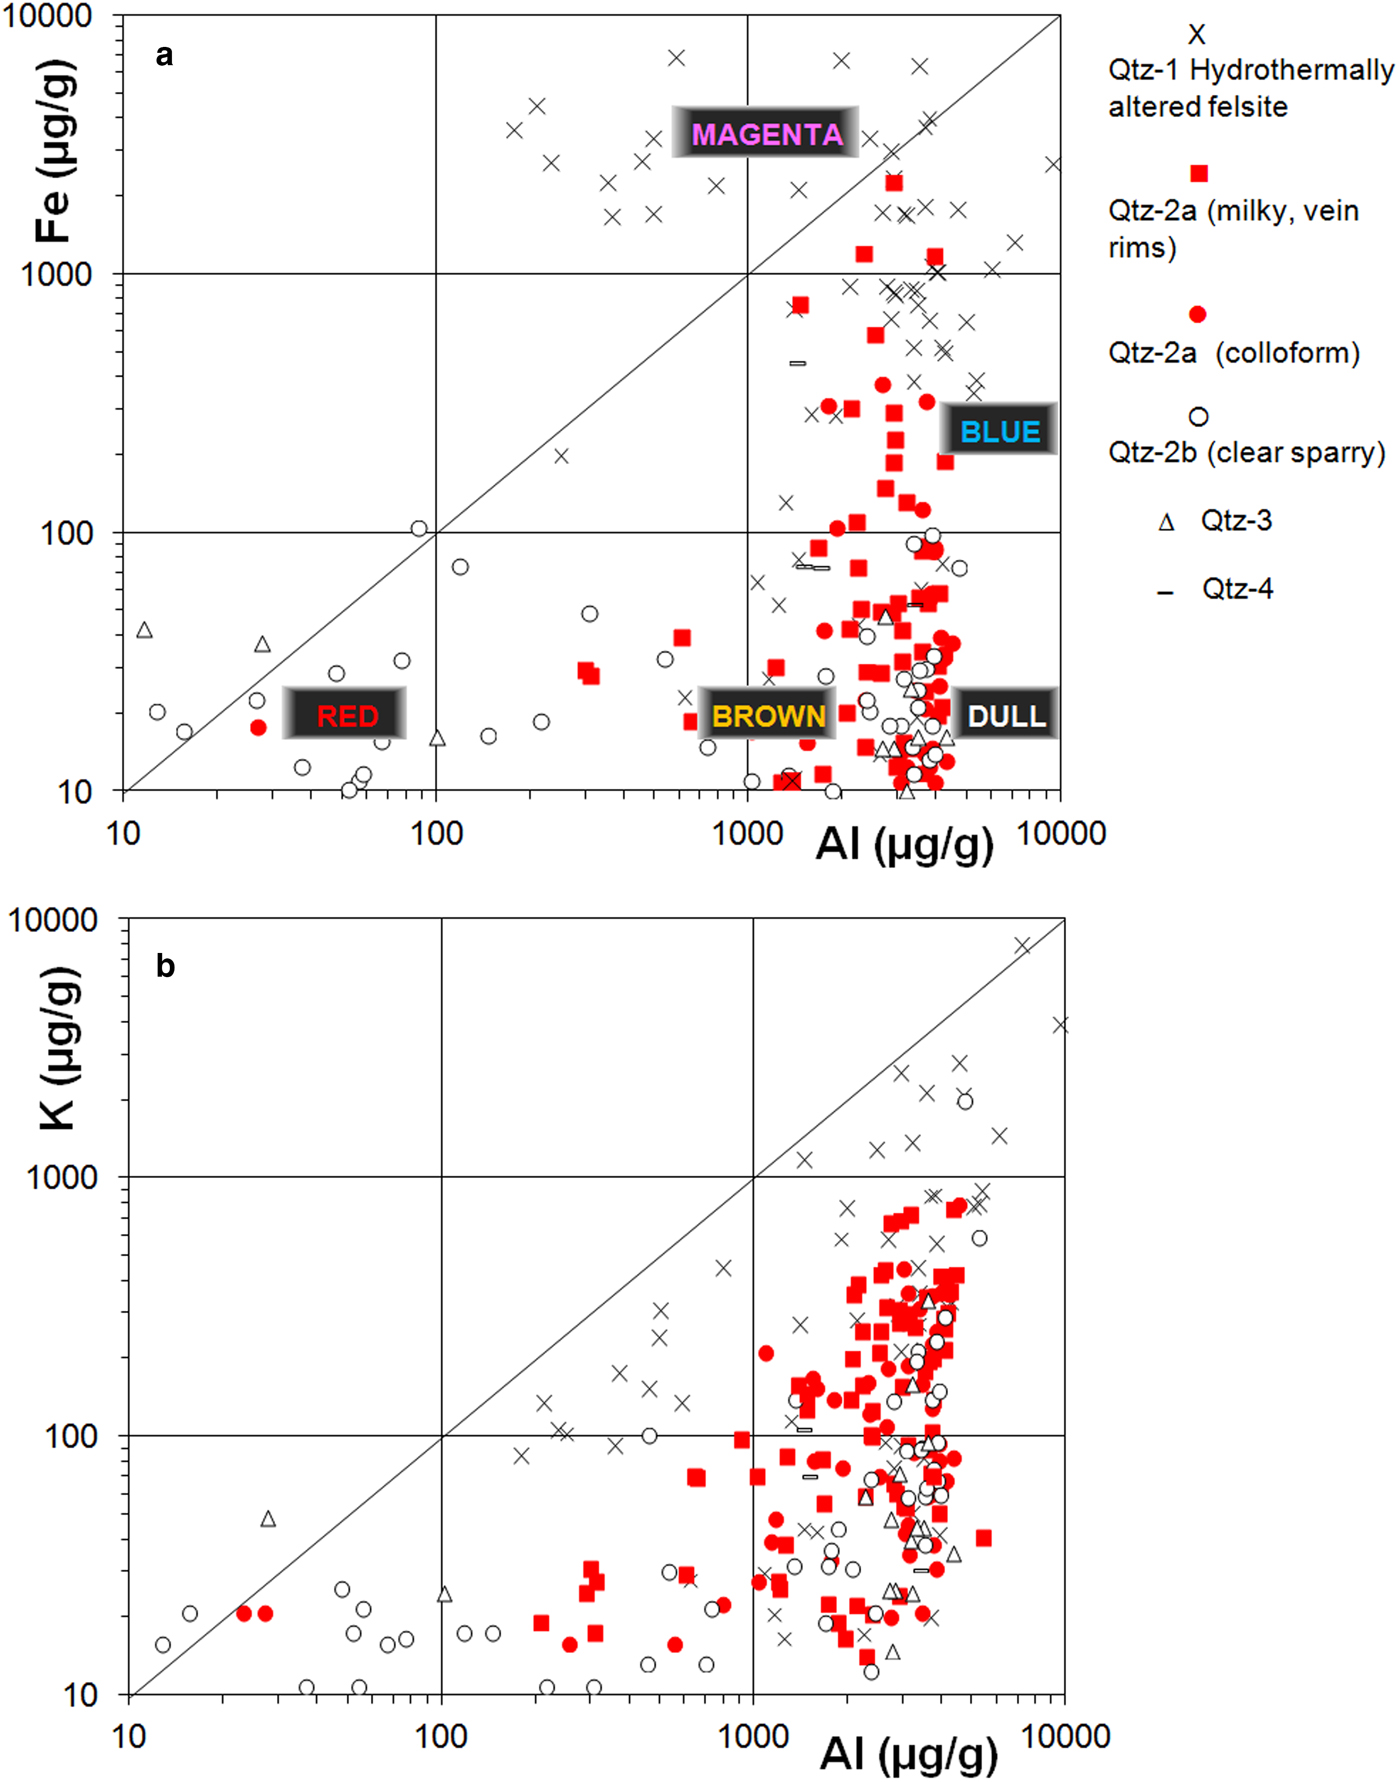
The main trace elements as measured by microprobe analysis are Al, Fe, K and Ti, in order of abundance present in the quartz (Table 1). The ‘impregnating’ Qtz-1 in the hydrothermally altered felsites shows magenta and blue CL and is most impure. Highest concentrations are found for Al and Fe with concentrations typically between 200 and 5000 µg/g and between 10 and 7000 µg/g, respectively. The Fe concentrations partly exceed tenfold the Al content (Fig. 3a), notably in the vicinity of hematite. These data have to be handled with care, because of secondary X-ray fluorescence effects. Empirical experiments (Kronz et al., Reference Kronz, Van den Kerkhof, Müller, Götze and Möckel2012) show that even at distances of 150 µm from an ilmenite-quartz boundary apparent concentrations of up to 150 µg/g are found in the quartz. Thus, Fe values above 300 µg/g Fe in Qtz-1 may be related to secondary fluorescence. On the other hand, for Al, the radius of a secondary fluorescence is much smaller and no correlation between phase-boundaries and Al-concentration can be found. The Al-concentrations are particularly high for the milky and colloform Qtz-2a, associated with the PGE minerals. These high contents give reason to assume that these elements are not only structurally incorporated, but also as impurity clusters or inclusions (Müller, Reference Müller2000, and references therein). Quartz with Fe content above ~300 µg/g shows typically magenta (pink) CL, whereas blue CL can be observed for quartz with lower Fe, but about the same Al contents. The transitions between the different CL colours are gradual. Variable Fe content within the quartz grains is assumed to cause the typical patchy blue-magenta CL observed for Qtz-1. The red part of the magenta CL emission can be ascribed to trivalent Fe in the quartz lattice (Müller, Reference Müller2000), but the origin of the blue CL has not been traced accurately. Together with other trivalent ions (Al3+, Cr3+), Fe3+ may substitute for Si4+ with compensation of monovalent cations like Li+, Na+, or K+. The analyses marked by high Fe3+ show also highest K+, suggesting the prevailing combined substitution of these two elements in the quartz crystal structure (Fig. 3b). The Ti-content is invariably very low (below or just above the detection limit of 6 µg/g, max. ~20 µg/g). No relation has been found between the Ti content and blue CL in the present samples, contrary to findings in the literature for metamorphic or magmatic quartzes.
Trace-element composition of quartz from hydrothermally altered felsite (Qtz-1), early vein quartz (Qtz-2a) distinguished in early milky rims and colloform quartz, clear sparry quartz Qtz-2b, cross-cutting Qtz-3 and Qtz-4. (a) Fe-Al plot with indication of the observed CL colours, and (b) K-Al plot.
Representative compositions from electron microprobe analyses of Qtz-1 to Qtz-4 from the Waterberg platinum deposit.

n = number of analyses
n.d. – not detected
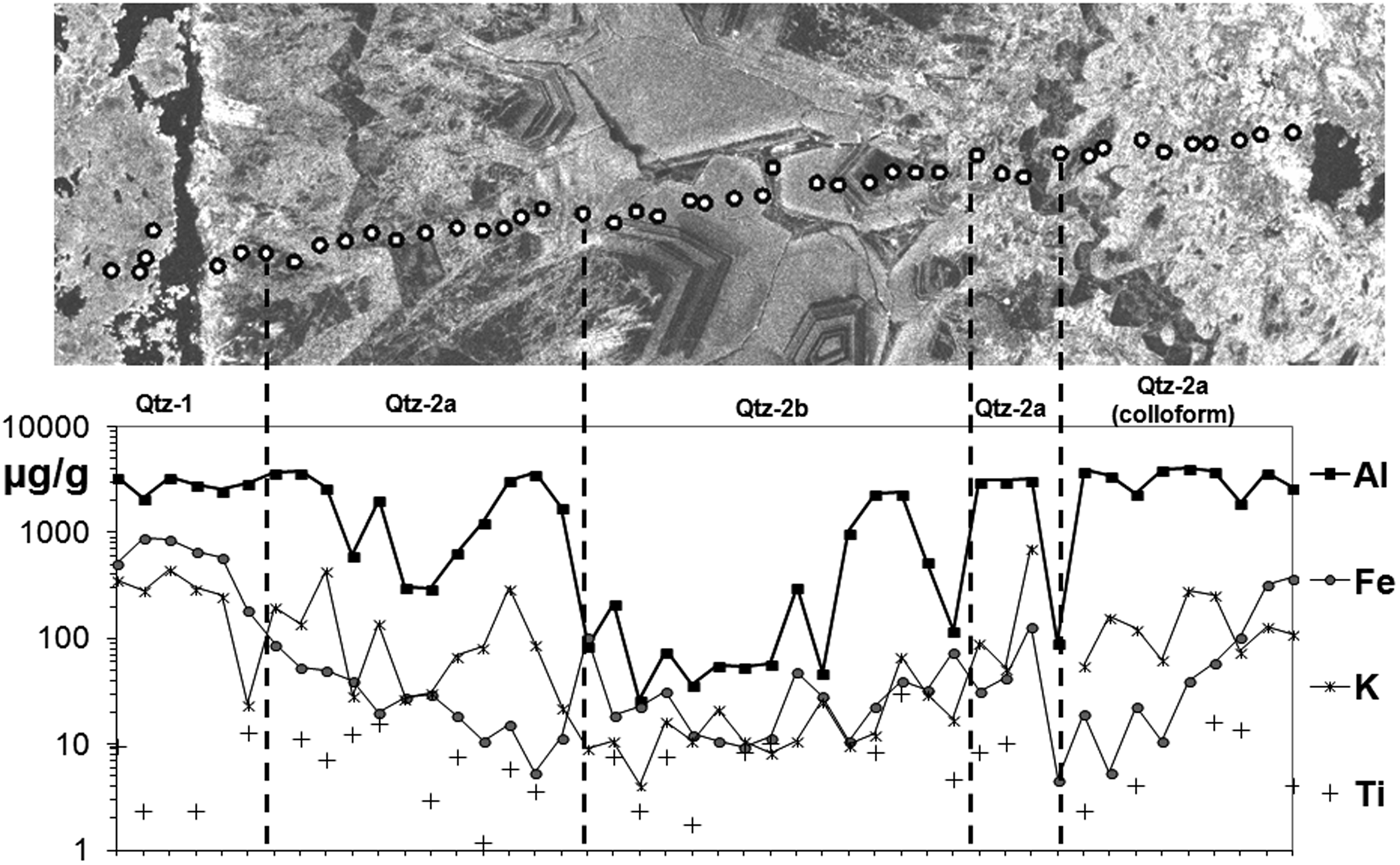
The first stage of hydrothermal quartz growth (Qtz-2a) includes the PGE mineralization and is characterized by milky quartz which shows (1) botryoidal, colloform forms, or (2) sparry quartz crystals with cloudy inclusion patterns, indicating growth zoning. Fe concentrations typically decrease from levels comparable with Qtz-1 towards levels around the detection limit in the growth direction, whereas Al remains very high in Qtz-2a (Fig. 4). In this zone, CL colours grade from magenta (close to Qtz-1) towards blue and subsequently red CL. The Qtz-2a with blue CL forms the rims of hydrothermal quartz veins, whereas the central parts of the veins (Qtz-2b) consist of clear comb quartz showing growth zoning in red, reddish brown and non-luminescent quartz. This reddish/brown luminescence colour is clearly distinct from the magenta observed for Qtz-1 (Fig. 2). This can be probably explained by the somewhat lower excitation wavelength (~635–650 nm) caused by non-bridging oxygen hole centres in the quartz structure of Qtz-2, compared to the Fe3+-related defect (~750 nm) (Stevens-Kalceff, Reference Stevens-Kalceff2009) in Qtz-1, both lines being combined with blue emissions. The Al concentrations for Qtz-2b vary greatly from levels around the detection limit (~10 µg/g) up to ~5000 µg/g, i.e. comparable with Qtz-1. Although Al in lower concentrations is known as an activator element (blue CL), it functions as a CL-quencher at very high concentrations. In other words, the blue CL intensity increases to a maximum with higher Al concentrations and then decreases. The dull (virtually non-luminescent) CL can be therefore explained as a result of self quenching (Müller, Reference Müller2000). The inverse relation between Al concentration and CL intensity was described also by Rusk et al. (Reference Rusk, Lowers and Reed2008) for low-temperature quartz. These authors assume that the strong variation in Al does not demonstrate temperature fluctuations, but merely fluctuations in pH, provided that the solubility of Al is higher in solutions with lower pH. The quartz with dull CL correlates with highest Al concentrations, whereas bright red CL was found for the purest quartz. The red CL is assumed to be caused by hydroxyl groups as precursors of non-bridging oxygen hole centres in the quartz lattice; no correlation with trace elements has been recognized. Concentrations of Fe and K mostly fall below 50 µg/g and 30 µg/g, respectively (Fig. 4). Sometimes the central parts of the veins are enriched in K.
Trace-element profile crossing Qtz-1, Qtz-2a and Qtz-2b in SEM-CL. Highest trace-element concentrations are found for Qtz-1. Note that Al, Fe and K concentrations drastically decrease towards the centre of the Qtz-2 vein.

Sparry quartz Qtz-3 shows growth zoning with bright red CL and non-luminescent cores (Fig. 2e). The chemical fingerprint is essentially identical with Qtz-2b, i.e. highly varying Al (10–4500 µg/g) and relatively low Fe (<50 µg/g) concentrations. The quartz with bright red CL displays the lowest trace-element concentrations, whereas the non-luminescent quartz displays very high Al (2700–4330 µg/g). K is variable between the detection limit of 7 µg/g and ~340 µg/g.
Qtz-4 veinlets contain sparry quartz crystals with growth zoning in brown and dull CL. Aluminium concentrations are also high (ca. 1500–3400 µg/g), i.e in the same range as for Qtz-2a, whereas Fe and K are both below ~75 µg/g. These very thin veinlets are less differentiated compared to Qtz-2-3; the late-stage quartz with low trace elements did not develop here. On the other hand, Fe contents were found to be high in thin veinlets cross-cutting felsic quartzite, showing that the large variability in Fe must be diffusion-controlled.
LA-ICP-MS analysis
The abundance of mineral and fluid inclusions largely restricts the application of LA-ICP-MS for quartz analysis. In effect, we cannot clearly distinguish between trace elements in quartz and inclusions. Table 2 lists the ‘best’ mean trace-element concentrations as calculated from visibly inclusion-free measurement spots. However, the high variability for most of the elements within each of the quartz types points at the presence of optically invisible impurities. We investigated the results by statistical methods in order to group elements with similar chemical behaviour. Based on factor analysis (StatSoft Statistica 10.0 ™ software), the measured elements can be subdivided into elements showing factor loading <0.7 and factor loading >0.7. The latter elements are characterized by larger systematic variability, which is assumed to reflect distinctive underlying processes. The elements showing significant variability fall into 3 groups:
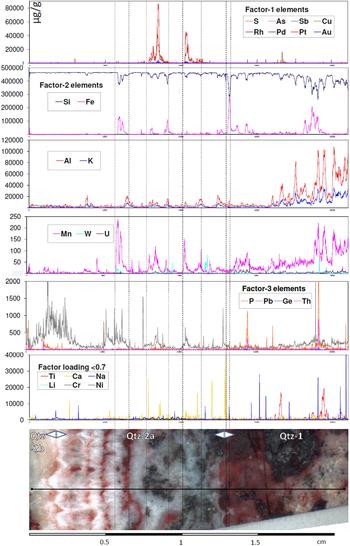
(1) Elements related to PGE minerals (factor 1): Pt, Pd, Cu, S, As, Sb and Au. These elements are typical for the mineralization in Qtz-2a, notably the verruciform mineral aggregates described by P. Ramdohr. A laser ablation line analysis crossing successive Qtz-1, Qtz-2a and Qtz-2b show a perfect match of these elements corresponding to the mineralization within Qtz-2a (Fig. 5). The line crosses a typical verrucous texture rich in PGE minerals.
(2) Elements related to silicate minerals and oxides (factor 2): Al, Fe, Mn, K, W, U and Si. The variation of these elements is mainly due to inclusions of Fe-oxides, rutile, kaolinite and mica, which are abundant mainly in Qtz-1.
(3) Elements related to phosphates (factor 3), like monazite: P, Th and Pb.
LA-ICP-MS analysis along a line crossing Qtz-2b (banded, left), Qtz-2a and Qtz-1 (right), including ore minerals (sample Waterberg C-8185a). Note the verrucous texture in Qtz-2a filled with PGE minerals. The elements are grouped in elements showing factor loading >0.7 (factor 1, 2, 3) and factor loading <0.7 (non-systematic variability).

LA-ICP-MS analyses of Qtz-1 to Qtz-4, selected for visibly inclusion-free measurement spots. Note that for the very thin Qtz-4 veinlets only one ‘pure’ quartz analysis was possible.

n = number of analyses; n.d. = not detected (below detection limit)
Elements showing non-systematic variability (factor loading <0.7) are found as trace elements in impure quartz, fluid inclusions, or reflect numbers below the detection limit. These elements include Ca, Na, Li, Ti, Cr, Ni and Cl, and are assumed to be highly mobile at high temperatures.
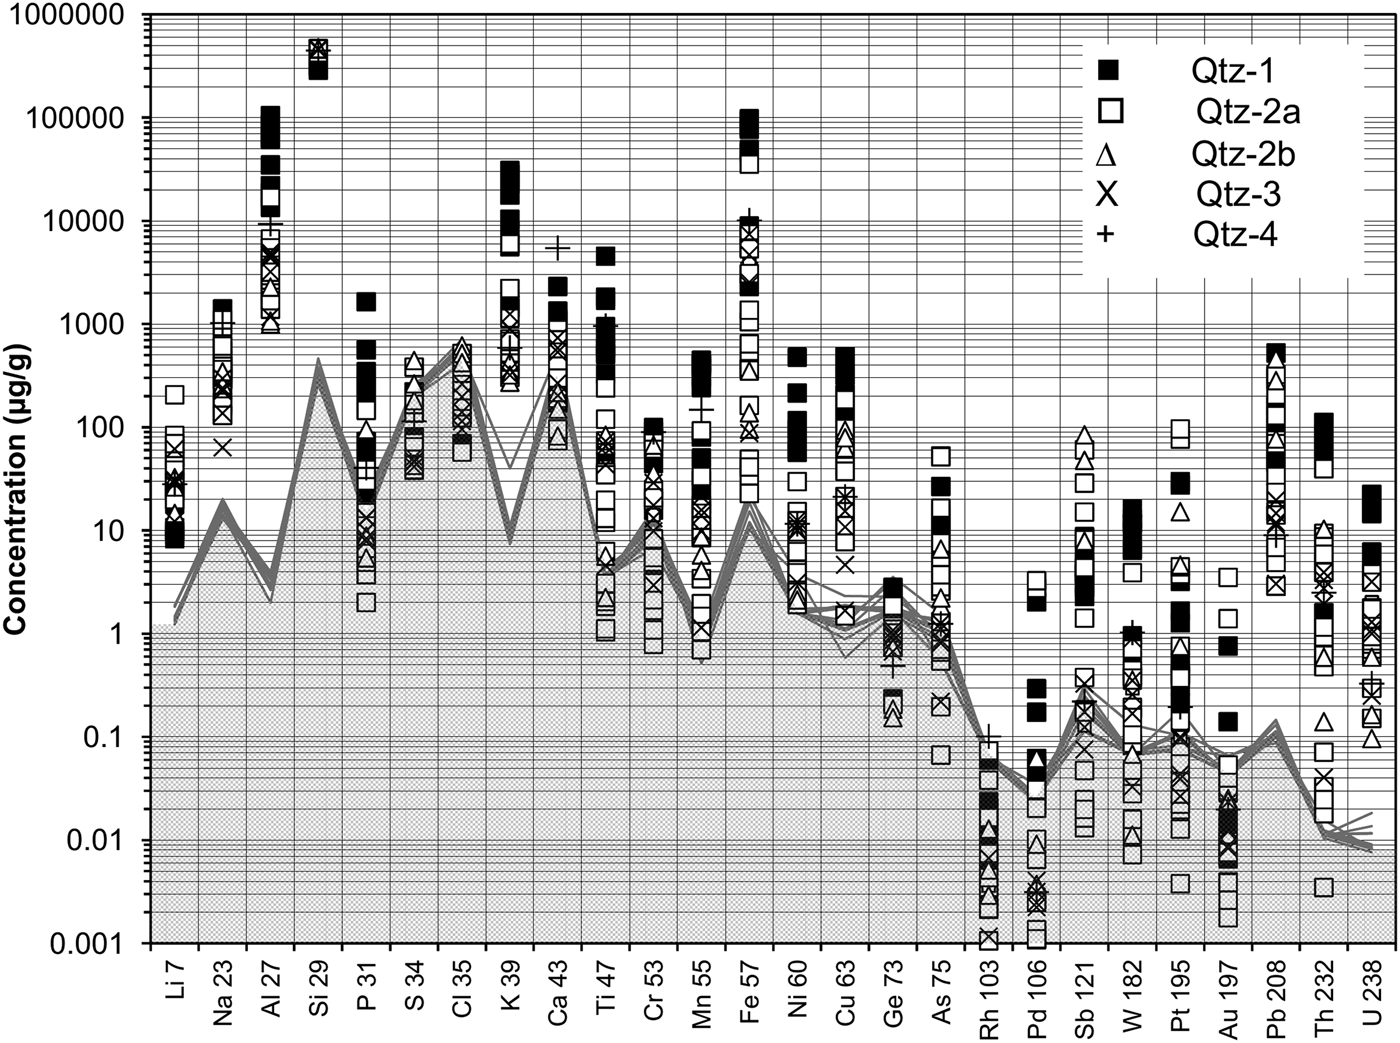
In order to obtain best trace-element analyses of ‘clean’ quartz, i.e. without mineral inclusions, we selected parts of measured lines showing a stable signal (Fig. 6). All trace elements show concentrations well above the detection limits with exceptions for Au, Pt, W, Pd, Cr, Ti and P. Notably for Qtz-1 the main trace-element concentrations (Al, Fe, K, Ti) as measured with EPMA are mostly higher for the LA-ICP-MS measurements, which indicates that submicroscopic mineral inclusions like Fe-oxides, rutile and muscovite must be present even in the selected ‘clean’ quartz. The LA-ICP-MS analysis of selected pure quartz clearly shows higher trace-element concentrations for Qtz-1, except for Li which is typically higher in the hydrothermal quartz veins (Fig. 7). Also Pb has been found high in the hydrothermal quartz with concentrations up to 460 µg/g and sometimes showing zoning in Qtz-2a (Fig. 6).
LA-ICP-MS analysis of Qtz-1 to Qtz-4 (in μg/g). The compositions are calculated means of ‘clean’ quartz as determined from line measurements. The grey line denotes the detection limit calculated as the equivalent of three times the standard deviation of the background.

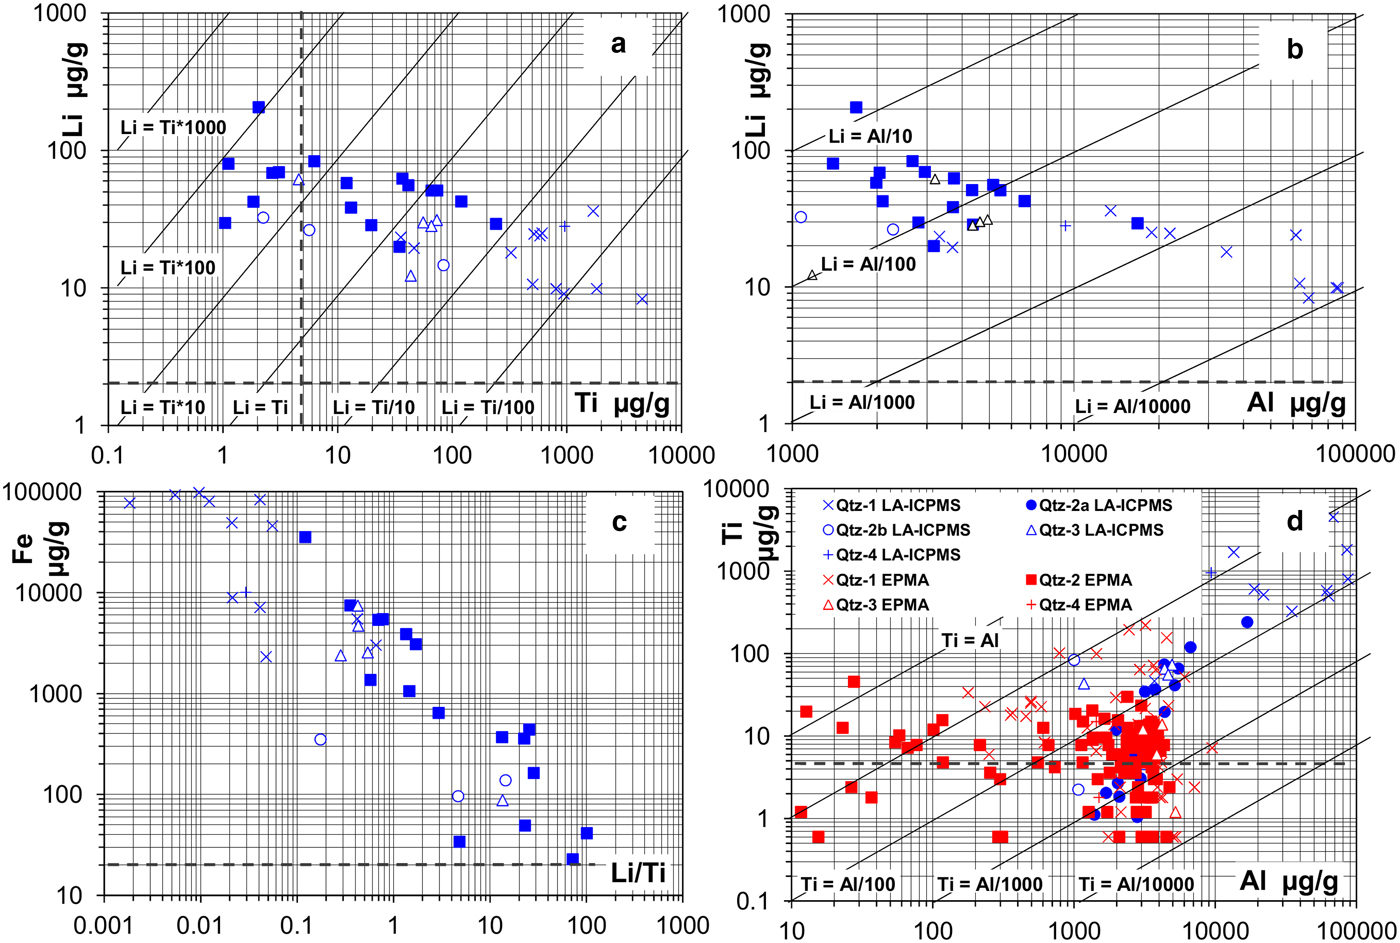
Variation plots of trace elements in quartz. (a) Variation plot of Li vs. Ti in ‘clean’ quartz; (b) Variation plot of Li vs. Al. (c) Variation plot of Fe vs. Li/Ti. (d) Al/Ti ratio vs. Al concentrations as measured by EPMA and LA-ICP-MS. Note higher Al and Ti values for LA-ICP-MS analysis in Qtz-1 due to mineral inclusions like rutile and mica.

Besides the differences in Al and Fe as demonstrated by EPMA, Ti and Li are most distinguishable elements for the different quartz types (Fig. 7): whereas high Ti and low Li is typical for Qtz-1 in the felsite, the hydrothermal quartz is characterized by high Li and low Ti. High Li of up to ~100 µg/g were measured for vein quartz, whereas Li always remains below 30 µg/g in Qtz-1. The Li/Ti ratio strongly varies between ~0.002 and 100. The trace elements in the thinner quartz veinlets (Qtz-3 and Qtz-4) follows opposite trends towards higher Ti and lower Li, and must have been affected by the country rock.
Remarkable is the difference in Ti content for both impure Qtz-1 and Qtz-2a: The ore minerals in Qtz-2a are practically free of Ti, whereas Ti is relatively high in the hematite-rich parts of Qtz-1. However, the quartz directly adjacent to Qtz-1 shows elevated Ti levels probably due to diffusion after quartz deposition. Under CL these zones are distinguished by wafts of bluish CL superimposed on older structures like growth zoning.
The Ti-in-quartz thermometer (Wark and Watson, Reference Wark and Watson2006; Thomas et al., Reference Thomas, Watson, Spear, Shemella, Nayak and Lanzirotti2010; Huang and Audétat, Reference Huang and Audétat2012) can be applied only to the quartz with highest Ti concentrations, i.e. Qtz-1 and Qtz-2a (Fig. 7d). Titanium measured with LA-ICP-MS is significantly higher compared to the same recordings made by EPMA, indicating possible submicroscopic rutile inclusions in Qtz-1. Due to the low concentrations, the Ti-in-quartz thermometer cannot be applied to the hydrothermal quartz using the results from EPMA. A few analyses of higher Ti values suggest that the felsite contains relic high-temperature magmatic quartz (high Ti), impregnated and partly replaced by hydrothermal quartz (low Ti). Apparent high Ti concentrations in the vicinity of opaque phases might also be a result of secondary X-ray fluorescence, where apparent concentrations of 200 µg/g can be detected even at distances of 60–80 µm from the rutile in the quartz (Wark and Watson, Reference Wark and Watson2006; Kronz et al., Reference Kronz, Van den Kerkhof, Müller, Götze and Möckel2012).
Oxygen isotope (δ18O) compositions
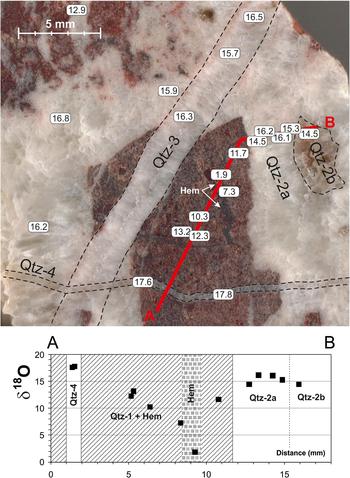
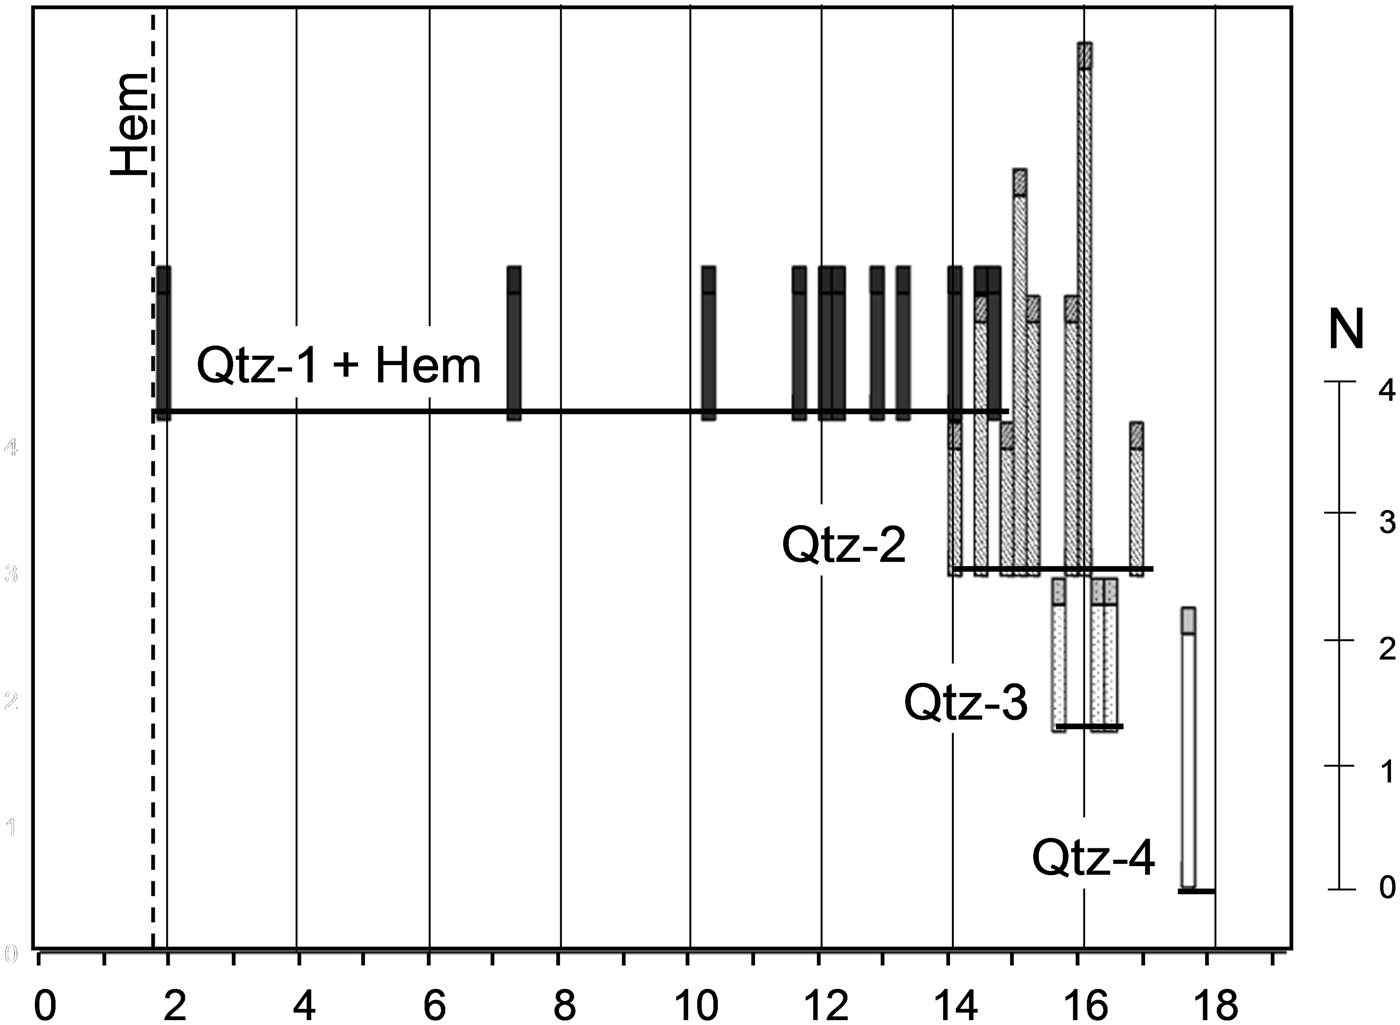
All quartz generations were analysed. Hematite-bearing Qtz-1 shows a large range of δ18O (VSMOW) values for mixed quartz-hematite, namely between 1.8‰ for hematite, and ~14.6‰ for virtually inclusion-free quartz (Fig. 9). ‘Pure’ Qtz-1 is best characterized by δ18O between ~10 and 14.6‰ at maximum; all lower values are probably caused by various amounts of hematite. The isotopic compositions of the vein quartz are systematically higher, namely 14.0–16.8 (mean 14.7‰) for Qtz-2, 15.6–16.4 (mean 16.1‰) for Qtz-3, and ~17.6‰ for Qtz-4 (Figs 8 and 9). The higher δ18O for the later quartz generations can be explained by quartz precipitation during cooling of the system with assumed isotopic equilibrium between quartz and hematite. By assuming isotopic equilibrium of the system quartz-hematite and applying the thermometer of Zheng and Simon (Reference Zheng and Simon1991) formation temperatures above ~380°C are indicated for Qtz-1, whereas the main quartz phases Qtz-2 and Qtz-3 formed between ~370 and 330°C, respectively. Qtz-4 precipitated at ~295°C.
δ18O measurements in sample ‘F’ containing Qtz-1, Qtz-2a, Qtz-2b, Qtz-3 and Qtz-4. Data plotting along the profile line A–B are shown in the plot below. Note that Qtz-1 contains pure hematite crystals.

Bar plot showing oxygen isotope composition of Qtz1–4. Note that the values for Qtz-1 represent mixtures for quartz and hematite inclusions.

Fluid-inclusion study
Brines of dominantly H2O–NaCl–CaCl2 composition occur exclusively in Qtz-1, whereas aqueous inclusions of simpler, H2O–NaCl-dominated composition are present in all quartz generations. The size of the inclusions, defined as the mean of the inclusion length and width, varies between ~1 and 50 µm, but 95% of the inclusions fall in the 1 to 17 µm range with a mean of ~7 µm. Many of the brine inclusions in Qtz-1 tend to be smaller and are mostly ~4 µm. The aqueous inclusions contain a vapour bubble and occasionally also halite (L + V or S + L+V), or they contain only L or L + S, i.e. without a bubble, representing late high-density fluids (in part metastable ‘stretched fluids’).
Qtz-1
The complex brine H2O–NaCl–CaCl2 inclusions occur in growth zones, along short intragranular trails, and in clusters. Fluid inclusions typically show negative crystal shape. The inclusions show water volume fractions (vol. fracs.) of 40–90%. Although the inclusions may have been modified locally, the primary character of the inclusions (e.g. occurrence in growth zones) is largely retained. The inclusions contain saline solutions and occasionally salt crystals (Fig. 10a). The aqueous H2O–NaCl inclusions show highly variable water vol. fractions of 20–90%. Some inclusions contain halite and sometimes other unidentified daughter phases. The fluid-inclusion morphology varies greatly from regular to irregular.
Microphotographs of fluid inclusions. Left: high-salinity inclusion in Qtz-1 showing Te = –80°C; TmIce= –24.9°C; TmHH= +4.8°C; Th(L) = +139°C. Right: low-salinity inclusion in Qtz-2 showing TmIce = –3.9°C; Th(L) = +132°C. L = liquid; V = vapour; H = halite; S = solid; Ms = muscovite.

Qtz-2 to Qtz-4
Aqueous inclusions, both with and without solid phases, are present. They mainly form clusters and trails and contain one or two fluid phases at room temperature, with highly variable water vol. fractions of >20%, showing evidence of partial leakage. The inclusions in Qtz-2 typically occur along growth zones and intragranular trails with preferred crystallographic orientation. Aqueous inclusions in Qtz-2 frequently contain fibrous muscovite (Fig. 10b), identified by Raman spectroscopy. However, the most common daughter phase is halite (and possibly also sylvite).
Microthermometry of H2O–NaCl–CaCl2 in Qtz-1
The brine inclusions show complex phase behaviour during cooling and heating runs (see also Zwart and Touret, Reference Zwart and Touret1994; Goldstein and Reynolds, Reference Goldstein and Reynolds1994). Two-phase (L + V) H2O–NaCl–CaCl2 inclusions typically freeze around –80°C. Higher freezing temperatures of ca. –65°C or ca. –57°C were also observed. After freezing hydrohalite (HH), antarcticite (AA), and ice (Ice) are the stable solid phases. On subsequent warming we observed first melting (melting of antarcticite) between –46 and –42°C, i.e. at some degrees higher than the theoretical eutectic temperature of the H2O–NaCl–CaCl2 system at –52°C (Te). After first melting crystals of hydrohalite, ice, and a vapour bubble can be distinguished. Hydrohalite melts at temperatures between –33 and –20°C (TmHH) and subsequently ice melts between –22 and –2°C (TmIce). Final homogenization into the liquid phase was measured between 82 and 211°C (Th). The complete sequence of phase transitions can be written as follows:
 $$\eqalign{&{\rm AA} + {\rm HH} + {\rm Ice} + {\rm V \to HH} + {\rm Ice} + {\rm L} + {\rm V \to Ice} \cr & + {\rm L} + {\rm V \to L} + {\rm V \to L}}$$
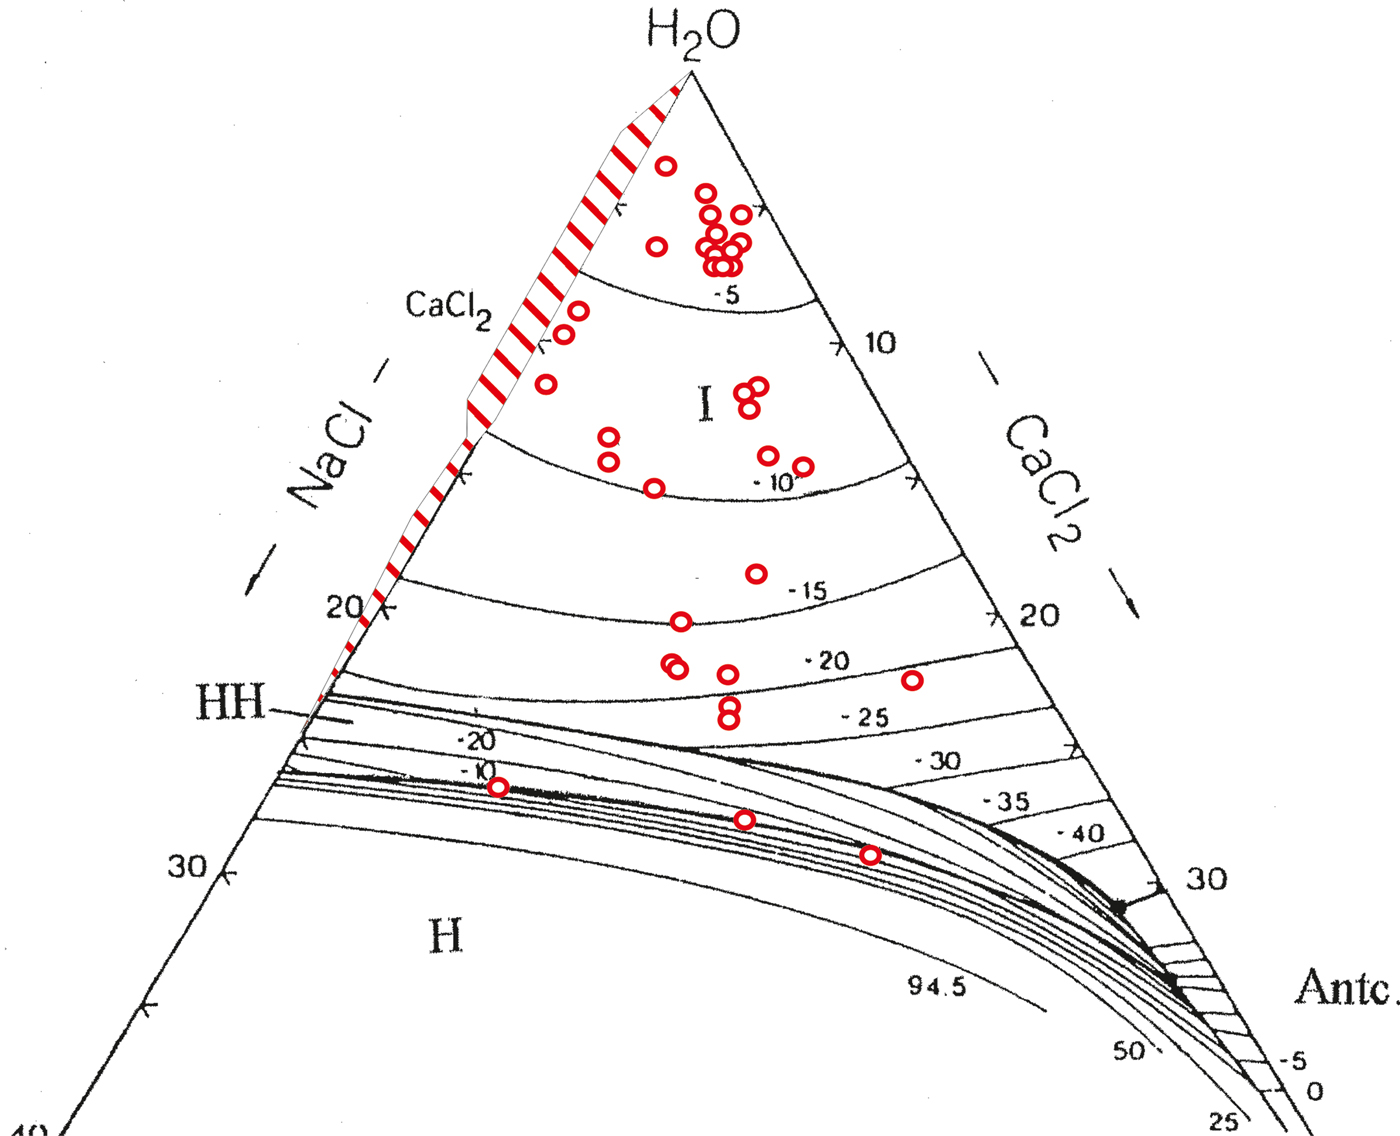
Accordingly, the successive phase transitions TmAA, TmHH, TmIce and Th can be observed for these inclusions. Bulk fluid compositions can be estimated by plotting phase transitions in a diagram for H2O–NaCl–CaCl2 (Fig. 11).
The ternary system H2O–NaCl–CaCl2 with plotted ice and hydrohalite melting temperatures. Red dots denote ternary fluid compositions for fluid inclusions in Qtz-1; dashed range denotes binary H2O–NaCl mixtures in Qtz-1 and Qtz-2.

Inclusions containing one or two daughter crystals (S + L+V) at room temperature show somewhat more complicated phase transitions than described above. At least one daughter crystal could be identified as halite (idiomorphic cubes, isotropic). Halite (H) is in theory not present in the stable eutectic point and should react to hydrohalite. However, this hydration reaction is very sluggish and therefore hardly effects the phase transitions (non-equilibrium melting). In one inclusion (S + L+V), however, we observed first melting at very low temperatures (ca. –80°C), which may indicate melting in the metastable eutectic point.
The phase transitions of saturated H2O–NaCl–CaCl2 fluid inclusions can be described as:
 $$\eqalign{&{\rm AA} + {\rm HH} + {\rm Ice} + {\rm V}\left( { + {\rm H}} \right){\rm \to HH} + {\rm Ice} + {\rm V} \cr & + {\rm L}\left( { + {\rm H}} \right){\rm \to HH} + {\rm V} + {\rm L}\left( { + {\rm H}} \right){\rm \to HH} + {\rm V} + {\rm L} \cr & + {\rm H}_{{\rm react}} \left( { + {\rm} {\rm H}} \right){\rm \to V} + {\rm L} + {\rm H \to L} + {\rm H}({\rm \to L})}$$
In this sequence the ice melts at lower temperatures than hydrohalite. Hydrohalite reacts to form halite (Hreact), which combines into one single crystal. However, the conversion of hydrohalite to halite and vice versa is very sluggish and mostly does not take place, resulting in metastable hydrohalite, which melts at higher temperatures than the stable phases. We observed the melting of hydrohalite between +3 and +11°C, which can be explained only as metastable melting (c.f. Zwart and Touret, Reference Zwart and Touret1994, p.782). At high temperatures L-V homogenization (94–145°C) always took place before the melting of halite. The latter phase transition could not be measured in the present samples due to decrepitation before TmH.
As more than one daughter phase has been observed frequently at room temperature, it is evident that the brines are at least in part more complex and must contain also other salts besides CaCl2 and NaCl. In several inclusions, more than one hydrate could be observed on cooling. Prokof'yev et al. (Reference Prokof'yev, Distler and Yudovskaya2001) reported the presence of Na-K-Ca-Fe chlorides by LA-ICP-MS in samples from the Waterberg deposit. However, these data do not differentiate between fluids, daughter crystals and trace elements in quartz.
Phase transitions in H2O–NaCl inclusions
Inclusions showing simpler phase transitions freeze completely between –40 and –50°C. In case of high water volume fractions, the bubble sometimes disappears on freezing. During subsequent warming principally eutectic melting, ice melting and total homogenization can be observed, i.e. HH + Ice (+ V) → Ice + L (+ V) → L (+ V) → L.
Eutectic melting can be observed between –20 and –15°C, i.e. around or somewhat above the eutectic temperature of the system H2O–NaCl. However, as the eutectic point for inclusions with low salinity can be observed only with difficulty, we assume that NaCl is the dominant salt in all inclusions. In Qtz-1 the inclusions occur together with the complex brines and can be considered as extremely NaCl-rich end-members (with low salinity) within the same group. The inclusions show salinities between 3 and 23 wt.% NaCl eq. (TmIce between –2 and –21°C) in Qtz-1, whereas in the other quartz types the TmIce is always between –7°C (~10 wt.% NaCl eq.) and 0°C (pure water).
In some inclusions in Qtz-1 and Qtz-2a traces of carbon dioxide could be demonstrated by the stabilization of clathrate hydrate, which melts at temperatures between 5 and 11°C, clustering at 7–8°C. The presence of CO2 could be confirmed by Laser Raman microspectrometry. However, the Raman analyses of vapour bubbles in the brine inclusions showed that CO2 is in low concentrations and extremely rare.
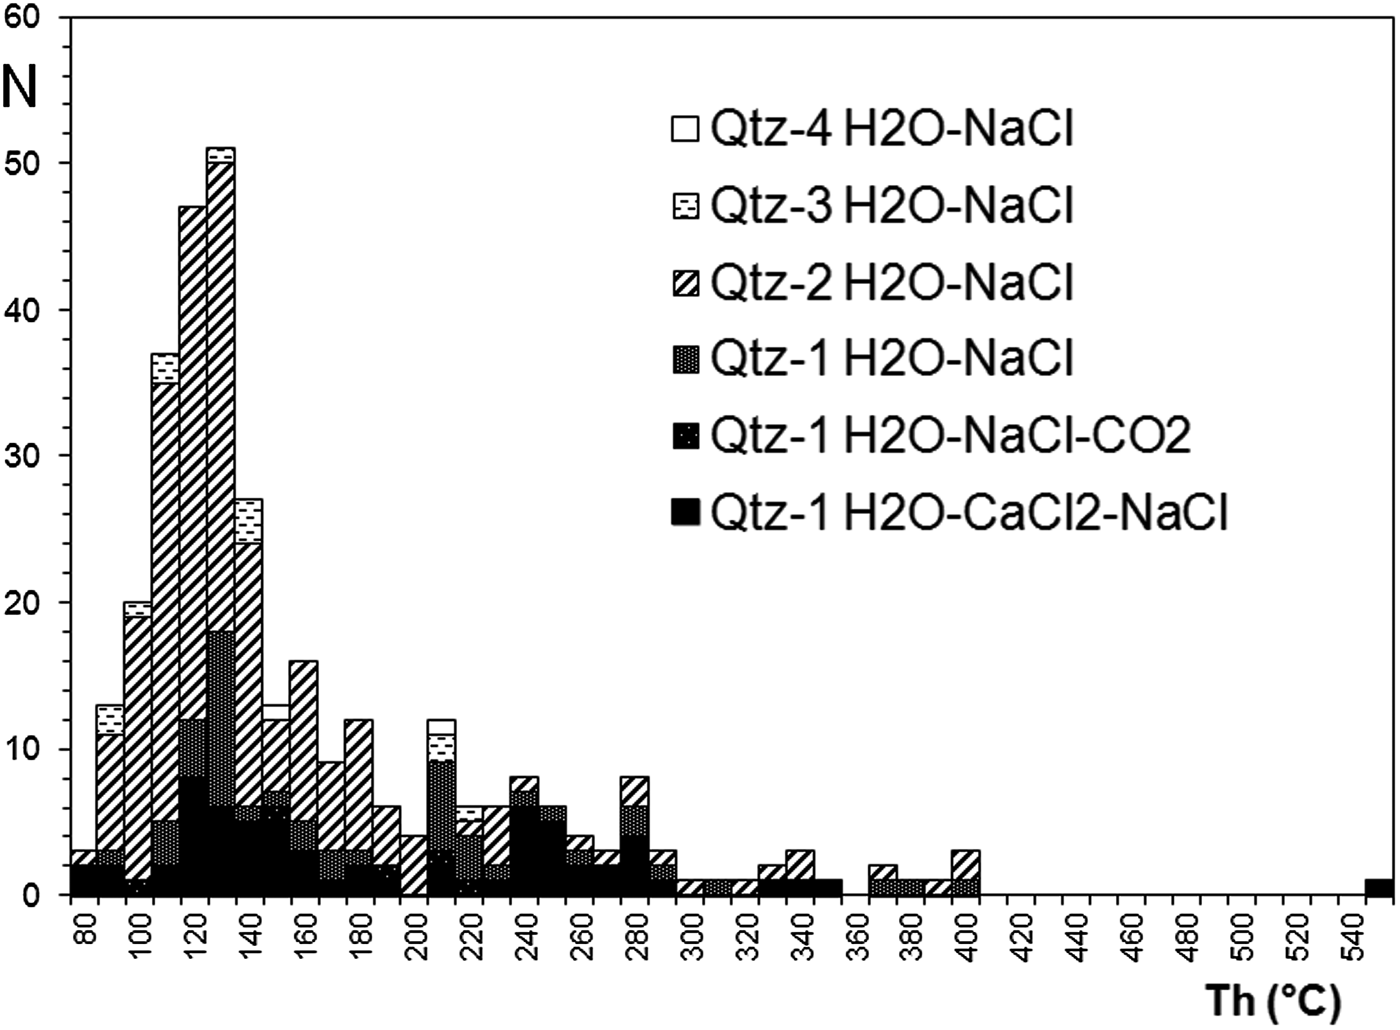
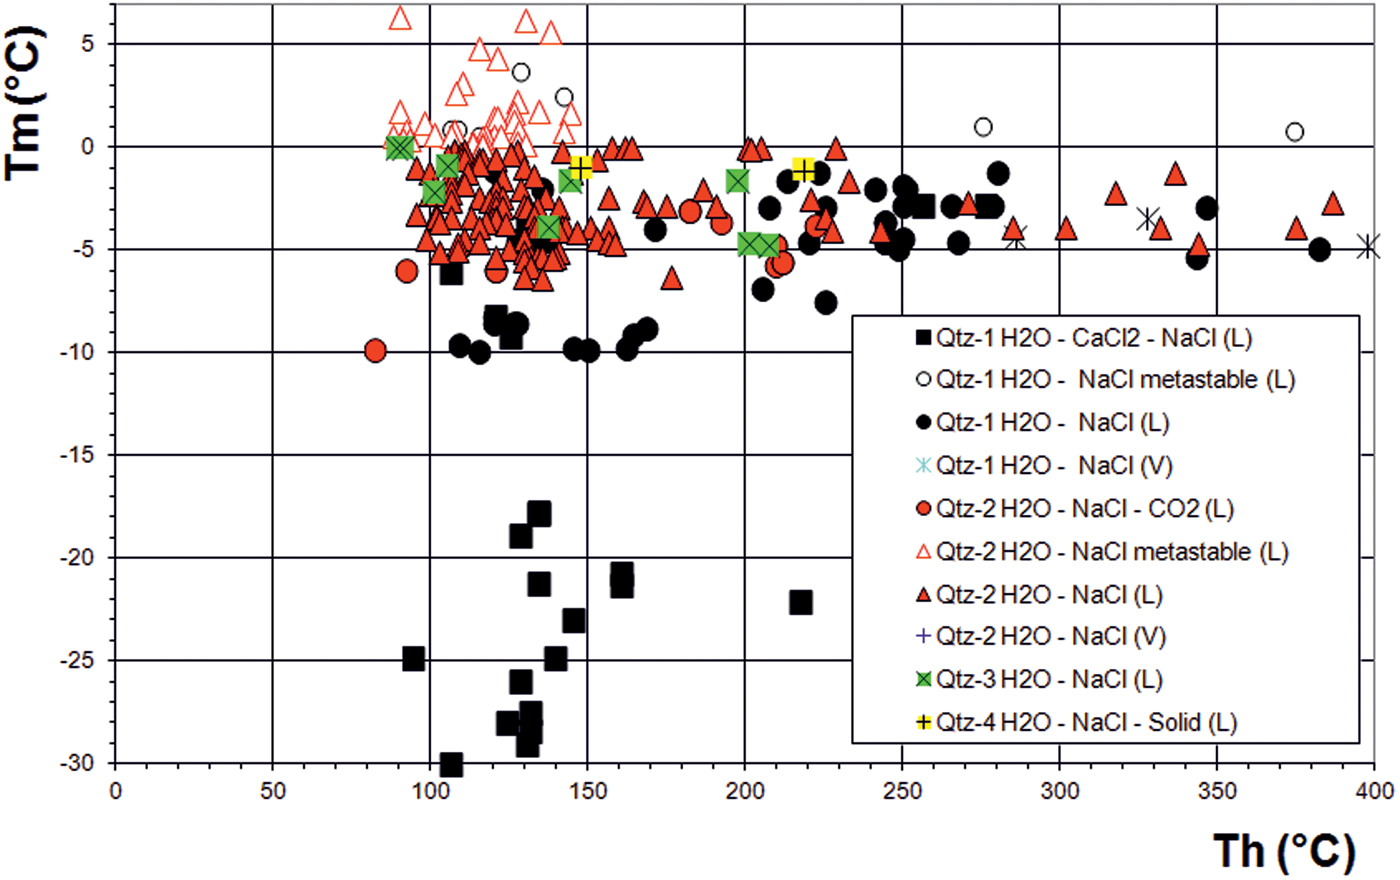
Total homogenization temperatures of the fluid inclusions in all quartz types show a large spread between ~80 and 400°C (Figs 12 and 13) with a frequency maximum at ~120 ± 30°C. Higher homogenization temperatures of ~250 ± 30°C are relatively common in Qtz-1. These data indicate a general reset of the fluid-inclusion densities towards lower temperatures, but fluid inclusions trapped at higher temperatures are somewhat better preserved in Qtz-1. The Tm-Th plot (Fig. 13) shows that fluid inclusion re-equilibration and fluid re-trapping must have occurred in all quartz types without much change of the salinity and under limited mixing between early high-salinity and late low-salinity fluids. The homogenization temperatures are assumed to be representative for fluid trapping and pressure correction negligible as pressures must have been hydrostatic during the vein mineralization (see later).
Histogram showing homogenization temperatures for Qtz-1 to Qtz-4.

Tm-Th plot for fluid inclusions in Qtz-1 to Qtz-4.

Phase transitions in secondary pure water inclusions
Secondary water inclusions are present in all quartz types. They always contain one liquid phase at room temperature and no daughter phases. Sometimes a bubble nucleates on freezing. The corresponding ice melting temperatures (L + Ice → L) are always higher than for ‘normal’ melting and may be as high as + 4°C. Often the bubble nucleates at the temperature of ice melting. This ice melting is metastable and cannot be used for salinity calculations.
Summary of the mineralizing fluids
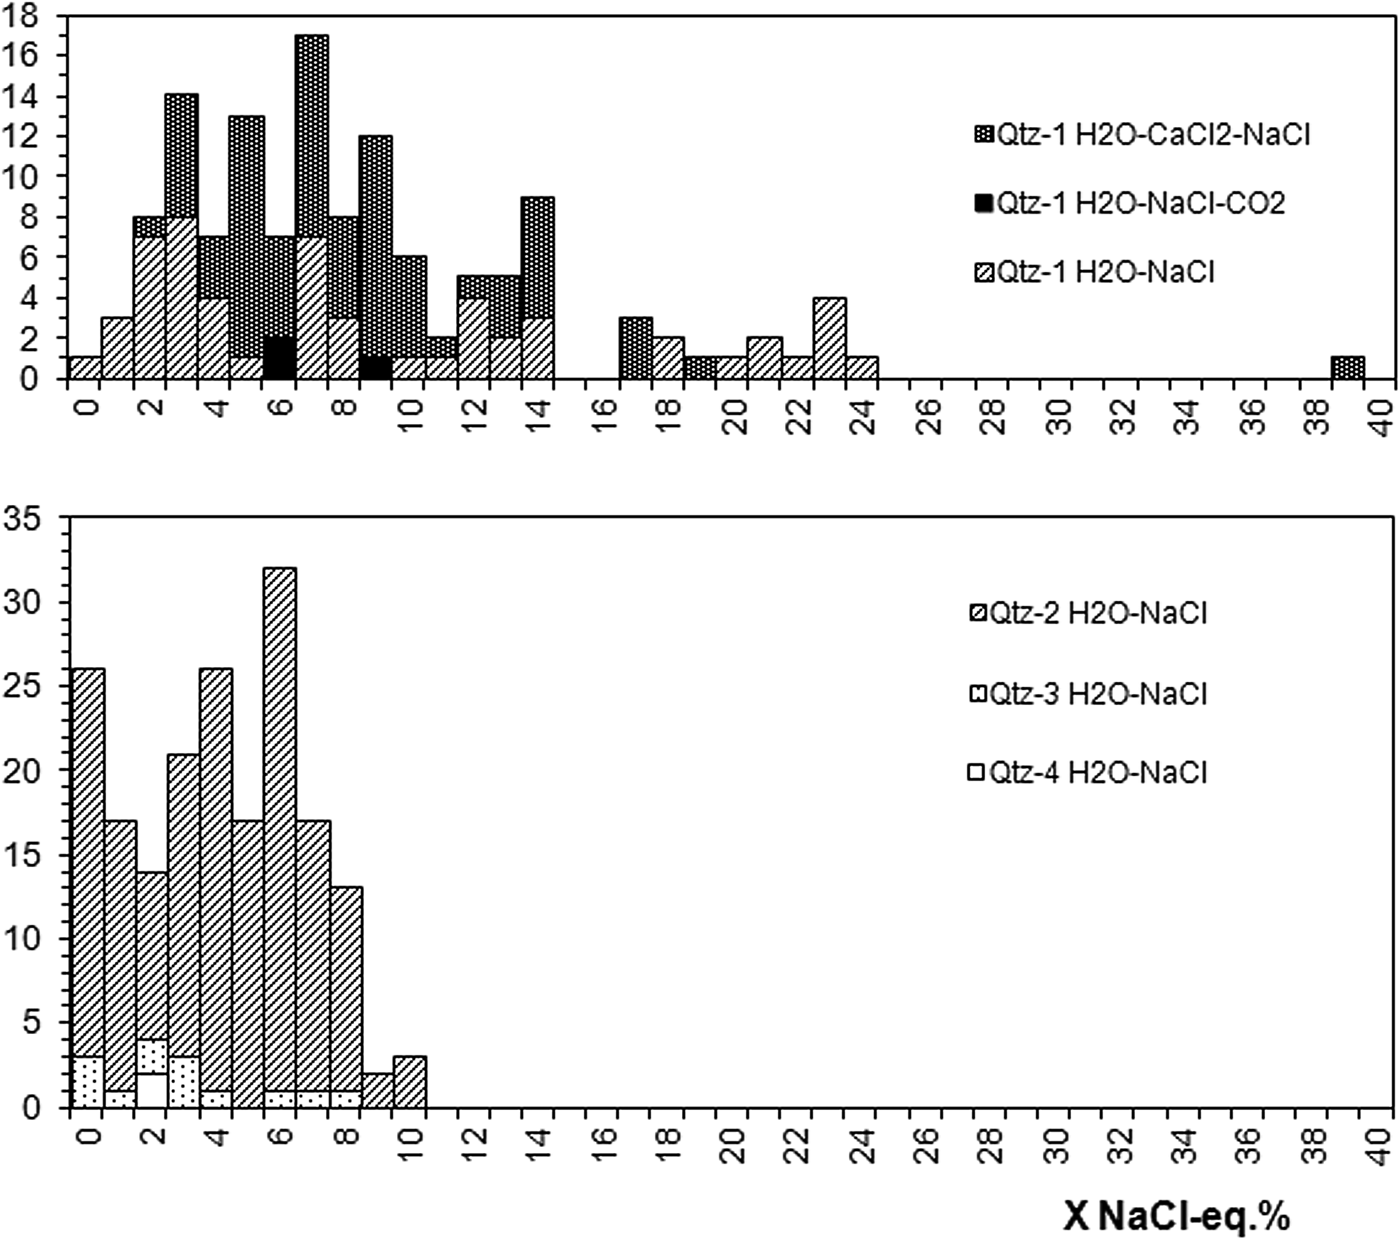
The salinities as calculated from ice melting temperatures show a general tendency from high to low salinity for fluid inclusions in Qtz-1 to Qtz-4 with subsequently fewer daughter crystals (Fig. 14). The fluid inclusions demonstrate three systems of contrasting fluids: (1) complex H2O–NaCl–CaCl2-dominated fluids; (2) H2O–NaCl-dominated fluids; and (3) essentially pure water. These contrasting high- and low-salinity fluid systems confirm the findings of Distler et al. (Reference Distler, Yudovskaya, Prokof'yev, Sluzhenikin, Mokhov and Mun2000) and Prokof'yev et al. (Reference Prokof'yev, Distler and Yudovskaya2001), namely that the inclusions show a wide range of salinity with chlorides and Ca, Na, K and Fe ions. These authors also found that the lowest salinity corresponds to the highest homogenization temperatures and the highest salinity to the lowest homogenization temperatures. In our study we could assign the highest salinity fluids to Qtz-1, patchy quartz impregnating the felsite and predating the main ore mineralization. These early fluids show highest salinity of ~20 wt.% CaCl2 and ~10 wt.% NaCl. On the other hand, the main mineralizing fluid must have been characterized by NaCl preponderance and relatively low salinity (<10 wt.% NaCl, mean ~6 wt%). These fluids are preserved mainly in the Qtz-2 to Qtz-4 veins, whereas in Qtz-1 both fluids are preserved and partly mixed. The PGE mineralization can be related with the earliest hydrothermal stage represented by milky and colloform Qtz-2a along the rims of the veins. This quartz is the main carrier of PGE and other ore-related elements like Au, Cu, As, Sb and S. The mineralizing quartz is characterized by very high Al and varying Fe and K. The latter elements may have been derived from the hydrothermally altered felsite, as the maximum contents are comparable with those found in Qtz-1. Many fluid inclusions contain daughter crystals of hydrothermal phases like muscovite and constrain the pH around 4–5 for the Kfsp-Ms-Qtz assemblage (McDonald et al., Reference McDonald, Ohnenstetter, Rowe, Tredoux, Pattrick and Vaughan1999). The sporadic finding of CO2 in fluid inclusions in Qtz-2a also indicates acidic fluids. During hydrothermal alteration, the original Qtz-1 in the felsite must have been partly replaced. Very high Al has been described for hydrothermal quartz (e.g. Rusk et al., Reference Rusk, Lowers and Reed2008) and assumed to mainly represent Al-rich acidic fluids (low pH). During the later stages of hydrothermal activity, represented by the virtually barren Qtz-2b, Qtz-3 and Qtz-4, much lower levels of Fe and K must have been reached according trace-element analysis.
Histograms showing compiled salinity (NaCl eq.%) for inclusions in Qtz-1 (upper) and inclusions in hydrothermal Qtz-2 to Qtz-4 (lower) as calculated from ice melting temperatures.

Geochronology
Age determination of hydrothermal mineralization is generally, and also in our Waterberg case, hampered by the absence of datable minerals. Therefore, two unconventional methods were tested:
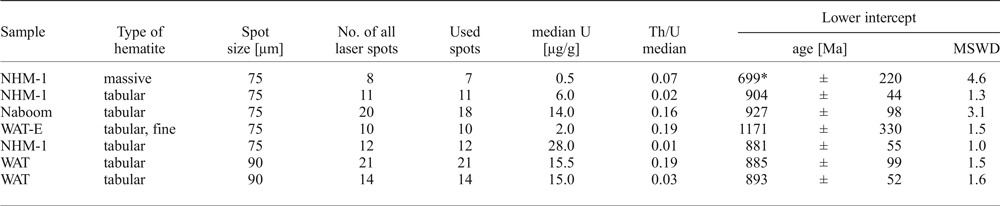
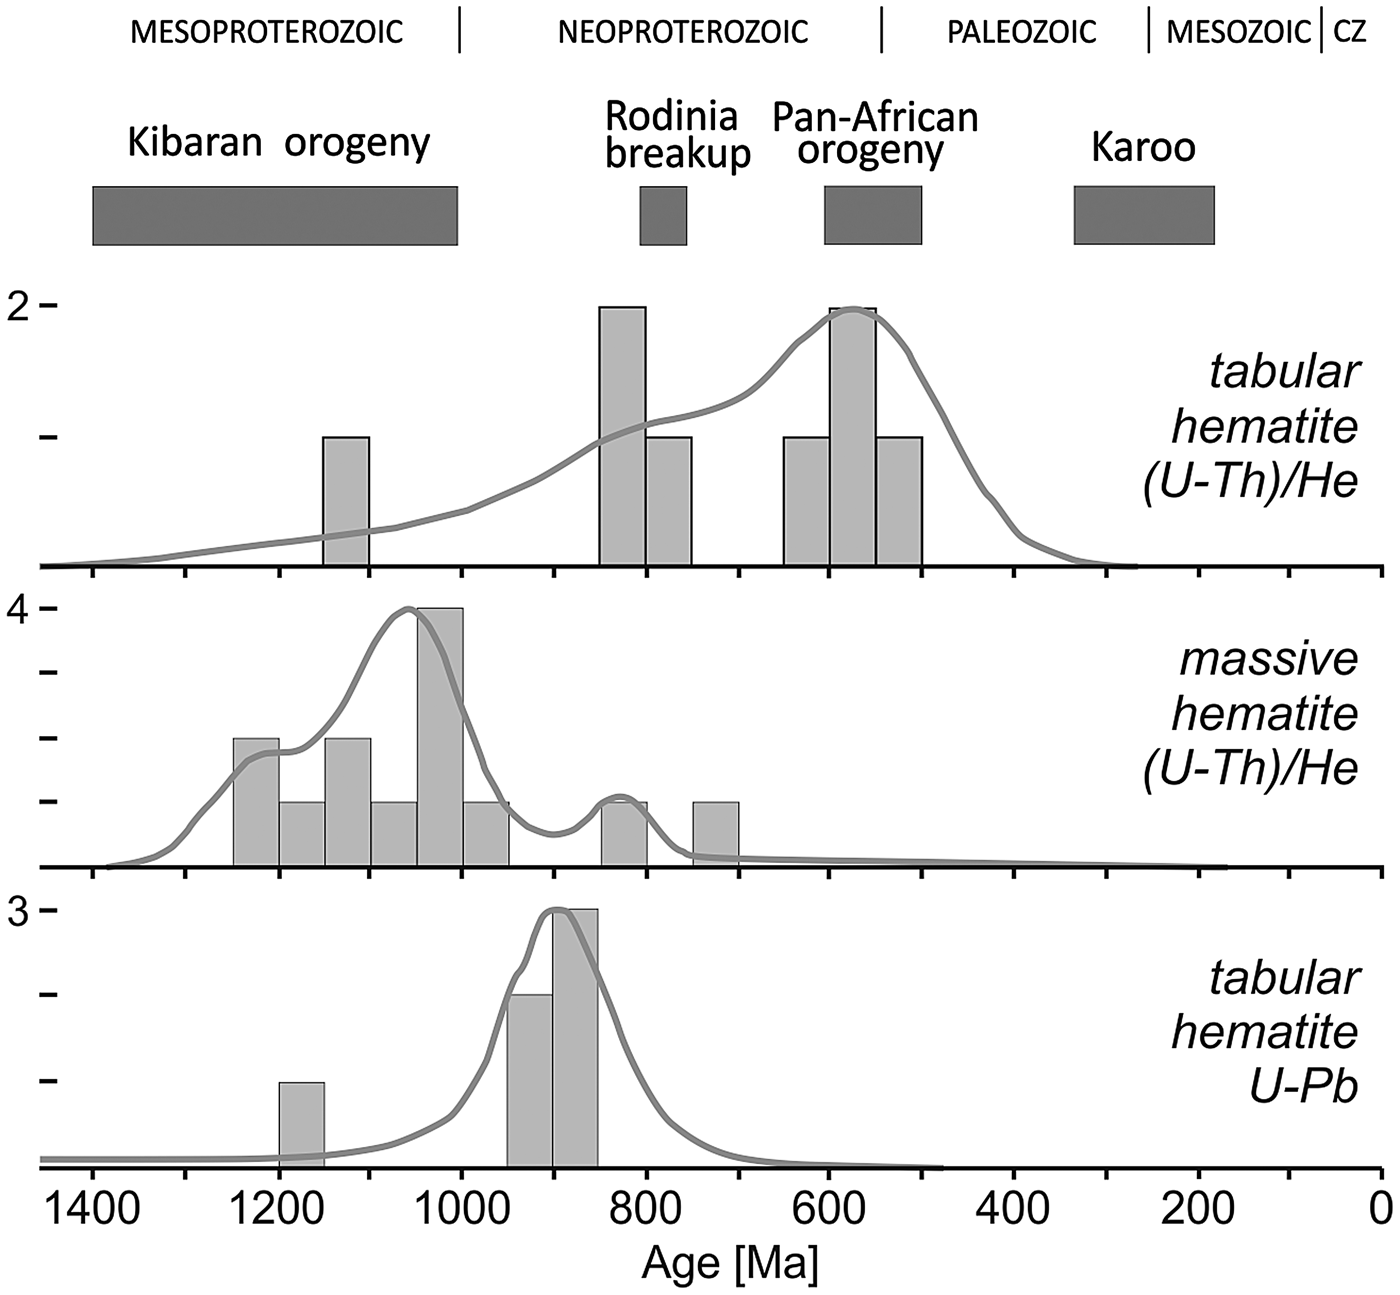
(1) U-Pb dating of hematite: Tabular hematite and massive, fine-grained hematite aggregates were analysed in polished mounts from three samples. In addition some line analyses were performed in order to identify the high-U zones. The tabular hematite has higher U content than the massive one and therefore, is more suitable for U-Pb geochronology. Common 206Pb contents vary between 10 and 100%, thus Tera-Wasserburg plots are used to visualize the isotope ratios obtained by the individual laser spots and determine the lower intercept ages. The hematite U-Pb ages are summarized in Table 3. The uncertainty associated to the individual ages is relatively high due to the high proportion of common lead, but the bulk mean of all analyses is robust and cluster around 900 Ma (Fig. 15).
Summary of hematite U-Pb ages obtained on the samples from the Waterberg deposit.

* = not considered at interpretation. MSWD - mean square weighted deviation.
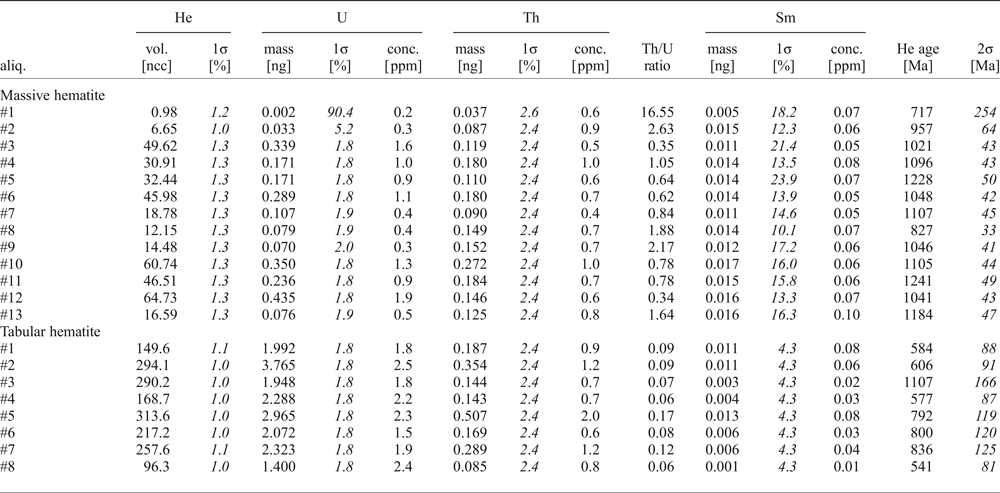
(2) (U-Th)/He dating of hematite: Both the tabular and the massive hematite were dated. The uncorrected (U-Th)/He ages obtained on the tabular, brown specularite are extremely old (2–4 Ga). That is why we had to apply the evaporation correction for U and Th. The (U-Th)/Pb ages obtained on hematite fragments are listed in Table 4. The mean of corrected He ages of specularite is ~730 Ma.
(U-Th)/He data obtained on hematite fragments from the Waterberg deposit.

The massive hematite yielded ages between 820 and 1240 Ma with an average of 1075 Ma (Fig. 15, Table 4), i.e. older than the specularite helium ages. Due to the lower closure temperature of specularite that consists of very thin flakes, the helium is better retained in the massive hematite. This may explain the younger age of the specularite compared to the (U-Th)/He ages obtained on massive hematite.
Results of U-Pb and (U-Th)/He geochronology. The horizontal bars at the upper part represent the major tectono-metamorphic events affecting the Kaapvaal Craton.

Discussion
Physicochemistry of the mineralizing fluid
Mungall and Naldrett (Reference Mungall and Naldrett2008) summarized that hydrothermal platinum-group element (PGE) ores are the result of highly oxidized Cl-rich aqueous fluids, which concentrate the PGE dispersed in host intrusions. High oxygen fugacity is essential for the mobilization of Pt as the solubility (PtCl42- and PtCl62- complexes) increases with oxidation state, towards lower pH and higher temperatures (Jaireth, Reference Jaireth1992). In fluid systems buffered by the magnetite-hematite assemblage, Pt-solubility may reach a maximum at ~250°C. Depositional sites are controlled by abrupt changes in fluid pH or redox state that can be caused by changes in wall rock chemistry. McDonald et al. (Reference McDonald, Ohnenstetter, Rowe, Tredoux, Pattrick and Vaughan1999) concluded that Pt and Pd were mobilized under strongly oxidizing conditions, in moderately acidic fluids (pH 4–5) as chloride complexes at temperatures of 300–200°C. Prokof'yev et al. (Reference Prokof'yev, Distler and Yudovskaya2001) and Distler (Reference Distler, Yudovskaya, Prokof'yev, Sluzhenikin, Mokhov and Mun2000) found that ore deposition occurred at 370 to 50°C from low-density high-temperature (0.4–0.7 wt.% NaCl eq.) and high-density low-temperature (15.5–21.1 wt.% NaCl eq.) Na–Ca–K–Fe chloride solutions. They explained the coexistence of these two fluids as the mixing of solutions of different origin, whereby the first fluid was proposed to be related to the Bushveld Complex (2.04–2.05 Ga), and the second could be related to water of deep circulation (basinal brines). However, our fluid-inclusion study shows no indication of a high-salinity mineralizing fluid, but low salinity NaCl–H2O. The question arises whether these ‘simple’ aqueous fluids may function as the PGE transporting agent at relatively low temperatures (<400°C).
In our study most reliable temperatures of quartz formation have been obtained from the application of the quartz-hematite thermometer based on oxygen stable isotopes (Zheng and Simon, Reference Zheng and Simon1991). The data show maximum temperatures of ~380°C for Qtz-1, and between ~370 and 330°C for Qtz-2; lowest temperatures recorded for the barren Qtz-4 are ~295°C. The deposit can therefore be characterized as a medium-temperature hydrothermal system (Williamson et al., Reference Williamson, Wilkinson, Luckham and Stanley2002).
The homogenization temperatures of fluid inclusions show a much larger range for Qtz-1 to Qtz-4. The maximum homogenization temperatures of fluid inclusions are ~400°C for Qtz-1, and ~390°C for Qtz-2. Due to pressure correction fluid-trapping temperatures may be somewhat higher than homogenization temperatures. However, in a vein system prevailing hydrostatic pressure after tectonic fracturing, implying a small pressure correction can be assumed. Therefore, the homogenization temperatures confirm the temperatures obtained from oxygen isotopes. On the other hand, extensive re-equilibration of the fluid inclusions points at much lower temperatures (typically 120–130°C and lower) compared to oxygen isotope equilibrium. The presence of one-phase inclusions indicates that fluid-inclusion modification must have proceeded towards even lower temperatures. Partial water leakage of the fluid inclusions may have resulted in higher salt concentrations and are assumed responsible for the large halite daughter crystals found in several inclusions. The transition from early magmatic and/or metamorphic NaCl–CaCl2 and NaCl-dominated hydrothermal fluids to late meteoric water can be explained by the shift of the crustal level during exhumation.
The association of Qtz-2 with hematite demonstrates that the fluid was oxidizing and must have stabilized Fe3+, thereby possibly excluding Fe from alloying with Pt (McDonald et al., Reference McDonald, Tredoux and Vaughan1995; Reference McDonald, Ohnenstetter, Rowe, Tredoux, Pattrick and Vaughan1999). The present study shows that both Fe3+ and Al3+ are the most important trace elements in quartz. These elements are also mainly responsible for the remarkable quartz CL properties. Fe3+ is responsible for the exceptionally intense magenta CL observed for Qtz-1 and early Qtz-2, whereas high Al results in the extinction of CL emission (dull CL) in parts of Qtz-2. The transition from Qtz-1 to Qtz-2 is characterized by the appearance of milky quartz along the vein rims followed by colloform quartz (Qtz-2a). The hydrothermal quartz types are characterized by successive lower Fe3+, but practically unchanged very high Al3+ contents. The role of Fe3+ as an oxidizing agent suggests very high oxygen fugacity at the earliest stage of alteration. The PGE mineralization appears with reducing Fe3+. The remarkably high concentrations of Al are assumed to reflect high solubility of Al in the hydrothermal fluid (Rusk et al., Reference Rusk, Lowers and Reed2008) before and during PGE mineralization. As the Al solubility largely depends on the pH, it can be concluded that the quartz must have been precipitated from Al-rich acidic fluids. The clear sparry Qtz-2b is characterized by varying Al-concentrations resulting in alternating growth zones of red and dull CL. The strong variations in the Al-concentration suggest pulses of acidic fluids, which were repeatedly neutralized. The barren small veinlets Qtz-3 and Qtz-4 represent the latest stage of quartz mineralization. The trace-element inventory of these quartz types is much affected by diffusion of trace elements from the surrounding quartz. Diffusion must have also affected the distribution of Ti in quartz, which is always very low. Along the contact with Qtz-1 and along the contacts with opaque minerals, the vein quartz is typically zoned with blue CL along the rims and more reddish CL in the cores. This zoning can be explained as a result of Ti-diffusion at high temperatures. Therefore, the trace-element finger prints of the hydrothermal stage are largely masked.
Under highly oxidizing, acidic, and saline conditions, platinum-group elements are significantly soluble as chloride complexes at temperatures below 500°C (Hanley et al., Reference Hanley, Pettke, Mungall and Spooner2005; Gammons, Reference Gammons1995). The first two conditions are fulfilled in the Waterberg case, however, high salinities were not encountered in our study, except in Qtz-1 dating before PGE mineralization. Therefore, alternative mechanisms of metal transport may be taken into account. The observed quartz and ore textures like botryoidal growth, roundish to globular grains of native platinum and Pt–Pd alloys occurring as garlands or cockades, and smaller grains occasionally forming emulsion-like textures led Wagner and Trevor (Reference Wagner and Trevor1923) and Wagner (Reference Wagner1929a,b) suggest that the ‘platinum’ was deposited as a gel. These textures are notably typical for the platinum-group mineralized Qtz-2a. Indeed, the potential transport of Pt, Pd and Au as colloids cannot be ruled out also in view of the deductions of Herrington and Wilkinson (Reference Herrington and Wilkinson1993), who indicated the possibility of initial precipitation of amorphous silica and colloidal gold followed by quartz overgrowths in mesothermal gold deposits. The roundish, botryoidal textures marked by magenta CL and high Fe3+ observed in CL for the Qtz-2a are assumed indicative of a gel precursor. Amorphous silica saturation can be reached by pressure drop from lithostatic to hydrostatic conditions during vein opening (Herrington and Wilkinson, Reference Herrington and Wilkinson1993). We assume that colloidal complexing as considered for gold mineralization may have played an important role also for the PGE mineralization.
Comparison with other PGE deposits
Eckstrand (Reference Eckstrand and Mungall2005) distinguished seven types of hydrothermal deposits and grouped Waterberg as an example of a polymetallic vein-type deposit (“Type C1”) containing PGE. Stressing the importance of the oxidation state, Wilde (Reference Wilde and Mungall2005) discerned three types of hydrothermal PGE deposits: (i) deposits of reduced passive margins; (ii) deposits of oxidized intra-cratonic basins; and (iii) near-surface (supergene) deposits. The oxidized terrestrial basin deposits are characterized by the occurrence of hematite and/or sulfate minerals. An example of the latter are the specularite-rich, S-free Au-PGE quartz vein (‘Jacutinga-type’) deposits of Brazil (e.g. Cabral et al., Reference Cabral, Lehmann, Tupinambá, Schlosser, Kwitko-Ribeiro and de Abreu2009; Reference Cabral, Lehmann and Brauns2011), a late-orogenic hydrothermal Pd–Pt-bearing Au-mineralization associated with quartz-hematite veins. Here, temperatures of 77–305°C recorded from fluid inclusions are clearly lower compared to the mineralized quartz in Waterberg, whereas the salinities of the fluids are commonly much higher (Lüders et al., Reference Lüders, Romer, Cabral, Schmidt, Banks and Schneider2005).
An extensive comparison with other hydrothermal PGE deposits was given in Part I (Oberthür et al., Reference Oberthür, Melcher, Fußwinkel, Van den Kerkhof and Sosa2018).
Geological context and age of mineralization
The timing of the Waterberg mineralization has been much debated and its age has been proposed to be between syn-Bushveld (~2.05 Ga) and very recent (<180 Ma, Armitage et al., Reference Armitage, McDonald and Tredoux2007). The geological message of the presently found (U-Th)/He and U-Pb ages is obvious. Both methods unequivocally indicate that the mineralization is related to a ~1.0 Ga event. The threshold of helium diffusivity in hematite is low (Bähr et al., Reference Bähr, Lippolt and Wernicke1994, Evenson et al., Reference Evenson, Reiners, Spencer and Shuster2014), and therefore, the similarity of U-Pb and (U-Th)/He ages clearly mark that after the formation of the hematite (~1.0 Ga), the deposit has not experienced significant thermal overprinting. Helium is highly retained in hematite at surface temperature, whereas at depth the closure temperature depends on the crystal size. Balout et al. (Reference Balout, Roques, Gautheron, Tassan-Got and Mbongo-Djimbi2017) mentioned a closure temperature of 83 and 154°C for grain size of 0.1 and 10 µm respectively; Evenson et al. (Reference Evenson, Reiners, Spencer and Shuster2014) mentioned higher closing temperatures in the range of 175–275°C.
The ages of ~1.0 Ga for the hematite are strange for the Kaapvaal Craton and may represent a far-field effect of the Kibaran orogeny (1.35–1.0 Ga). Rocks of Kibaran age are found e.g. in the south of Zimbabwe (Kamativi; Magondi Belt) and in Namaqualand on both sides of the South African/Namibian border. The ages of Waterberg fit also well with the post-collisional magmatism as recognized in the Namaqua-Natal Belt (Oriolo and Becker, Reference Oriolo, Becker and Siegesmund2018). Ages concentrating between 1075 and 835 Ma were obtained by Master et al. (Reference Master, Glynn and Wiedenbeck2017) from zircons collected from the Sijarira Group in western Zimbabwe. These authors show evidence of extensive tectonic activity on the eastern side of the Kalahari Craton between ~1140 down to 1000 Ma. The movements mainly affected a collision zone between the southern Mozambique Belt and the Maud Belt of West Dronning Maud Land, Antarctica (1090–1030 Ma; Board et al., Reference Board, Frimmel and Armstrong2005) and may have reactivated at least parts of the TML and given rise to the hydrothermal activity. A correlation with the intraplate Umkondo Igneous event is also possible (De Kock et al., Reference De Kock, Ernst, Söderlund, Jourdan, Hofmann, Le Gall, Bertrand, Chisonga, Beukes, Rajesh, Moseki and Fuchs2014). These mafic intrusions formed during a relative short period (1112–1108 Ma), but their chemistry does not concur with the quartz veins found at Waterberg.
Several authors agree that the ‘Main Lode’ is hosted within faults that juxtapose Karoo sandstones against Rooiberg volcanics of the Bushveld Complex (Wagner and Trevor, Reference Wagner and Trevor1923; Wagner, Reference Wagner, Steinmann and Wilckens1929a,b; Armitage et al., Reference Armitage, McDonald and Tredoux2007). This observation led these authors to conclude that faulting in the area must be post-Karoo. Therefore, our finding of ~1.0 Ga for the hematite is enigmatic and needs further explanation. It is speculated that (1) the sandstones are not of Karoo age, but are part of the Rooiberg Group (~2050 Ma), or (2) the fault zone is very old and has been repeatedly re-activated. The first possibility is difficult to prove, due to the lack of age dates of the sandstones. It is remarkable however (Armitage et al., Reference Armitage, McDonald and Tredoux2007) that the extension of the ore veins are not mineralized towards the contact with the sandstone, possibly suggesting that the mineralizing fluids did not migrate along younger fractures. The long evolution of the TML (and related regional faults) was confirmed by Good and de Wit (Reference Good and de Wit1997), who demonstrated that the TML has controlled episodic deformation during the geological history since the Archean (2.7 Ga). The latter demonstrates that hydrothermal activity is still on-going. The Waterberg deposit may have formed as a far-field effect of the Kibaran orogeny, or even connected with ‘Umkondo’. According to this scenario, the Karoo sandstones were deposited on top, followed by renewed activation of the fault zone and finally erosion.
Conclusions
The Waterberg deposit is exceptional among hydrothermal Au-PGE deposits worldwide. The present study shows that the PGE mineralization formed from ‘normal’ hydrothermal fluids (low-salinity NaCl-bearing solutions), typical for epithermal deposits. The PGE-mineralized quartz (Qtz-2a) crystallized at ~370–330°C, which would indicate mesothermal conditions. The lowest temperatures of quartz vein mineralization during cooling were estimated to be ~295°C. The local geological setting must have been essential for the PGE mineralization: The position on the TML enabled fluid circulation at deeper levels reaching the Bushveld Complex during tectonic activity at ~1.0 Ga. The fluids were acidic as shown by the presence of muscovite in the inclusions indicating pH 4–5. Interaction with the country rock resulted in the very high oxidation state of the fluid, enabling PGE mobilization. The redox conditions changed towards more reduced conditions, as reflected by the trace-element inventory in the quartz (high Fe3+/Al3+ → low Fe3+ and high Al3+ → low Fe3+/Al3+). The detailed differentiation of the hydrothermal quartz generations as presented in this study let us assume that the PGE mineralization can be associated with the earliest hydrothermal quartz which crystallized in a relative small temperature interval of 370–330°C. This stage was characterized by PGE transportation and mineralization by colloidal solutions. Essentially barren quartz crystallized during further cooling of the hydrothermal system below ~330°C. The mineralization age of ~1.0 Ga for the hematite consanguineous with vein quartz and platinum-group minerals is strange for the Kaapvaal Craton and may represent a far-field effect of the Kibaran orogeny (1.35–1.0 Ga).
Acknowledgements
Most of the samples studied were obtained from museum collections including the collections of E. Reuning, Museum für Naturkunde in Berlin (curator Dr. Ralf Thomas Schmitt) and P. Ramdohr at the University of Heidelberg (curator Dr. Michael Hanel). Further samples were loans from the Natural History Museum in London (BM 1985, MI15578), the Council for Geoscience in Pretoria, and the University of Cape Town, South Africa. Reinhold Przybilla at the Isotope Department, GZG (University of Göttingen) is acknowledged for his assistance in measuring the quartz stable isotopes. Constructive reviews of Prof. Marian Tredoux (University of the Free State, Bloemfontein) and Dr. David Holwell (University of Leicester) are acknowledged.