Implications
Albumin is included in the incubation medium for adipose tissue for multiple reasons. However, albumin has recently been demonstrated to alter cytokine expression by human and rodent adipocytes. Cyclodextrins have been used as an alternative to albumin in vitro and in vivo. However, the present study demonstrates that methyl-β-cyclodextrin is not suitable as an albumin substitute, as it reduces insulin-sensitive glucose metabolism through induction of tumor necrosis factor α.
Introduction
The role of adipose-derived cytokines has recently come to the forefront because of their interactions with adipocyte metabolism and adipose tissue function (Jacobi et al., Reference Jacobi, Ajuwon, Weber, Kuske, Dyer and Spurlock2004; Rasouli and Kern, Reference Rasouli and Kern2008). Research into the regulation of the expression of these paracrine cytokines in vitro typically requires the use of albumin in the medium to reduce lysis of the adipocytes through interaction with glass or plastic containers; to bind fatty acids released by the adipocytes, and thus prevent a feedback inhibition of metabolism; to function as a carrier for fatty acids to improve solubility; or to bind various proteins introduced into the medium to prevent those added proteins from binding to the vessel. Schlesinger et al. (Reference Schlesinger, van Harmelen, Alberti-Huber and Hauner2006) demonstrated that albumin (or it contaminants) can interact with the adipocyte to induce the expression of adipose-derived cytokines (adipokines), which complicates the analysis of adipokine regulation. Ruan et al. (Reference Ruan, Zarnowski, Cushman and Lodish2003) reported that the process of adipocyte isolation (in the presence of albumin) can alter adipokine expression within adipose tissue. Therefore, alternatives to albumin may be necessary because of albumin induction of cytokine expression, which complicates analysis of adipocyte-derived cytokines.
β-cyclodextrin has been used to bind fatty acids during the in vitro analysis of fatty acid oxidation (Kato et al., Reference Kato, Szejtli and Szente1993 and Reference Kato, Szejtli and Szente1994) and this would suggest that it may serve as a substitute for albumin in adipose tissue incubation. Methyl-β-cyclodextrin (MCD) has been used to bind fatty acids for in vivo infusion into growing swine (Wray-Cahen et al., Reference Wray-Cahen, Caperna and Steele2001) without the report of any deleterious effects when used at a 20% concentration (w/v) in the infusate, whereas various porcine and bovine albumins at 5% concentration (w/v) induced anaphylactic responses when infused into swine. The conclusion was that MCD may serve as an alternative carrier for fatty acids during infusions in swine. This implies that MCD did not induce cytokines during the infusion and suggests that MCD could be an alternative to albumin for inclusion in adipose incubations during the analysis of cytokine gene expression.
However, Le Lay et al. (Reference Le Lay, Krief, Farnier, Lefrère, Le Liepvre, Bazin, Ferré and Dugail2001) demonstrated that MCD can alter glucose metabolism and gene expression in rat adipocytes. Incubation of isolated inguinal rat adipocytes with 1 mM MCD could reduce insulin-stimulated glucose oxidation by ∼50%. They postulated that this was because of the depletion of cholesterol from the plasma membrane by MCD as supplementation of cholesterol to the MCD could preclude the reduction in insulin-stimulated glucose oxidation. However, cholesterol depletion also induces gene expression within 3T3-L1 adipocytes (Le Lay et al., Reference Le Lay, Krief, Farnier, Lefrère, Le Liepvre, Bazin, Ferré and Dugail2001). Incubation of differentiated 3T3-L1 cells with compactin (an inhibitor of sterol synthesis), and use of a lipoprotein-deficient serum in the medium resulted in a 70% reduction in cholesterol content of the 3T3-L1 adipocytes after 4 days. The mRNA abundance of tumor necrosis factor α (TNF) and interleukin 6 (IL6) appeared to be increased approximately fivefold and threefold after 4 days, although statistical analysis was not performed.
The use of MCD as a substitute for albumin for in vitro analysis of adipocyte function may be limited by the reported actions of MCD to alter adipocyte metabolism and its potential effect on the expression adipokines. The present study was designed to determine whether MCD alters glucose metabolism and adipokine gene expression in adipose tissue explants from neonatal swine.
Methodology
Experimental design
The first experiment compared responses in adipokine gene expression, following incubation with increasing concentrations of bovine serum albumin (BSA) or MCD. Albumin and MCD were used at 0 (control), 0.05%, 0.1%, 0.2% and 0.3% in the medium and prepared through serial dilution. Subcutaneous adipose tissue explants (100 mg) derived from 21-day-old pigs were incubated with these concentrations of albumin or MCD for 1 h. All explants were then rinsed and blotted with a subsequent transfer to a basal medium containing 0.05% albumin for 2 or 8 h of incubation. The adipose tissue explants were then collected for the analysis of TNF and IL6 mRNA abundance, and subsequently acetyl CoA carboxylase (ACAC) and fatty acid synthase (FASN) gene expression.
The effect of MCD on adipose metabolism was examined by measuring 14C-glucose oxidation and incorporation into lipid according to methods previously described (Ramsay, Reference Ramsay2003). Following 0.2% MCD or 0.2% BSA treatments for 1 h, tissue explants were transferred to 25 ml Erlenmeyer flasks with a medium containing 0.05% BSA ± 100 nM insulin and 14C-glucose. Glucose metabolism was then monitored for 2 h with subsequent collection of 14CO2 and extraction of 14C- labeled lipids from the tissue explants. Alternatively, MCD- and BSA-treated explants were placed in a basal medium (medium 199, 25 mM HEPES, 10 mm glucose, 0.05% BSA, 1 nM insulin) for 6 h and then transferred to Erlenmeyer flasks for a 2-h 14C-glucose incubation (a total of 8 h post-BSA/MCD treatment). This was to allow comparison with our gene expression data from the 8-h incubations described above.
The BSA selected for use in this experiment Sigma #9543 (low endotoxin, <0.1 ng/mg; Sigma-Aldrich, St. Louis, MO, USA) was selected because low-endotoxin BSA preparations produce minimal adipokine responses in human adipocytes, relative to other types of BSA preparations (Schlesinger et al., Reference Schlesinger, van Harmelen, Alberti-Huber and Hauner2006). The MCD was cell culture grade and also purchased from Sigma-Aldrich (#C4555). The concentration range selected was based on the data of Le Lay et al. (2002) that demonstrated an ∼35% reduction in glucose oxidation by isolated adipocytes with 0.05% MCD and a 50% reduction with ∼1.3% MCD (1.0 mM) treatment.
The adipokine genes selected for analysis were TNF and IL6. This was based on preliminary experiments that indicated that these two adipokines are the most highly expressed by porcine adipose tissue and demonstrate the largest response to incubation with MCD among a number of cytokines and metabolic genes (data not presented). Tumor necrosis factor α has been the most characterized of all adipokines and has key regulatory roles in the expression of a variety of proteins (Cawthorn and Sethi, Reference Cawthorn and Sethi2008), whereas IL6 is secreted by pig adipose tissue (Ajuwon and Spurlock, Reference Ajuwon and Spurlock2005) and cultures of pig adipocytes (Hausman et al., Reference Hausman, Poulos, Richardson, Barb, Andacht, Kirk and Mynatt2006). Acetyl CoA carboxylase and FASN are key regulatory genes in the pathway for lipogenesis (Lenhard, Reference Lenhard2011), and thus were selected as metabolic markers.
Tissue handling
Briefly, adipose tissue was dissected using sterile technique from 21-day-old pigs (Yorkshire × Landrace × Poland China), n = 3 to 4 per experiment, with different pigs used for each experiment. Dorsal subcutaneous adipose tissue samples from between the second and fourth thoracic vertebrae were acquired, following euthanasia by pentobarbital sodium injection (200 mg/kg BW), according to procedures approved by the Institutional Area Animal Use and Care Committee. Adipose tissue strips were placed in Hanks buffer (37°C, pH 7.4, Sigma-Aldrich, St. Louis, MO, USA) and were then dissected clean of any extraneous muscle tissue and further separated into 1 cm2 cubes. Adipose tissue explants (100 ± 10 mg) were prepared by slicing these tissue cubes with a Stadie–Riggs microtome in a laminar flow hood by procedures previously described (Ramsay and Richards, Reference Ramsay and Richards2004). Tissue slices were rinsed twice with fresh Hanks buffer (37°C, pH 7.4), blotted free of excess liquid and weighed. Tissue slices were then transferred to 12-well tissue culture plates containing 1 ml of medium 199 with 25 mM Hepes, 1.0 nM insulin and 0% to 0.3% BSA or 0% to 0.3% MCD at pH 7.4. Triplicate tissue slices were incubated with these media in a tissue culture incubator at 37°C with 95% air/5% CO2 for 1 h. Porcine insulin (Sigma-Aldrich, St. Louis, MO, USA) was solubilized in 0.001 N HCl. Individual hormone aliquots were thawed for each day of use and diluted in incubation medium to the appropriate concentration.
Following 1-h incubation with BSA or MCD, tissue explants were rinsed three times with fresh medium 199 (37°C), blotted and transferred to another 12-well tissue culture plate containing a basal medium that comprised medium 199, 25 mM HEPES, 1 nM insulin and 0.05% BSA. Controls were placed in the same medium but without BSA. Parallel cultures were incubated for either 2 or 8 h to evaluate the effects of MCD on gene expression. Following this incubation period, tissue explants were rinsed three times with medium 199 (37°C), blotted and then frozen in liquid nitrogen and stored at −80°C for later analysis of gene expression.
Glucose metabolism
Incubation medium comprised Medium 199 and supplemented with 25 mM Hepes, 10 mM glucose, 0.05% BSA, 100 nM insulin and 0.5 μCi D-[U-14C]- glucose/ml (Moravek Biochemicals, Brea, CA, USA). This medium (2 ml) was placed in 25 ml siliconized Erlenmeyer flasks. Following addition of radiolabeled medium and explants, flasks were gassed for 1 min with 95% air, 5% carbon dioxide and then capped with rubber stoppers containing a center well. Following 2 h of incubation, 0.5 ml 1 N H2SO4 was injected into the medium to kill the metabolic activity of the tissue. After 10 minutes, methylbenzythonium hydroxide (Sigma-Aldrich, St. Louis, MO, USA) was injected into the center well to permit capture of CO2 for the next 30 min. Center wells were subsequently transferred to scintillation vials containing 10 ml of scintillation cocktail (Bio-safe II, Research Products International Corp., Mount Prospect, IL, USA) for counting. Tissue explants were removed with forceps, blotted and transferred to screw capped tubes containing 5 ml of Dole's solution for lipid extraction by the method used by deCingolani (Reference DeCingolani1972). Incorporation of 14C into total lipid and fatty acids was determined following saponification, according to the methods of Azain and Martin (Reference Azain and Martin1983). Each metabolic experiment was repeated three times using three different animals and using triplicate explants/treatment for each pig. Data were calculated as nmole glucose utilized/hour per 100 mg tissue, but were represented in the graphs as relative to tissue incubated without BSA or MCD, a control whose value was arbitrarily set to 1.0.
An additional experiment was conducted to assess the potential role of TNF or IL6 secreted by the explants during incubation on the metabolism of the adipose tissue. Antibodies to porcine TNF (10 μg/ml) or IL6 (2.5 μg/ml) were included in the basal and radioactive incubation media during the 2- and 8-h incubations and compared with media without the antibodies. The anti-pig mouse monoclonal antibody to TNF and the anti-pig goat polyclonal antibody to IL6 were purchased from R&D Systems (Minneapolis, MN, USA). Antibody concentrations for use in the medium were based on preliminary experiments to produce a maximal response. Otherwise, the methodology was identical to that described above for measuring glucose metabolism.
Real-time PCR analysis of gene expression
Total RNA was isolated using Qiagen RNeasy spin columns, according to the manufacturer's protocol (Qiagen, Valencia, CA, USA). Integrity of RNA was assessed via agarose gel electrophoresis and RNA concentration was determined spectrophotometrically using A260 and A280 measurements.
All primer sets were designed to span an intron as previously described and utilized for real-time PCR (Ramsay and Azain, Reference Ramsay and Azain2007; Ramsay and Caperna, Reference Ramsay and Caperna2009; Ramsay et al., Reference Ramsay, Stoll and Caperna2010). The following primers were used for generating a 180-base amplicon corresponding to a portion of the TNF coding sequence: 5′-CCCCTCTGAAAAAGACACCA-3′ (forward), 5′-TCGAAGTGCAGTAGGCAGAA-3′ (reverse). The primers for IL6 were used to create a 215 base amplicon: 5′-ATGGCAGAAAAAGACGGATG-3′ (forward), 5′-GTGGTGGCTTTGTCTGGATT-3′ (reverse). Acetyl CoA carboxylase primers included a 5′-CTCCAGGACAGCACAGATCA-3′ (forward), 5′-GCCGAAACATCTCTGGGATA-3′ (reverse) to produce a 170-base amplicon, whereas a 210-base amplicon was produced with the following primers for fatty acid synthase: 5’-AACGTCCTGCTGAAGCCTAA-3’ (forward), 5’-CTCCTTGGAACCGTCTGTGT-3’ (reverse). The 18S rRNA was used as a relative standard for comparisons (QuantumRNATM Universal 18S Internal Standard; Ambion, Inc., Austin, TX, USA) in parallel reactions.
Thermal cycling and data acquisition were performed with a Bio-Rad iCycler IQ system (Bio-Rad Laboratories Inc., Hercules, CA, USA). Reverse transcription (RT) and real-time PCR analysis were performed in a two-tube assay as previously described (Ramsay and Caperna, Reference Ramsay and Caperna2009). RT was done using a Superscript First-Strand Synthesis System for RT-PCR kit (Invitrogen, Carlsbad, CA, USA). Master mix was made containing random hexamers (50 ng/μl), 10 mM dNTP mix, RNase-free H2O and RNA (1 μg/μl). The RNA mix was annealed at 65°C for 5 min. A second master mix was prepared with 10X RT buffer, 25 mM MgCl2, 0.1 mM dithiothreitol and 1.0 μl RNaseOut. This second master mix was added to the RNA mix and incubated at 25°C for 2 min. Superscript II was then added and incubated at 25°C for 10 min, 42°C for 50 min and 70°C for 15 min. An aliquot of RNase H (1.0 μl) was then added and incubated at 37°C for 20 min.
Real-time PCR was carried out using the IQ sybr green supermix kit (Bio-Rad Laboratories Inc., Hercules, CA, USA). A 24 μl reaction mix was made containing 12.5 μl sybr green supermix, 1.0 μl forward primer (10 μM), 1.0 μl reverse primer (10 μM) and 9.5 μl sterile water. This reaction mix was added to each well, followed by 1.0 μl RT product (25 μl total volume). Parameters for all reactions were as follows: 1 cycle at 95°C for 15 min (PCR activation), followed by 30 cycles, 94°C for 15 s, 58°C for 30 s, 72°C for 30 s, with a final extension at 72°C for 8 min.
Melting curve analysis was performed on all real-time PCR reactions to confirm specificity and identity of the real-time PCR products. A nontemplate control was run for every assay. Specificity of real-time PCR products was further confirmed by agarose gel electrophoresis.
Quantification of gene expression
At the end of the PCR, baseline and threshold crossing values (CT) for all analyzed genes were calculated using the BioRad software, and the CT values were exported to Microsoft Excel for analysis. The relative expression of the genes of interest, standardized against the amount of 18S mRNA, was calculated using the ΔΔCT method (Winer et al., Reference Winer, Jung, Shackel and Williams1999; Livak and Schmittgen, Reference Livak and Schmittgen2001). Values were calculated as the mean ± s.e.m. of duplicate determinations from triplicate tissue samples derived from each of four individual animals for each experiment. Data are expressed relative to values determined for incubations without BSA or MCD, a control whose value was arbitrarily set at 1.0.
Statistical analysis
Data were analyzed by analysis of variance using SigmaPlot 12 software (SPSS Science, Chicago, IL, USA) to test for the effects of treatment with MCD v. albumin. Mean separation was analyzed using Student–Newman–Keuls test. Means were defined as being different at P < 0.05.
Results
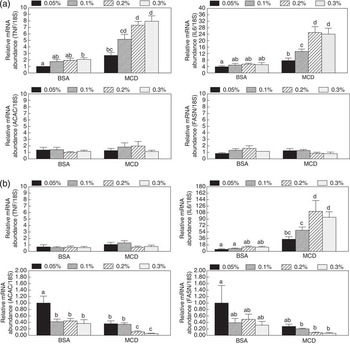
Tumor necrosis factor α mRNA abundance was increased 2 h after treatment with 0.3% BSA (P < 0.05; Figure 1a), but not with lower concentrations of BSA (P > 0.05). However, incubation with 0.05% MCD increased TNF by ∼80% (P < 0.01) relative to basal medium or 0.05% BSA, when measured 2 h after exposure. The response by TNF gene expression to MCD increased to a maximal eightfold with 0.2% MCD in the treatment medium (P = 0.009). Performing an 8-h incubation after BSA or MCD treatment before sample collection resulted in no change in TNF mRNA abundance from the control incubation without BSA or MCD (P = 0.423; Figure 1b).
Changes in mRNA abundance in response to different concentrations of albumin or MCD with time. Tissue explants (∼100 mg) were exposed to 0% (control), 0.05%, 0.1%, 0.2% or 0.3% albumin or MCD in medium 199 with 25 mM Hepes and 1.0 nM insulin at 37°C, pH 7.4 for 1 h. Explants were then blotted and transferred to a fresh medium comprising medium 199 with 25 mM Hepes and 1.0 nM insulin, pH 7.4 and incubated for either 2 or 8 h at 37°C. Adipose tissue explants were then blotted and frozen in liquid N2 for later RNA extraction and subsequent real-time PCR for 18S and TNFα amplicons. (a) mRNA abundance for the genes of interest at 2 h after treatment with BSA or MCD. (b) mRNA abundance for the genes of interest at 8 h after ending treatment with BSA or MCD. The relative expression of the genes of interest, standardized against the amount of 18S mRNA, was calculated using the ΔΔCT method. Data are expressed as the percent of relative abundance of the gene of interest to 18S in the control adipose explants as calculated with the (0% albumin/0% MCD). BSA = low endotoxin BSA (<1.0 ng/mg); MCD = methyl-β-cyclodextrin. abcdMeans not sharing a common superscript letter are different (P < 0.05).

Interleukin 6 mRNA abundance was unaffected by treatment with BSA at 2 h following treatment (P > 0.05), whereas an increase in IL6 gene expression was detected with 0.05% MCD in the medium and IL6 expression increased up to 25-fold with 0.2% MCD in the treatment medium (P < 0.019; Figure 1a). An 8-h incubation following the initial 1 h MCD treatment resulted in a much higher increase in IL6 mRNA abundance than the 2-h incubation (Figure 1b). Treatment with 0.05% MCD resulted in a 36-fold increase in IL6 mRNA abundance, whereas 0.2% MCD produced a 100-fold increase in IL6 gene expression relative to the control incubated with basal medium. The BSA treatment again had no detectable effect on IL6 mRNA abundance (P > 0.05).
Analysis of the mRNA abundance for enzymes that are rate limiting for lipogenesis demonstrated that neither ACAC nor FASN were affected within 2 h of exposure to BSA or MCD (P > 0.05; Figure 1a, respectively). Incubation for 8 h following removal of the BSA or MCD treatment resulted in a decline in ACAC mRNA abundance with 0.1% BSA or 0.05% MCD in the medium (P < 0.001; Figure 1b). No further change in ACAC gene expression occurred with higher concentrations of BSA than 0.1% (P > 0.05); however increasing the concentration of MCD to 0.2% led to a further 70% suppression in ACAC mRNA abundance (P < 0.001). Similarly, treatment with 0.1% or higher concentrations of MCD subsequently reduced FASN mRNA abundance (P < 0.008; Figure 1b).
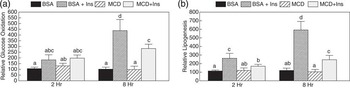
Incubation with 14C-glucose for 2 h, following a 1-h exposure to BSA or MCD, demonstrated that neither treatment affected basal or insulin-stimulated glucose oxidation at that time point (Figure 2a). However, incubation for 8 h (with inclusion of 14C glucose during the last 2 h) following 0.2% BSA or 0.2% MCD treatment demonstrated that MCD could limit the insulin response relative to the BSA treatment. Exposure of tissue explants to insulin following BSA treatment resulted in more than a fourfold increase in glucose oxidation, whereas MCD treatment resulted in less than a threefold increase in glucose oxidation with insulin treatment (P < 0.009).
Glucose metabolism in response to treatment with albumin or MCD. 14C-glucose oxidation and incorporation into lipid was performed, according to procedures described in the Methodology. Following 0.2% MCD or 0.2% BSA treatments for 1 h, tissue explants were transferred to 25 ml Erlenmeyer flasks with a medium containing 0.05% BSA ± 100 nM insulin and 0.5 μCi (U)-14C-glucose. Glucose metabolism was then monitored for 2 h with subsequent collection of 14CO2 and extraction of 14C-labeled lipids from the tissue explants. Alternatively, MCD- and BSA-treated explants were placed in a basal medium (medium 199, 25 mM HEPES, 10 mm glucose, 0.05% BSA, 1 nM insulin) for 6 h before transferring to Erlenmeyer flasks for the 2-h 14C-glucose incubation (a total of 8 h after MCD treatment). (a) Glucose oxidation at 2 and 8 h. (b) Lipogenesis from glucose at 2 and 8 h after MCD or BSA treatment. Each metabolic experiment was repeated three times with explants derived from three separate pigs and using triplicate explants/treatment for each pig. Data are expressed as a relative % of metabolic activity of explants incubated in medium without BSA or MCD. BSA = low-endotoxin BSA ( <1.0 ng/mg); MCD = methyl-β-cyclodextrin; Ins = 100 nM porcine insulin. abcd Means not sharing a common superscript letter are different (P < 0.05).

Lipogenic rates were also affected by MCD treatment (Figure 2b). Insulin-stimulated glucose incorporation into fatty acids by ∼180%, following exposure to 0.2% BSA in the 2-h incubation (P < 0.01), whereas MCD inhibited the development of an insulin response in adipose tissue explants (P > 0.05). The insulin response by BSA-treated tissue was much greater at 8 h than at 2 h with approximately a sixfold increase in fatty acid synthesis (P < 0.001). In contrast, MCD treatment resulted in limiting insulin stimulation of basal glucose incorporation into fatty acids to ∼150% (P < 0.01). Neither BSA nor MCD affected basal oxidation or lipogenesis (P > 0.05).
Incubation with 10 μg of a monoclonal TNF antibody did not alter insulin-stimulated glucose oxidation or lipogenesis, following treatment with 0.2% BSA at either 2 or 8 h (Figure 3). There was also no effect of the antibody on the metabolism of tissue explants treated with 0.2% MCD for 2 h. However, co-incubation of the TNF antibody in the medium for 8 h, following treatment with 0.2% MCD, increased the insulin-stimulated glucose oxidation by 26% (P < 0.05) and the lipogenic rate by 35% (P < 0.05). Treatment with an IL6 antibody had no effect on any metabolic parameters (P > 0.05; data not presented).
Effect of addition of an anti-TNF monoclonal antibody on insulin-stimulated glucose metabolism. 14C-glucose oxidation and incorporation into lipid was performed, according to procedures described in the Methodology. Following 0.2% MCD or 0.2% BSA treatments for 1 h, tissue explants were transferred to 25 ml Erlenmeyer flasks with a medium containing 0.05% BSA + 100 nM insulin and 0.5 μCi (U)-14C-glucose ± 10 μg anti-pig TNF monoclonal antibody. Glucose metabolism was then monitored for 2 h with subsequent collection of 14CO2 and extraction of 14C-labeled lipids from the tissue explants. Alternatively, MCD- and BSA-treated explants were placed in medium 199 containing 25 mM HEPES, 10 mm glucose, 0.05% BSA, 1.0 nM insulin, with or without 10 μg anti-pig TNF monoclonal antibody for 6 h before transferring to Erlenmeyer flasks for the 2-h 14C-glucose incubation ± 10 μg anti-pig TNF monoclonal antibody (a total of 8 h after MCD treatment). Data are expressed as a relative % change in oxidation or lipogenesis relative to explants incubated in medium without antibody. * = Different from explants not treated with the anti-pig TNF antibody (n = 3; P < 0.05). BSA = low-endotoxin BSA (<1.0 ng/mg); MCD = methyl-β-cyclodextrin; I = 100 nM porcine insulin.

Discussion
Treatment of adipose tissue explants with MCD resulted in an acute increase in TNF mRNA abundance. These experiments were purposefully performed with adipose tissue explants to preclude confounding the data with the use of isolated adipocytes, because the process of adipocyte isolation may also increase TNF expression (Ruan et al., Reference Ruan, Zarnowski, Cushman and Lodish2003). The observed increase in TNF mRNA abundance was in the same range as reported by Le Lay et al. (Reference Le Lay, Krief, Farnier, Lefrère, Le Liepvre, Bazin, Ferré and Dugail2001), although the present results were obtained within 2 h of MCD treatment and had dissipated by 8 h. This was followed later by a large surge in IL6 gene expression, much greater than reported in 3T3-L1 adipocytes treated with a cholesterol synthesis inhibitor (Le Lay et al., Reference Le Lay, Krief, Farnier, Lefrère, Le Liepvre, Bazin, Ferré and Dugail2001). This may partially be accounted for in the present study because measurements were made within the first 24 h of treatment, whereas gene expression was not analyzed until after 4 days of treatment in the study with 3T3-L1 cells (Le Lay et al., Reference Le Lay, Krief, Farnier, Lefrère, Le Liepvre, Bazin, Ferré and Dugail2001). Tumor necrosis factor α can stimulate the expression of IL6 (Fasshauer et al., Reference Fasshauer, Klein, Lossner and Paschke2003), which may account for some of the increase in IL6 mRNA abundance, following the increase in TNF gene expression. Conversely, IL6 has been shown to inhibit TNF protein expression (Starkie et al., Reference Starkie, Ostrowski, Jauffred, Febbraio and Pedersen2003). An increase in IL6 protein in association with the rise in IL6 gene expression in the present study would inhibit TNF gene transcription and could contribute to the absence of any effect of MCD on TNF mRNA abundance 8 h following treatment, but this requires further research.
These changes in adipokine gene expression were associated with a reduction in ACAC and FASN mRNA abundance within 8 h of treatment with MCD. Tumor necrosis factor α has been demonstrated to inhibit ACAC transcription in the 30A-5 adipocyte cell line (Pape and Kim, Reference Pape and Kim1988) and the 3T3-442A adipocyte cell line (Doerrler et al., Reference Doerrler, Feingold and Grunfeld1994), whereas FASN gene expression was demonstrated to be inhibited by TNF in the 3T3-442A adipocytes (Doerrler et al., Reference Doerrler, Feingold and Grunfeld1994). In contrast, IL6 has not been reported to alter ACAC expression or FASN expression in adipose tissue. However, IL6 has been demonstrated to reduce lipogenesis in 3T3-L1 adipocytes in association with a reduction in glucose transport (Lagathu et al., Reference Lagathu, Bastard, Auclair, Maachi, Capeau and Caron2003).
The decline in ACAC and FASN mRNA abundance with MCD treatment in the present study suggested that lipogenesis is altered by MCD treatment. This was confirmed by measuring 14C-glucose incorporation into fatty acids. The data indicate that only insulin–stimulated, and not basal lipogenesis, was affected by MCD treatment. Previous research has only assessed and reported an effect on glucose oxidation by isolated adipocytes (Le Lay et al., Reference Le Lay, Krief, Farnier, Lefrère, Le Liepvre, Bazin, Ferré and Dugail2001), and this was also observed in the present study with tissue explants.
The acknowledged mechanism of action for MCD is to reduce cholesterol content of the plasma membrane; MCD causes the collapse of caveolae in the plasma membrane by the removal of cholesterol (Breen et al., Reference Breen, Camps, Carvalho-Simoes, Zorzano and Pilch2012). The role of caveolae may be quite important to the physiology and metabolism of the adipocyte, as they can constitute up to 50% of the plasma membrane surface area of the adipocyte (Thorn et al., Reference Thorn, Stenkula, Karlsson, Ortegren, Nystrom, Gustavsson and Stralfors2003). The insulin receptor and insulin receptor substrate-I (IRS-1) are two signaling proteins that are localized to the cholesterol-rich caveolae in human adipocytes (Karlsson et al., Reference Karlsson, Thorn, Danielsson, Stenkula, Ost, Gustavsson, Nystrom and Strålfors2004), whereas only the insulin receptor is localized in rat adipocytes (Parpal et al., Reference Parpal, Karlsson, Thorn and Strålfors2001). Treatment of human adipocytes with β-cyclodextrin (10 mM) resulted in a reduction in membrane cholesterol content and a reduction in glucose transport, although insulin receptor phosphorylation and IRS-1phosphorylation were unaffected (Karlsson et al., Reference Karlsson, Thorn, Danielsson, Stenkula, Ost, Gustavsson, Nystrom and Strålfors2004). Treatment of rat adipocytes with a similar concentration of β-cyclodextrin resulted in a reduction in membrane cholesterol content and reductions in glucose transport and IRS-1 phosphorylation by insulin (Parpal et al., Reference Parpal, Karlsson, Thorn and Strålfors2001). These results are in agreement with Le Lay et al. (Reference Le Lay, Krief, Farnier, Lefrère, Le Liepvre, Bazin, Ferré and Dugail2001), demonstrating the development of an insulin resistance following 1.0 mM MCD treatment. The present study using pig adipose tissue explants also observed a reduction in insulin-stimulated glucose oxidation and lipogenesis, following treatment with MCD relative to albumin at 8 h following the treatment. At 2 h after MCD treatment, only an effect on lipogenesis was detected, although the insulin response by glucose oxidation following MCD treatment was 28% less than after BSA treatment (P > 0.05). The results at 8 h are intriguing, because this is the timeframe following the elevation in TNF gene expression and parallels the large increase in IL6 gene expression.
This raised the question as to whether these adipokines may be contributing to the relative insulin resistance in glucose metabolism at 8 h. Treatment with an anti-pig TNF antibody resulted in reducing the resistance of glucose metabolism to insulin, but only at 8 h after treatment; the antibodies to IL6 did not alter the insulin resistance (data not presented). Inclusion of the antibodies throughout the 8 h permitted binding of preformed or tissue surface TNF, as well as subsequently the synthesized and secreted TNF. These data suggest that the induction of TNF following MCD treatment contributed to the insulin resistance detected 8 h after the treatment ended.
How MCD stimulates the expression and release of TNF is not clear. The use of cyclodextrins to extract cholesterol from caveolae is not a subtle method. Numerous receptors and signaling molecules are affected, disturbed or recycled as a result of the process. Therefore, the potential signal for this increase in adipokine gene expression cannot be ascertained at this time. What is abundantly clear is that MCD metabolically stresses the cell, resulting in an increase in TNF expression that can have an impact on insulin sensitivity and thus glucose metabolism. A major purpose of this experiment was to find a replacement for albumin, as it has shown to induce cytokine expression by rat adipose tissue (Schlesinger et al., Reference Schlesinger, van Harmelen, Alberti-Huber and Hauner2006). However, the present study has demonstrated that MCD is not a satisfactory substitute for albumin in experiments to assess adipose-derived cytokines. A search for a more appropriate substitute for albumin is still necessary. In vivo, infusion of solutions containing 5% porcine albumin caused anaphylaxis, whereas a 5% solution of MCD did not (Wray-Cahen et al., Reference Wray-Cahen, Caperna and Steele2001). The lack of an anaphylactic response to MCD in that study would suggest that adipose-derived cytokines may not make a significant contribution to the overall peripheral response to MCD when assessed relative to the observed acute elevation in TNF in the present study.
Acknowledgments
The authors thank M. Stoll for her assistance with the RNA extractions and real-time PCR. The authors thank A. Shannon for her assistance with animal collection. The authors also thank the swine herd staff, USDA-Beltsville, for their work in animal care.