Implications
Feeding a high concentrate diet to ruminants is a common strategy for maintaining high milk yields. Unfortunately, there is a strong correlation between the amount of concentrate feeding and the occurrence of acidosis and fatty liver in practice, which will decrease animal welfare and result in significant economic losses. As the vital metabolic organ, the liver is responsible for nutrient partitioning and contributes to the input of substrate precursors to the mammary gland for milk production. Therefore, it is important to investigate changes of hepatic metabolism in lactating ruminants fed a high concentrate diet, which will help elucidate the internal mechanism behind these metabolic changes.
Introduction
In the current intensive production systems, large amounts of cereal grains or easily degradable byproducts are fed to lactating cows to meet energy requirement for maintenance and high milk yields (Keunen et al., Reference Keunen, Plaizier, Kyriazakis, Duffield, Widowski, Lindinger and McBride2002). As a consequence, the ruminant microbial ecology and systemic metabolic state will change because of the rapid fermentation and subsequent excessive organic acids accumulation, and such animals are likely to suffer metabolic disorders such as acidosis, fatty liver, laminitis and even systemic inflammation (Alegre et al., Reference Al-Trad, Wittek, Penner, Reisberg, Gabel, Furll and Aschenbach1988; Kleen et al., Reference Kleen, Hooijer, Rehage and Noordhuizen2003; Plaizier et al., Reference Plaizier, Krause, Gozho and McBride2008; Dong et al., Reference Dong, Liu, Wu, Lei, Zhou and Zhang2011; Tao et al., Reference Tao, Duanmu, Dong, Tian, Ni and Zhao2014). Our previous studies also showed that long-term feeding of a 65% high concentrate (HC) diet to lactating dairy goats led to subacute ruminal acidosis (SARA) and disruptions of mucosal barrier in the hindgut (Dong et al., Reference Dong, Wang, Jia, Ni, Zhang, Zhuang, Shen and Zhao2013; Tao et al., Reference Tao, Duanmu, Dong, Tian, Ni and Zhao2014).
In ruminants, the liver is the major site for gluconeogenesis and lipogenesis. The two carbon (C2) components of volatile fatty acids (VFA) are used to synthesize lipids in the liver and mammary gland, whereas the three carbon (C3) components of VFA act as essential precursors for gluconeogenesis in the liver (van Knegsel et al., Reference Vanhatalo, Varvikko and Huhtanen2005). Hepatic gluconeogenesis is critical for milk production because gluconeogenesis is the major pathway for maintaining an adequate glucose supply to the mammary glands (Zhao and Keating, Reference Zhao and Keating2007). In addition, hepatic lipid synthesis is very important for developing the physical properties and quality of the milk. Among the factors involved in hepatic gluconeogenesis, glucose-6-phosphatase (G6Pase), pyruvate carboxylase (PC) and phosphoenolpyruvate carboxykinase (PEPCK) are the rate-limiting enzymes in the gluconeogenic process (Pershing et al., Reference Pershing, Moore, Dinges, Thatcher and Badinga2002; Al-Trad et al., Reference Alegre, Ciudad, Fillat and Guinovart2010). However, whether milk production is changed in lactating ruminants after they are fed a high concentrate for a relative long time and the molecular mechanism involved in the hepatic gluconeogenic process is still unclear.
In the liver, lipid synthesis involves the de novo synthesis of fatty acids (FA) in addition to the incorporation of de novo and preformed FA into triglycerides (TG). The activation of these metabolic pathways requires the coordinated regulation of a network of genes that encode lipogenic enzymes such as the de novo FA synthesis gene fatty acid synthase (FASN), the FA modification gene stearoyl-CoA desaturase-1 (SCD1), and the TG synthesis gene diacylglycerol acyltransferase (DGAT). During this synthetic process, some transcriptional factors that are considered critical for the activation of these genes include peroxisome proliferator-activated receptor γ and sterol regulatory element-binding protein 1c (SREBP-1c). However, there are contrasting results on lipid synthesis after feeding an HC diet. Bernard et al. (Reference Bernard, Leroux, Rouel, Bonnet and Chilliard2012) and Li et al. (Reference Li, Chen, Guan, Li, Lei, Liu, Yin, Liu and Wang2013) reported that either increased or more stable acetate and butyrate could increase de novo FA synthesis in mammary glands, leading to an increase of milk fat, but a decrease in lipid synthesis in the liver. In contrast, Nocek (Reference Nocek1997) and Kleen et al. (Reference Kleen, Hooijer, Rehage and Noordhuizen2003) reported that milk fat depression occurred after feeding an HC diet.
The present study aims to investigate the changes of metabolism in mid-lactating goats after feeding an HC diet for 10 weeks, and particularly focusing on hepatic gluconeogenesis, lipogenesis and energy storage. The results of this study provide insights for understanding the process of metabolism in the liver after feeding an HC diet.
Material and methods
Animals
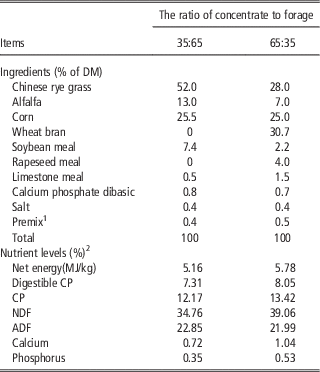
The experimental design was presented in our previous study (Tao et al., Reference Tao, Duanmu, Dong, Tian, Ni and Zhao2014). The ingredients and composition of the experimental diets are shown in Table 1. In brief, 12 healthy multiparous mid-lactating goats (60 days after parturition) (Guanzhong dairy goats, Xi’an City, China) with an average BW of 49.7±5.5 kg (means±SD) were housed in individual stalls. Animals were randomly allocated to two dietary treatments. One group received a low concentrate (LC) diet (35% concentrate on dry matter basis, n=6) and the other group received an HC diet (65% concentrate on dry matter basis, n=6). After 2 weeks adaptation, goats were fed their respective diets as total mixed ration (TMR) at 0800 and 1800 h. The experiment lasted for 10 weeks. All goats were given free access to fresh water throughout the experiment. At the end of experiment, goats were weighed and slaughtered after overnight fasting. All goats were euthanized with jugular injections of xylazine (0.5 mg/kg BW; Xylosol; Ogris Pharma, Wels, Austria) and pentobarbital (50 mg/kg BW; WDT, Garbsen, Germany) before exsanguination.
Ingredients and composition of the experimental diets (%)

DM=dry matter.
1 Provided per kilogram of premix: vitamin A, 6000 U; vitamin D2, 500 U; vitamin E, 80 mg; Cu, 6.25 mg; Fe, 62.5 mg; Zn, 62.5 mg; Mn, 50 mg; I, 0.125 mg; Co, 0.125 mg; Mo, 0.125 mg.
2 Nutrient levels were estimated from the current goat foods.
The experiment was conducted following the guidelines of the Animal Ethics Committee at Nanjing Agricultural University, China. The study was approved by the Animal Ethics Committee of Nanjing Agriculture University. The sampling procedures complied with the ‘Guidelines on Ethical Treatment of Experimental Animals’ (2006) No. 398 set by the Ministry of Science and Technology of China and ‘the Regulation regarding the Management and Treatment of Experimental Animals’ (2008) No.45 set by the Jiangsu Provincial People’s Government.
Milk composition
Goats were milked at 0800 and 1800 h and milk yield recorded. The milk was mixed, and 50 ml of milk was collected every 2 weeks into vials with potassium dichromate and were stored at 4°C to determine milk fat, protein and lactose concentrations conducted by the commercial company Nanjing Weigang Dairy Industry Co. Ltd (Nanjing, China).
Rumen pH and volatile fatty acids
Rumen fluid (15 ml) was collected immediately after slaughter and was strained through three layers of cheesecloth. The rumen fluid was divided into a 5 ml sample for immediate pH measurement using a pH meter, and another 10 ml sample was transferred into tubes for centrifugation at 1900×g at 4°C for 30 min. Subsequently, the supernatant was collected and stored at −20°C for VFA analysis. VFA was measured as previously described (Yang et al., 2012). In brief, an Agilent HP6890N gas chromatograph (Agilent Technologies, Wilmington, DE, USA) equipped with a HP-FFAP capillary column (Hewlett-Packard, Palo Alto, CA, USA) was employed to detect VFA concentrations. Nitrogen was used as the carrier gas (99.99% purity) at a constant flow rate of 2.8 ml/min and a split ratio of 1 : 30. Crotonic acid was used as an internal standard.
Plasma biochemical parameters
Blood samples were collected 15 min before feeding at 0800 h. Blood from the jugular was collected in evacuated tubes containing potassium ethylene diamine tetraacetic acid (EDTA) and all samples were centrifuged at 4°C at 3000×g for 30 min. The supernatant was collected and stored at −20°C until analysis. Commercial kits for determining concentrations of glucose (R1, 417-48691; R2, 413-48791), total cholesterol (Tch) (R1, 415-43991; R2, 415-44091), TG (R1, 418-37491; R2, 414-37591), non-esterified fatty acids (NEFA) (R1, 999-34691; R2, 991-34891) and low-density lipoprotein cholesterol (LDL-C) (R1, 411-86691; R2, 417-86791) were purchased from Wako Pure Chemical Industries Ltd (Osaka, Japan). All measurements were conducted with a Hitachi 7020 automatic biochemical analyzer (Hitachi, Tokyo, Japan).
Liver glycogen, glucose, cholesterol, triglycerides, energy levels and gluconeogenic enzyme activity
At the end of the experiment, liver was weighed and ~1 g of liver tissues were taken immediately after animals were slaughtered. One aliquot were stored at −80°C for analysis of glycogen, energy levels and gluconeogenic enzyme activities, and another aliquot was frozen in liquid nitrogen and stored at −80°C until messenger RNA (mRNA) and/or protein expression analyzed.
Hepatic glycogen was extracted and analyzed by using a commercial kit (A043; Nanjing Jiancheng Bioengineering Institute, Nanjing, China). Hepatic glucose was measured by glucose assay kit (GAGO20-1KT; Sigma, St. Louis, MO, USA). Cholesterol and TG were measured by commercial kits (E1015, E1013, respectively; Applygen Technologies Inc., Beijing, China) following the manufacturer’s instructions. Concentrations of AMP, ADP, ATP, NAD and NADH in the liver were determined as described by Jia et al. (Reference Jia, Li, Cong, Yang, Sun, Parvizi and Zhao2013). These parameters were analyzed by HPLC. ATP (FLAAS), ADP (A5285), AMP (01930), NAD (N7004) and NADH (N8129) standards for HPLC analysis were purchased from Sigma.
Hepatic PEPCK1 enzyme activity was detected as previously described (Cai et al., Reference Cai, Jia, Song, Sui, Lu, Jiang and Zhao2014). In brief, 0.5 g of liver tissue was homogenized in a lysis buffer (0.25 M sucrose and 5 mM Tris-HCl, pH 7.4) at 4°C. The liver lysates were centrifuged at 3500×g for 15 min, and the supernatant was collected for further centrifugation at 11 000×g for 40 min. Cytosolic supernatant containing 0.2 mg of total protein was added to 1 ml of reaction buffer (50 mM Tris-HCl, 50 mM NaHCO3, 1 mM MnCl2, 1 mM phosphoenolpyruvate, 2 U malate dehydrogenase and 0.25 mM NAD). Finally, 0.15 mM 2'-deoxyguanosine 5'-diphosphate was added to start the reaction, and the absorbance at 340 nm was measured within 4 min.
Hepatic G6Pase enzyme activity was detected as previously described with minor modifications (Daly and Ertingshausen, Reference Daly and Ertingshausen1972; Alegre et al., Reference Al-Trad, Wittek, Penner, Reisberg, Gabel, Furll and Aschenbach1988). In brief, 0.5 g of liver tissue was homogenized in lysis buffer (0.2 M potassium citrate, pH 6.5) and was ground with a Teflon pestle on ice. The liver lysates were centrifuged at 3500×g for 10 min at 4°C, and the remaining supernatant was centrifuged at 12 000×g for 40 min at 4°C. The supernatant containing 0.2 mg of total protein and reaction buffer (glucose-6-phosphate 26.5 mM, pH 6.5 and EDTA 1.8 mM, pH 6.5) was incubated for 5 min at 30°C. The supernatant and the reaction buffer were mixed at an equal ratio and were incubated for 10 min at 30°C and 10% trichloroacetic acid was added to stop the reaction. Finally, a commercial Phosphate Assay kit (C006; Nanjing Jiancheng Bioengineering Institute) was used to measure the phosphorus concentration after filtering.
Real-time PCR and Western blotting
Total RNA was extracted from the liver of each dairy goat using TRIZOL reagent (TaKaRa, Dalian, China) according to the manufacturer’s protocols. Expression of genes involved in gluconeogenesis and lipogenesis, namely hexokinase (HK), G6Pase, PC, PEPCK1, PEPCK2, SREBP-1c, FANS, SCD1, DGAT1 and DGAT2 was relatively quantified by real-time PCR. PCR was performed using an Mx3000 P (Stratagene, La Jolla, CA, USA). A sample (2 μl) of 20-fold diluted reverse transcription product was used for PCR in a final volume of 10 μl. Three technical replicates were analyzed for each biological replicate, and goat glyceraldehyde 3-phosphate dehydrogenase (GAPDH) mRNA was used as a reference gene for normalization purposes. The PCR protocol began with an initial denaturation (1 min at 95°C) followed by a three-step amplification program (20 s at 95°C, 20 to 30 s at 60°C to 62°C and 30 s at 72°C), which was repeated 45 times. The primers were designed by using software (Primer Premier 5.0; PREMIER Biosoft International, Palo Alto, CA, USA) and the primers sequences are shown in Supplementary Table S1.
A sample of 100 mg of frozen liver tissues were minced and homogenized in 1 ml of ice-cold radio immunoprecipitation assay (RIPA) buffer containing EDTA-free protease inhibitor cocktail tablets and phosphatase inhibitor cocktail tablets (Roche, Penzberg, Germany). The homogenates were centrifuged at 12 000×g for 20 min at 4°C and then the supernatant fraction was collected. The protein concentration was determined by the bicinchoninic acid (BCA) assay (Pierce, Rockford, IL, USA); 50 μg of proteins were loaded into 10% SDS/PAGE gels, separated by electrophoresis and transferred to 0.45-μm pore size nitrocellulose filter membranes (Bio Trace, Pall Corporation, Port Washington, New York, USA). Western blot analysis was performed with primary antibodies to AMP-activated protein kinase (AMPK)/p-AMPK (BS1009; Bioworld Technology Inc., St. Louis, MO, USA, 1 : 500; SC-33524, Santa Cruz Biotechnology Inc., CA, USA, 1 : 500) followed by horseradish-peroxidase (HRP)-conjugated secondary antibodies. Antibodies to the reference protein GAPDH (AP0063; Bioworld Technology Inc, 1 : 10 000) were used for normalization purposes in the analysis. Finally, the blot was washed, and bands were detected through enhanced chemiluminescence (ECL) using LumiGlo substrate (Super Signal West Pico Trial Kit; Pierce). ECL signals were recorded using an imaging system (Bio-Rad, CA, USA) and were analyzed using Quantity One software (Bio-Rad).
Chromatin immunoprecipitation assay
Approximately 200 mg of frozen liver tissue were suspended with phosphate buffer saline (PBS) containing protease inhibitor cocktail (no. 11697498001; Roche). Cross-linking of protein and DNA was performed by adding formaldehyde to a final concentration of 1%, and then the reaction was terminated with glycine (2.5 M) at room temperature. The reaction mix was centrifuged and the pellets were rinsed with PBS and homogenized in a SDS lysis buffer containing protease inhibitors. Crude chromatin preparations were sonicated to an average length ranging from 200 to 500 bp and pre-cleared with salmon sperm DNA-treated protein A/G agarose beads (40 μl, 50% slurry, SC-2003, Santa Cruz Biotechnology Inc.). The mixture of pre-cleared chromatin preparations and 2 μg of specific primary antibody anti-histone H3 (acetyl K27)-ChIP grade (AB4729; Abcam, Cambridge, MA, USA) were incubated overnight at 4°C. A negative control was included with normal rabbit IgG. Protein A/G agarose beads were added to capture the immunoprecipitated chromatin complexes. Finally, DNA fragments were released from the immunoprecipitated complexes by reverse cross-linking at 65°C for 1 h, and quantitative real-time PCR was used to quantify the fragments of target gene promoters with specific primers (Supplementary Table S1) using purified immunoprecipitated DNA as the template.
Statistical analyses
All data are presented as the means±SEM. The data of milk yield and milk composition were analyzed for differences due to diets, feeding time and their interaction by using PROC MIXED, SAS 9.3 (SAS Institute Inc., Cary, NC, USA). In this model, diet treatment, time and their interaction were included as fixed explanatory variables; goat ID as random variable, and time as repeated variable. The differences of parameters in ruminal fluid and blood, genes expression, protein and enzymes activities in the liver were analyzed by using the post hoc analysis with the LSD test following ANOVA of SPSS 11.0. Analysis of relative gene expression data using real-time quantitative PCR and the
 $${\rm 2}^{{{\minus}\Delta \Delta C_{t} }} $$
method (Livak and Schmittgen, Reference Livak and Schmittgen2001). GAPDH gene was used as a reference gene for normalization purposes. Differences were considered significant at P<0.05.
Results
Milk production and composition
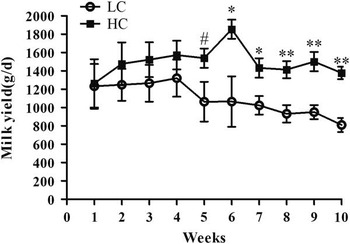
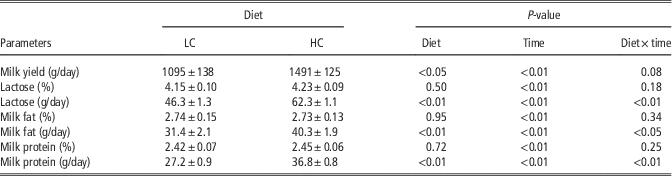
There were no significant differences in milk production between HC and LC goats from the 1st week through the 4th week, but HC goats produced more milk from the 5th week to the 10th week than LC goats (P<0.05, Figure 1). The daily yields of milk (P<0.05), milk fat, lactose and protein were significantly increased in HC goats compared with LC (P<0.01), whereas the percentage of milk lactose, fat and protein was not affected by the diet. The percentage of milk lactose, fat and protein was increased with lactation length (P<0.01). There was a significant interaction of diet and time on daily lactose, milk fat and milk protein production but not on other parameters (Table 2).
Effect of high (HC) or low (LC) proportion of concentrate diet on milk yield. All the values are expressed as means±SEM. # 0.1<P<0.05, *P<0.05, **P<0.01.

Effect of high (HC) or low (LC) proportion of concentrate in the diet of lactating dairy goats on milk yield and composition

Values are means±SEM.
Rumen pH, volatile fatty acids concentrations, BW, liver weight and levels of energy
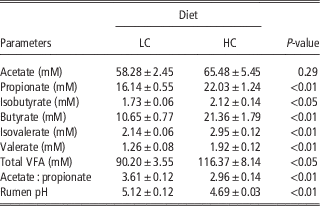
Ruminal pH was lower in HC goats compared with LC (P<0.05). The concentrations of propionate (P<0.01), butyrate (P<0.01), isobutyrate (P<0.05), valerate (P<0.01) and isovalerate (P<0.01) as well as total VFA (P<0.05) in rumen fluid were significantly increased, whereas the ratio of acetate to propionate (P<0.01) were markedly decreased in HC goats compared with LC (Table 3).
Effect of high (HC) or low (LC) proportion of concentrate diet on ruminal volatile fatty acids (VFA) and rumen pH in mid-lactation dairy goats

Values are means±SEM.
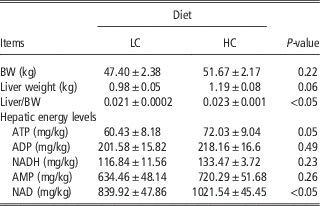
Liver weight (P=0.06) and the liver to BW ratio (P<0.05) were significantly increased in HC goats compared with LC goats, whereas BW was unaffected by the diet. The concentration of hepatic ATP and NAD was significantly greater (P<0.05) in HC goats, yet hepatic ADP, AMP and NADH concentrations were not altered by diets (Table 4).
Effect of high (HC) or low (LC) proportion of concentrate diet on BW, liver weight and hepatic energy levels of dairy goats

Values are means±SEM.
Metabolic parameters in blood and liver
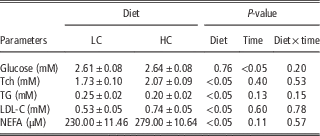
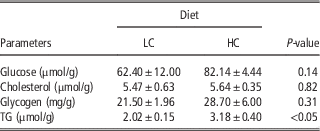
HC goats had greater plasma cholesterol, LDL-C and NEFA concentrations (P<0.05) and lower TG concentrations (P<0.05) than LC goats. Plasma glucose concentration showed a significant increase as lactation progressed (P<0.01) but was unaffected by diet (Table 5). Compared with LC goats, HC goats had significantly greater concentrations of hepatic TG, whereas there was no significant difference in hepatic glucose, Tch and glycogen concentrations (Table 6).
Effect of high (HC) or low (LC) proportion of concentrate diet on biochemical parameters in the plasma of dairy goats

Tch=total cholesterol; TG=triglyceride; LDL-C=low-density lipoprotein cholesterol; NEFA=non-esterified fatty acids.
Values are means±SEM.
Effect of high (HC) or low (LC) proportion of concentrate diet on hepatic glucose, cholesterol, glycogen and triglyceride (TG) concentrations

Values are means±SEM.
Gene expression, enzyme activities and histone acetylation
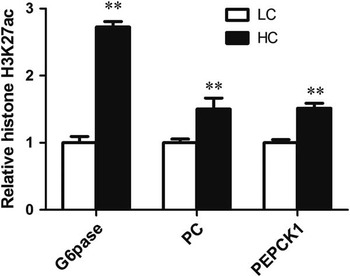
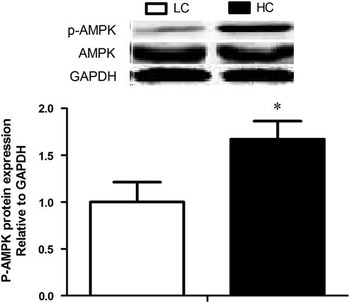
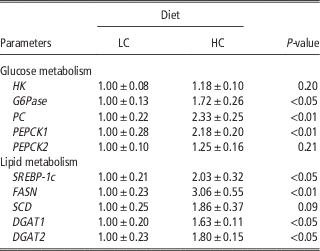
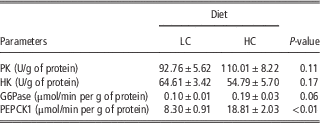
Compared with LC goats, gene expression of G6Pase, PEPCK1 and PC was significantly up-regulated in the liver of HC goats (Table 7), paralleling greater enzyme activities in hepatic PEPCK1 (P<0.01) and G6Pase (P=0.06) (Table 8). ChIP analysis revealed a significant increase of acetylation on the promoter of G6Pase, PC and PEPCK1, which were positively correlated with the up-regulation of their genes in mRNA expression (P<0.01) (Figure 2). Lipogenic gene expression levels, including FASN, SCD1, DGAT1, DGAT2 and SREBP-1c, were significantly up-regulated in HC goats compared with LC goats (Table 6). Moreover, p-AMPK (P<0.05) but not total AMPK protein was significantly increased in HC goats (Figure 3).
Effect of high (HC) or low (LC) proportion of concentrate diet on histone-3-lysine-27-acetylation (H3K27ac) at glucose-6-phosphatase (G6Pase), pyruvate carboxylase (PC), phosphoenolpyruvate carboxykinase 1 (PEPCK1) genes promoter region. All the values are expressed as means±SEM. **P<0.01.

Effect of high (HC) or low (LC) proportion of concentrate diet on p-AMPK/AMPK protein expression in liver of dairy goats. All the values are expressed as means±SEM. *P<0.05.

Effect of high (HC) or low (LC) proportion of concentrate diet on the expression of hepatic genes involved in glucose and lipid metabolism in dairy goats

HK=hexokinase; G6Pase=glucose-6-phosphatase; PC=pyruvate carboxylase; PEPCK=phosphoenolpyruvate carboxykinase; SREBP-1c=sterol regulatory element-binding protein 1c; FASN=fatty acid synthase; SCD=stearoyl-CoA desaturase-1; DGAT=diacylglycerol acyltransferase.
Values are means±SEM.
Effect of high or low proportion of concentrate diet on enzyme activities involved in glycolysis and glucogenesis in dairy goats

LC=35% concentrate; HC=65% concentrate; PK=pyruvate kinase; HK=hexokinase; G6Pase=glucose-6-phosphatase; PEPCK=phosphoenolpyruvate carboxykinase.
Values are means±SEM.
Discussion
Effects of diet on milk performance
In ruminants, feeding excessive amount of diets rich in rapidly fermentable matter leads to the accumulation of organic acids (i.e. VFA) in the rumen without enough inorganic buffers to neutralize the organic acids (Yang and Beauchemin, Reference Yang and Beauchemin2006; Beauchemin et al., Reference Beauchemin, Eriksen, Norgaard and Rode2008). In this study, in order to avoid surgical damage and additional stress, a permanent ruminal cannula was not inserted into rumen. Ruminal pH was only measured after goats were slaughtered. Significantly lower ruminal pH was observed in HC goats compared with LC goats, which was accompanied with greater VFA concentrations in ruminal fluids. These results were consistent with our previous studies (Dong et al., Reference Dong, Wang, Jia, Ni, Zhang, Zhuang, Shen and Zhao2013; Jia et al., Reference Jia, Wang, Ni, Zhang, Zhuang and Shen2014; Tao et al., Reference Tao, Duanmu, Dong, Tian, Ni and Zhao2014; Tao et al., Reference Tao, Tian, Cong, Sun, Duanmu, Dong, Ni and Zhao2015). In those studies SARA were experimentally induced by feeding 65% concentrate diet for 2 months. Therefore, in the current study greater VFA concentrations and lower pH indicate a disorder (SARA) in ruminal fermentation in goats fed with 65% concentrate diet for 10 weeks.
SARA has been assumed to reduce the supply of nutrient precursors for milk production and then decrease milk performance in dairy cows (Kleen et al., Reference Kleen, Hooijer, Rehage and Noordhuizen2003; Krause and Oetzel, Reference Krause and Oetzel2005; Enemark, Reference Enemark2008; Plaizier et al., Reference Plaizier, Krause, Gozho and McBride2008; Khafipour et al., Reference Khafipour, Krause and Plaizier2009). SARA induced by feeding ground alfalfa pellets or replacing 21% of the dry matter with pellets containing 50% wheat and 50% barley may reduce milk yield and milk fat, and tended to increase milk protein in lactating cows (Khafipour et al., Reference Khafipour, Krause and Plaizier2009). However, it is reported that lactating goats fed with 60% concentrate diet for 4 weeks produced more milk, milk fat and protein than control goats fed with 30% concentrate diet (Giger-Reverdin et al., Reference Giger-Reverdin, Rigalma, Desnoyers, Sauvant and Duvaux-Ponter2014). Consistently, in this study HC goats had greater milk yield, milk fat and milk protein after fed with 65% concentrate diet for 10 weeks. A greater increase of total amount of milk protein may be associated with an increase in microbial protein synthesis through rumen-digestible organic matter in the rumen (Vanhatalo et al., Reference van Knegsel, van den Brand, Dijkstra, Tamminga and Kemp2003; Plaizier et al., Reference Plaizier, Krause, Gozho and McBride2008). Our results showed that HC goats had greater rumen-digestible organic substrates including propionate, butyrate, valerate, isovalerate and total VFA concentrations than LC. However, the mechanism underlying the increase of milk protein still needs further study.
Effects of diet on hepatic gluconeogenesis and energy status
In ruminants, the process of gluconeogenesis is not only for maintaining adequate glucose supply for the mammary glands but also for adequate energy supply for metabolism. Glucose availability for direct absorption is low in an HC diet enriched with more soluble carbohydrates and starch due to their faster fermentation by microbes (Young, Reference Young1977). Instead, VFAs, especially propionate, are released as the major end products for gluconeogenesis. In this study, enzymes involved in hepatic glucose metabolism including HK and pyruvate kinase did not show a significant difference in genes expression and enzyme activities between HC and LC goats. However, the key factors controlling hepatic gluconeogenesis including G6Pase and PEPCK as well as PEPCK1 were significantly up-regulated showing greater mRNA expression and enzymatic activities in HC goats compared with LC. It is reported that the activation of these enzymes is at least partially dependent upon the transcriptional level (Aschenbach et al., Reference Aschenbach, Kristensen, Donkin, Hammon and Penner2010). In this study, a significant increase of histone-3-lysine-27-acetylation on the promoters of G6Pase and PC as well as PEPCK1 was observed in the liver of HC goats, indicating that an epigenetic regulatory mechanism is involved in gluconeogenic genes expression at the transcriptional level.
The liver controls metabolism and is responsible for nutrient partitioning as well as for supplying energy through gluconeogenesis and FA oxidation (Bobe et al., Reference Bobe, Young and Beitz2004; Aschenbach et al., Reference Aschenbach, Kristensen, Donkin, Hammon and Penner2010; Sejersen et al., Reference Sejersen, Sorensen, Larsen, Bendixen and Ingvartsen2012). In the present study, the hepatic concentrations of ATP and NAD were significantly increased in the HC group, which may indicate a sufficient energy supply in the liver. The process for ATP generation may be dependent on VFA uptake, which can generate ATP via the tricarboxylic acid pathway (van Knegsel et al., Reference Vanhatalo, Varvikko and Huhtanen2005). In addition, we also found that wet liver weight and the relative weight of the liver to BW were markedly increased in HC goats, and paralleled an increase of hepatic lipids content. However, the mechanism behind these changes is still unknown.
Effects of diet on plasma lipid metabolites and hepatic lipid synthesis
Several epidemiological studies have shown a strong correlation between the amount of concentrate fed and the occurrence of acidosis, fatty liver and laminitis (Dougherty et al., Reference Dougherty, Coburn, Cook and Allison1975; Nagaraja et al., Reference Nagaraja, Fina, Bartley and Anthony1978). In this study, both hepatic TG and plasma NEFA concentrations were significantly increased in HC goats, which coincides with accumulation of TG in the liver. The conventional view on fatty liver in dairy animals is that a negative energy balance causes body to mobilize FA from fat deposits, resulting in an increased concentration of NEFA in blood especially during the transition stage (Grummer, Reference Grummer1993). To the goat in mid lactation, however, feeding an HC diet also caused NEFA increase in blood via elevated lipogenic nutrients (C2) (e.g. acetate) (van Knegsel et al., Reference Vanhatalo, Varvikko and Huhtanen2005). In this study, plasma cholesterol and LDL-C concentrations were significantly increased in HC goats, but plasma TG concentration was markedly decreased in HC group, which might be associated with an increase of AMPK activity in the liver (Andreelli et al., Reference Andreelli, Foretz, Knauf, Cani, Perrin, Iglesias, Pillot, Bado, Tronche, Mithieux, Vaulont, Burcelin and Viollet2006). AMPK is a nutrient and energy sensor that controls energy homeostasis involved in glucose and lipid metabolism (Hardie et al., Reference Hardie, Ross and Hawley2012). We found a decrease of plasma TG concentration but a significant up-regulation of hepatic AMPK phosphorylation in HC goats.
The expression of lipogenic gene, including FASN, SCD1, DGAT1, DGAT2 and SREBP-1c in the liver was significantly up-regulated in HC goats. The up-regulation of FASN and SCD1 mRNA indicates an increase of de novo FA synthesis in HC goats. As an important transcriptional factor that targets the regulation of FASN and SCD1 mRNA expression, SREBP-1 plays a critical role in regulating lipid synthesis (Peterson et al., Reference Peterson, Matitashvili and Bauman2004). Our results showed that SREBP-1c was significantly up-regulated in HC goats. Moreover, the increase of DGAT gene expression is associated with greater TG synthesis, which was consistent with a marked increase in hepatic TG concentration in HC goats.
In conclusion, lactating goats fed an HC diet for 10 weeks produced more milk fat and protein that was associated with up-regulated gene expression and enzyme activities involved in hepatic gluconeogenesis and lipogenesis as well as a significant increase in energy storage in the liver. Moreover, an epigenetic regulatory mechanism appears to be involved in gluconeogenic genes expression at the transcriptional level.
Acknowledgments
This work was supported by the National Basic Research Program of China (Project No. 2011CB100802), the National Nature Science Foundation of China (Project No. 31272470) and a Project Funded by the Priority Academic Program Development of Jiangsu Higher Education Institutions (PAPD).
Supplementary Material
To view supplementary material for this article, please visit http://dx.doi.org/10.1017/S1751731116001701