I. INTRODUCTION
The crystallography of the phase transformation reveals a specific orientation relationship between the parent phase and product phase. Because of the crystal symmetry of the parent phase, there are a number of possible product orientations or crystallographic variants, such as transformation from body-centered cubic (BCC) to hexagonal crystal system in titanium and zirconium alloys.Reference Gey and Humbert1−Reference Wenk, Lonardelli and Williams3 Recently, regarding the phase transformation between the face-centered cubic (FCC) and BCC crystals, Bain, Nishiyama–Wassermann (N–W), and Kurdjumov–Sachs (K–S) relationships have been observed in several alloys.Reference Davies, Kallend and Morris4−Reference Morito, Tanaka, Konishi, Furuhara and Maki13 Whereas almost the whole studies are focused either on the statistical results of the orientation relationship between the parent phase and the product phase or on the variant selection of the product phase during phase transformation at cooling course (down-transformation),Reference Davies, Kallend and Morris4,Reference Yoshinaga, Ushioda, Itami and Akisue8−Reference Morito, Tanaka, Konishi, Furuhara and Maki13 only a few studies investigate the variant selection of phase transformation at heating course (up-transformation),Reference Romero, Preuss and Quinta da Fonseca14,Reference Miyamoto, Iwata, Takayama and Furuhara15 especially in a Cu–Zn alloy.
It is well known that if a grain boundary misorientation produced by up-transformation leads to crystallographic variant selection on the down-transformation, then this would have a marked effect on the transformation texture after a reversible phase transformation. Therefore, variant selection relates to the transformation mechanism and it is important and necessary to investigate the variant selection on the up-transformation. However, due to the experimental difficulties to determine the crystallographic evolution mechanism of the high temperature phase, the corresponding information of variant selection is still an open question. Hence, it is necessary to explore a simple and convenient method to investigate the variant selection at up-transformation.
Electric treatment as a special method to change the material's mechanical and physical properties has been widely utilized.Reference Conrad, Sprecher and Nabarro16−Reference Zhou, Zhang, Guo and He24 Conrad and Sprecher have proposed that the application of an electric current during aging, crystallization, or recrystallization of metals and alloys could offer potential for reducing temperature and improving properties, and by rapid solidification or other means, nonequilibrium structures could be obtained.Reference Conrad, Guo and Sprecher17,Reference Conrad18 Zhu et al. have proposed that the current density played important roles both in significantly accelerating the diffusional phase transformations and in the prompt responses of the electropulsing against the instant stress and the plasticity.Reference Hu, Zhu, Shek and Tang19,Reference Zhu, To, Lee, Liu, Jiang and Tang20 He et al. have proposed that the applied external electric field might retard recrystallization.Reference He, Zhang, Wang, Zhao, Zuo and Esling21 It is worth noting that the application of the current density in their work is about 10∼103 A mm−2. Therefore, to obtain the nonequilibrium structures and to accelerate the diffusional phase transformation, the high current density electric current pulses (ECPs) (current density higher than 104 A mm−2) are used in this work. It has been reported that the ECP is able to heat a piece of bulk material to a high temperature in very short time about several microseconds and then the unstable high temperature states are preserved at ambient temperature by rapid cooling.Reference Zhou, He, Gao, Zhao and Guo22−Reference Wang, Guo, Wang, Wu and Wang25 Zhang et al. have reported that instead of conventional quenching martensitic transformation from β-Ti to α-Ti,Reference Zhang, Zhao, Li and Sui23 unusual martensitic transformation from α-Ti to β-Ti induced by rapid heating could be achieved simply by using ECPs. Zhou and Wang have proposed that ECPs could enhance the phase transformation nucleation rate by dramatically reducing the diffusion activation energy.Reference Zhou, Zhang, Guo and He24,Reference Wang, Guo, Wang, Wu and Wang25 Therefore, ECPs might be a reasonable and convenient method to investigate the corresponding variant selection on the up-transformation.
In this work, the novelty and merits of the ECP on studying variants' evolution during heating course will be demonstrated by using a Cu–Zn alloy. And the orientation relationship between the parent and product phase, and that between the variants of the product phase, are all calculated and determined based on the electron backscatter diffraction (EBSD) data.
II. EXPERIMENTAL PROCESS
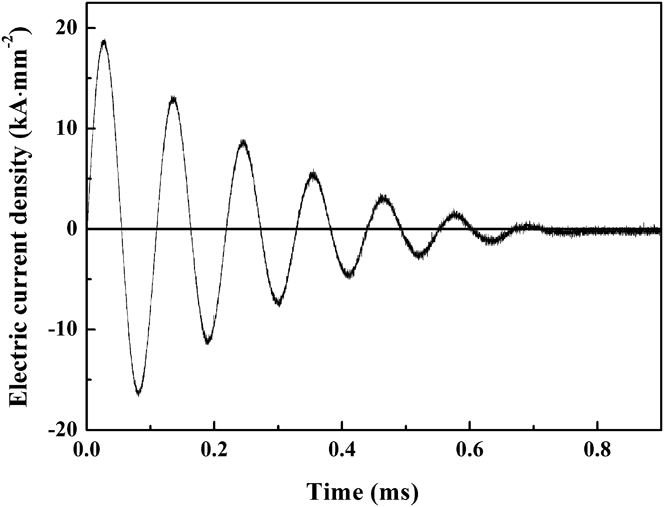
A 40% reduction in thickness direction of a cold-rolled commercial Cu–Zn alloy sheet with a composition of Cu 63.8 mass% and Zn 36.2 mass% was used as the research object in this study. By using the electrospark discharge technique, dog-bone-shaped samples 10 mm gage length, 5 mm width, and 1 mm thick were prepared, and the sizes of the two ends were much larger than the size of the gage part. Thus, the current density was much higher in the gage part than in the two ends. During the ECP process, the two ends of each sample were put into copper electrodes. Then the temperature rise of the two ends was very small and could be regarded as room temperature. Due to the cooling effect of the two cool ends, a higher cooling rate could be obtained in the gage part of the sample during cooling. The single ECP was produced through a discharge of capacitor banks under ambient conditions, and its waveform was detected to be a damped oscillation wave using a Rogowski coil and a TDS3012 digital storage oscilloscope (Tektronix, Beaverton, Oregon).26 As shown in Fig. 1, the waveforms of the current densities (j) versus the applying time of the ECP utilized in this study (t) were approximately described as damped sinusoids with the maximum current density j max = 17.6 kA mm−2. Their periods (t p) and pulse durations (t d) were almost the same at about 110 μs and 700 μs, respectively.
The typical waveform of the ECP.

EBSD observation was conducted on a JEOL JSM-7100F scanning electron microscope (SEM; JEOL, Akishima, Japan) equipped with HKL's Channel 5 software (Oxford instruments HKL, Hobro, Denmark). The accelerating voltage was 15 kV, and the “beam-controlled” mode was applied with a step size of 0.2 μm. To remove the residual deformation of the surface layer, all specimen surfaces were mechanically ground and polished, and subsequently electropolished with 47.4% water (H2O), 23.7% ethanol (C2H5OH), 23.7% phosphoric acid (H3PO4), 4.7% isopropyl alcohol ((CH3)CHOH), and 0.5% carbamide (CH4N2O) in a volume ratio at room temperature. The chemical composition of microareas in the samples was determined by energy-dispersive spectroscopy (EDS) analysis equipped in SEM.
III. RESULT
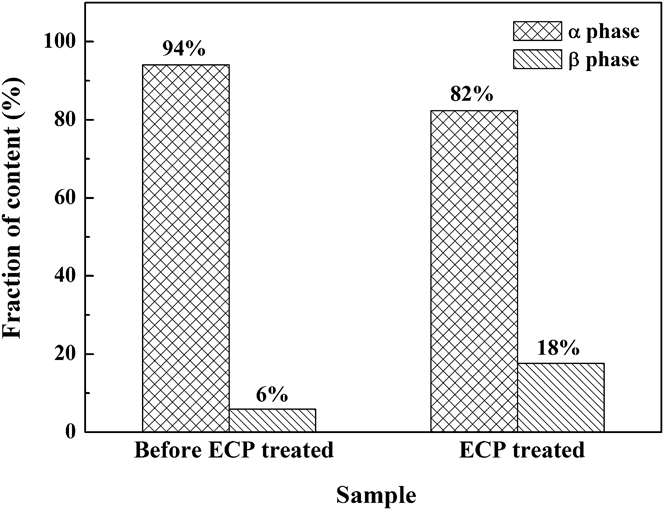
The Cu–Zn alloy selected in this study is dual phase brass. At room temperature, the lattice parameter of the predominant FCC α phase is a = 0.3615 nm, and that of the rest of the 6% BCC β phase is a = 0.2954 nm. By energy-dispersive spectroscopy analysis, the composition of the α phase is 62.94wt% Cu–37.06wt% Zn, and that of the β phase was 55.78wt% Cu–44.22wt% Zn in the samples before ECP treated, while in the ECP treated samples, the composition of the α phase is 61.84wt% Cu–38.16wt% Zn, and that of the β phase is 59.94wt% Cu–40.06wt% Zn. This implies that the diffusion between the α phase and the β phase is strong during the ECP treatment. Figure 2 illustrates the volume fractions of the β phase and α phase in the samples before and after ECP treatment. It can be seen that the volume fraction of the β phase increases from 6% to 18% due to the application of the ECP. The result implies that due to the application of ECP treatment, the product β phase forms and grows at the expense of the α phase.
The volume fraction of the α and β phases in the Cu–Zn alloy before and after ECP treatment.
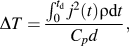
To further confirm the formation of phase transformation, the temperature increment of the samples during the ECP treatment induced by Joule heating, which is dominated by the energy input by ECP, is evaluated according to the waveforms of the ECP based on the following equationReference Conrad, Sprecher and Nabarro16
 $$\Delta T = {{\int_0^{{t_{\rm{d}}}} {{j^2}(t){\rm{\rho d}}t} } \over {{C_p}d}},$$
where j(t) is the electric current density at time t, ρ is the resistivity (0.062 × 10⁻⁶ Ω·m), t p is the pulse duration (110 μs), C p is the specific heat (378 J·kg−1·K−1), and d is the volumetric mass density (8.40 × 10³ kg·m−3) of the specimen. According to the waveform shown in Fig. 1, j max = 17.6 kA·mm−2 at t p = 110 μs, the temperature increment can be calculated as 664 K at room temperature 293 K, and the temperature of the ECP treated sample (957 K) is higher than the phase transformation temperature (953 K). Based on the theories proposed by Conrad,Reference Conrad18 the application of an electric current would offer potential for reducing temperature. Zhou and Wang have reported that the application of ECPs would dramatically reduce the diffusion activation energy and accelerate the diffusion.Reference Zhou, Zhang, Guo and He24,Reference Wang, Guo, Wang, Wu and Wang25 Meanwhile, combined with the increase of the product β phase (in Fig. 2), and the diffusion between the α phase and β phase, it is reasonable to deduce that a diffusive phase transformation takes place during current passing.
Figure 3 presents the orientation micrograph of the β phase in the matrix before and after treated by the ECP. Figure 3(a) shows the distribution of the β phase before ECP treatment. It can be found that the massive β phases assemble at triple-junctions. While after ECP treatment, the refined product β phase colored according to their orientations is formed within a single parent α grain as well as at the grain boundary. The prior α grains were clearly identified by the formation of grain-boundary-β during transformation, and the prior α grains were dispersed. As a typical example, a square area in Fig. 3(b) reveals different orientations of the refined product β phase.
The orientation distribution of the β phase (a) before ECP treated and (b) ECP treated with j max = 17.6 kA mm−2.
Figures 4(a) and 4(b) further clarify the {111} and {110} plane pole figure, and the <110> and <111> direction pole figure of the β phase variants and the closed parent α phase obtained from the above selected rectangle area shown in Fig. 3(b), respectively. The sample coordinate X 0Y 0Z 0 is shown in Fig. 3. The {110} pole figure of the selected β phase variants and the {111} pole figure of the closed parent α phase are almost overlapped. Synthetically, the <111> direction pole figure of the selected β phase variants and the <110> direction pole figure of the α phase are almost overlapped. The overlapped one implies that almost the same orientation exists between the parent phase marked with gray points and the β variants marked with color points.
The orientation relationship between the selected β variants and the closed parent α phase. (a) The {111} and {110} plane pole figure for the selected β variants and the closed parent α phase obtained from the selected rectangle area as shown in Fig. 3(b), respectively; (b) the <110> and <111> direction pole figure for the selected β variants and the closed parent α phase obtained from the selected rectangle area as shown in Fig. 3(b), respectively. The gray points represent the parent α phase and the color points marked the different orientation of the selected β variants, which are similar to those shown in Fig. 3(b). The overlapped one implies that the almost same orientation between the parent phase marked with gray points and the β variants marked with color points.
IV. DISCUSSION
The orientation data, acquired with the EBSD system and represented as Euler angles in Bunge's notation,Reference Bunge, Esling and Muller27,Reference Bunge, Esling and Muller28 have allowed us to calculate the misorientations between two adjacent grains and thus to identify their orientation relationships. Therefore, to clarify the orientation relationship between the α matrix and the β associated with nucleation from the α phase as shown in Fig. 3(b), the orientation relationship was calculated by the MATLAB calculation method. In fact, the calculated orientation relationships were first expressed in terms of a misorientation angle (ω) and the correlated rotation axis (d).Reference Cong, Zhang, Wang, Esling, Zhao and Zuo29−Reference Li, Zhang, Esling, Zhao, Wang and Zuo31 In this work, the misorientation angle and rotation axis are also used to describe the misorientation between two crystals. Owing to the cubic cell point symmetry, there exist 24 sets of misorientations, each being defined by a misorientation angle with a family of 24 equivalent rotation axes.
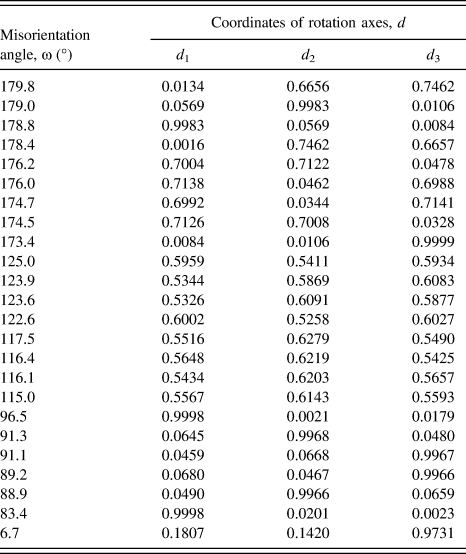
An example is given in Table I for the newly formed β phase marked with A and the α matrix with B. Conventionally, the minimum misorientation angle with its rotation axes is used to represent the misorientation between two crystals. Therefore, the Miller indices in the face-centered cell system of the marked A are <0.1807 0.1420 0.9731>, which are 6.37° away from <114>. Using the same method, the misorientation angle and its rotation axes of the colored β phase in a single α grain all can be calculated. The calculated results reveal that the colored β grains are all belong to the β phase variants with different orientations but rotated with a family of equivalent rotation axes <114> with a misorientation angle of 44.3 ± 1.5°.
The misorientation angles and rotation axes between the newly formed β crystal and the α parent in the square of Fig. 3(b), with Euler angles of (335.8 17.7 5.2) and (40.4 46.7 32.9), respectively, for β grain marked with A and α grain with B.
In terms of an axis/angle description, the K–S relation is described by 90° about <112>.Reference Stanford and Bate12 Therefore, where the parent α phase is adjacent to a β variant, the boundary between them should be close to 90° about <112>. Using EBSD data, the axis of minimum symmetric rotation across the phase boundary between α and β variants was measured and is almost exactly <114> with a misorientation angle of 44.3 ± 1.5°. The difference between 90° <112> and 44.3 ± 1.5° <114> may appear large, but the K–S relation has a variant at 42.85° <115.45>, and their axis/angle pairs are almost identical and only differ by 4.3°. The calculated orientation is in agreement with the observation shown in Fig. 4, which clarifies that the orientation relationship between the newly formed β phase variants and the α phase matrix is obeyed the K–S relation during the heating phase transformation from α → β phase transformation. It implies that there also exists a preferred nucleation of the β phase at high temperature phase transformation.
About the variant selection of β to α phase transformation in the Cu–Zn alloy, Stanford and Bate have proposed that just the large α colonies originated at the grain boundaries lead to variant selection,Reference Stanford and Bate12 and these selection processes have the strongest effect on transformation texture. However, in this work, it is found that strong variant selection can be observed during the α to β up-transformation at the elevated temperature no matter which size of the newly formed product β phase.
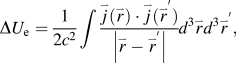
The formation of the refined unstable product β phase can be ascribed to the application of the ECP treatment. When an electric current passing through a conductor, the energy change ΔU e in the system with only one phase nucleus can be written asReference Dolinsky and Elperin32,Reference Qin and Zhou33
 $$\Delta U_{\rm{e}} = {1 \over {2c^2 }}\int {{{\mathord{\buildrel{\lower3pt\hbox{$\scriptscriptstyle\rightharpoonup$}}\over j} (\mathord{\buildrel{\lower3pt\hbox{$\scriptscriptstyle\rightharpoonup$}}\over r} ) \cdot \mathord{\buildrel{\lower3pt\hbox{$\scriptscriptstyle\rightharpoonup$}}\over j} (\mathord{\buildrel{\lower3pt\hbox{$\scriptscriptstyle\rightharpoonup$}}\over r} ^' )} \over {\left| {\mathord{\buildrel{\lower3pt\hbox{$\scriptscriptstyle\rightharpoonup$}}\over r} - \mathord{\buildrel{\lower3pt\hbox{$\scriptscriptstyle\rightharpoonup$}}\over r} ^' } \right|}}} d^3 \mathord{\buildrel{\lower3pt\hbox{$\scriptscriptstyle\rightharpoonup$}}\over r} d^3 \mathord{\buildrel{\lower3pt\hbox{$\scriptscriptstyle\rightharpoonup$}}\over r} ^' ,$$
where  $\mathord{\buildrel{\lower3pt\hbox{$\scriptscriptstyle\rightharpoonup$}}\over j}$ is the density of electric current, c = 3 × 1010 cm s−1, and
 $\left| {\mathord{\buildrel{\lower3pt\hbox{$\scriptscriptstyle\rightharpoonup$}}\over r} - \mathord{\buildrel{\lower3pt\hbox{$\scriptscriptstyle\rightharpoonup$}}\over r} ^' } \right|$ is the distance between the two electrons, respectively, at r(x, y, z) and
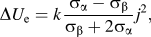
 ${r^'}({x^'},{y^'},{z^'})$. If a spherical nucleus of the β-phase has been formed inside an α-matrix of the Cu–Zn alloy with the ECP, ΔU e can be rewritten asReference Zhou, Zhang, Guo and He24,Reference Wang, Guo, Wang, Wu and Wang25,Reference Qin and Zhou33
 $$\Delta {U_{\rm{e}}} = k{{{{\rm{\sigma }}_{\rm{\alpha }}} - {{\rm{\sigma }}_{\rm{\beta }}}} \over {{{\rm{\sigma }}_{\rm{\beta }}} + 2{{\rm{\sigma }}_{\rm{\alpha }}}}}{j^2}{\rm{,}}$$
where σβ = 0.25 × 10⁸/Ω m and σα = 0.15 × 10⁸/Ω m are the conductivities of β and α phases, respectively. k is a positive geometry factor that determined by
 $$k = {n_{\rm{e}}}{\rm{\mu }}\left[ {{3 \over 2}\ln \left( {{R \over a}} \right) - {{65} \over {48}} - {5 \over {48}}{{{{\rm{\sigma }}_{\rm{\alpha }}} - {{\rm{\sigma }}_{\rm{\beta }}}} \over {{{\rm{\sigma }}_{\rm{\beta }}} + 2{{\rm{\sigma }}_{\rm{\alpha }}}}}} \right]{R^2}\Delta V{\rm{,}}$$
in which n e is the average number of stable spherical embryos (nuclei) of the new phase, μ is the magnetic susceptibility, R is the radius of the spherical α-matrix, ΔV is the volume of a nucleus, a ≈ 100 nm is the critical radius of the β-phase nucleus. For the above ideal model, since σβ > σα, ΔU e < 0 from Eq. (3). According to classical nucleation theory, the nucleation rate I e in a current-carrying system can be written as
 $${I_{\rm{e}}} = I{\rm{exp}}( - \Delta {W_{\rm{e}}}/kT){\rm{,}}$$
where I is the nucleation rate in a current-free system. In Eq. (5), due to ΔU e < 0, so I e > I, which means that the ECP can increase the nucleation rate of the β phase by the decrease of the thermodynamic barrier during phase transformation.
Since the β phase prefers to nucleate on the {110} planes with higher electric conductivity than other crystalline planes in the Cu–Zn alloy treated by the ECP, the preferred nucleation orientation of the β phase obtained from the α matrix is along the K–S relationship, {111}αphase//{110}βphase, according to Figs. 3 and 4. Moreover, no matter where the β grain origins, the orientation relationship between the variants and matrix exhibits variant selection. At the end of the heating course, the β variants have not enough time to grow under the very short pulse duration and the highest cooling rate during the cooling course; therefore, the unstable β variants are remained to room temperature and its variant evolution on the heating course can be investigated.
V. CONCLUSIONS
(1) ECPs can increase the nucleation rate of the β phase by the decrease of the thermodynamic barrier during phase transformation. The orientations of the β phase nucleated from either the α grain boundaries or the α grain interiors during the enhanced phase transformation by the ECP are all best described by the orientation relation 44.3° <114>, and it is close to the K–S relationship.
(2) The crystallographic variant selection implies that the nucleation of the β phase in the enhanced phase transformation obeys a preferred orientation selection.
(3) ECP treatment provides a new and efficient method to investigate the variant evolution during the phase transformation.
ACKNOWLEDGMENT
This work was supported by the National Nature Science Foundation of China, Grant Nos. 50901018 and 51304039, the Fundamental Research Funds for the Central Universities No. N110402008, and the Doctoral Fund of Ministry of Education of China No. 20090042120009. The authors acknowledge the help of Y. D. Zhang of LETAM, University Paul Verlaine-Metz, France, during the MATLAB calculation course; Professor J. D. Guo of Institute of Metal Research, Chinese Academy of Sciences, is also greatly acknowledged for many stimulating discussions.