





Introduction
Soybean (Glycine max (L.) Merr.) is one of the most essential food crops, known for its high protein content and vegetable oil (Jiang et al., Reference Jiang, Rajcan, Zhang, Han and Mian2023). It also provides essential omega-3 fatty acids (alpha-linolenic acid) and omega-6 fatty acids (linoleic acid) (Abdelghany et al., Reference Abdelghany, Zhang, Azam, Shaibu, Feng, Qi, Li, Tian, Hong, Li and Sun2019). These qualities make soybeans a promising solution to meet the caloric and protein demands of the growing global population. However, the crop is threatened by soybean bruchid (Callosobruchus chinensis L.), a major pest that infests dry seeds of leguminous plants (Porca, Reference Porca2003; Rees, Reference Rees2004; Onyido et al., Reference Onyido, Zeibe, Okonkwo, Ezugbo-Nwobi, Egbuche, Udemezue and Ezeanya2011), including cowpea (Vigna unguiculata L.), soybean (Glycine max (L.) Merr.), mung bean (Vigna radiata L.), pigeon pea (Cajanus cajan (L.) Huth), lablab (Lablab purpureus (L.) Sweet), faba bean (Vicia faba L.), field pea (Pisum sativum L.), and chickpea (Cicer arietinum L.).
Callosobruchus chinensis is commonly known as the adzuki bean weevil, pulse beetle, or cowpea bruchid and is a pervasive storage pest prevalent in tropical and subtropical regions (Spradbery, Reference Spradbery2013; Chandra and Girish, Reference Chandra and Girish2014). It inflicts severe damage on pulse crops both in the field and during storage (Kananji, Reference Kananji2007), with soybean yield losses in sub-Saharan Africa reported to reach 60–100% in storage (Pawlowski et al., Reference Pawlowski, Lagos-Kutz, da Fonseca Santos, Lee, Chigeza, Nachilima, Francischini and Hartman2021). Even low levels of infestation can lead to considerable damage, as one beetle alone may cause a 3.5% weight loss in cowpea seeds (Tembo et al., Reference Tembo, Pungulani, Mataa, Sohati and Munyinda2016). Complete loss of cowpea and bean grains within 3–6 months of storage has been documented (Credland, Reference Credland2000; Onyido et al., Reference Onyido, Zeibe, Okonkwo, Ezugbo-Nwobi, Egbuche, Udemezue and Ezeanya2011), while in Uganda, soybean losses of up to 27.18% have been recorded (Msiska et al., Reference Msiska, Odong, Hailay, Miesho, Kyamanywa, Rubaihayo and Tukamuhabwa2018). The pest’s rapid reproduction, short generation time, and reinfestation capacity make it particularly destructive (Yamane, Reference Yamane2013), resulting in reduced seed weight, viability, and nutritional quality due to contamination by frass, excreta, and insect remains.
In Ethiopia, C. chinensis is a major pest of chickpeas, field peas, cowpeas, and beans. Its impact on soybeans, though less studied, is increasingly evident. A recent trial in Jimma recorded weight loss as high as 91.71% after 6 months of storage in plastic bags, with further reports indicating seed damage rates of up to 99.54% across multiple soybean varieties (Shimales and Bidira, Reference Shimales and Bidira2023). These findings highlight an urgent need for research and integrated storage pest management interventions.
Although chemical insecticides remain the most effective management strategy against C. chinensis, their widespread use is constrained due to risks of toxic residues, human health concerns, and environmental contamination (Odeyemi et al., Reference Odeyemi, Daramola and Ogungbemi2006). Genetic resistance is a cornerstone of long-term, cost-effective management (Zhou et al., Reference Zhou, Arcot, Medina, Bernal, Cisneros-Zevallos and Akbulut2024). Therefore, the use of resistant cultivars may offer a safe and sustainable option for managing C. chinensis. Resistant soybean varieties may reduce dependency on external inputs and ensure consistent protection in storage environments with limited infrastructure. Resistance mechanisms, such as reduced flavonoid content, enhanced antioxidant activity, and thicker seed coats, impede oviposition and larval development (Mbata, Reference Mbata2003; I.I.T.A., 2009; Shimales and Bidira, Reference Shimales and Bidira2023). Given the severity of C. chinensis–induced damage and the vulnerability of local soybean varieties, this study aims to identify genotypes with inherent resistance under Ethiopian storage conditions.
Materials and methods
Experimental site
The study was conducted at the Plant Protection Laboratory of the Assosa Agricultural Research Center (AsARC), located in Benishangul Gumuz, Ethiopia (latitude: 10°03′ N, longitude: 34°59′ E, altitude: 1553 m.a.s.l.). The site experiences an average annual rainfall of 1177 mm and a mean temperature of 26.79°C.
Insect colony maintenance
Third-generation adults of C. chinensis used for infestation trials were sourced from a laboratory colony maintained at the AsARC. The colony originated from bruchids recovered from infested soybean grain stores in Assosa and was sustained under controlled conditions using Gizo soybean seeds. Insects were reared in 2-L plastic containers covered with muslin cloth to allow air circulation while preventing escape. To ensure continuous breeding and avoid age bias, adults were periodically transferred to fresh seeds. Morphological identification of C. chinensis L. was conducted based on diagnostic criteria established by Farrell et al. (Reference Farrell, Brier and Colins2015), confirming the species’ identity prior to experimentation.
Soybean genotypes and experimental design
This study evaluated 50 soybean genotypes, including 48 genotypes from the Jimma Agricultural Research Center and 2 genotypes (Belesa-95 and Gishama) obtained from the AsARC (table 1). To ensure the exclusion of pre-existing insect contamination, all seed samples were oven-dried at 30°C for 24 h following the method described by Amusa et al. (Reference Amusa, Ogunkanmi, Adetunbi, Akinyosoye, Bolarinwa and Ogundipe2014). The dried seeds were then conditioned on laboratory shelves for 7 days at ambient temperature to equilibrate moisture levels before infestation (Kananji, Reference Kananji2007).
List of 50 soybean genotypes used in this study

Table 1 Long description
Two side by side code and genotypes columns list soybean genotype identifiers and their corresponding genotype names. The left pair lists G 2, Pawe 03; G 3, S1180 slash 5 slash 54; G 4, Dundee; G 5, 5002T; G 6, SC STATUS; G 7, JM CLK slash CRFD 15 SD; G 8, TGX 2014 49FZ; G 9, TGX 2021 03FZ; G 11, JM PI230970 slash PI635999 020 T14 S45; G 12, Lukanga; G 13, MAKSOY 4N; G 15, MAKSOY 6N; G 16, S1146 slash 5 slash 25; G 17, S1150 slash 5 slash 22; G 19, SC Squire; G 20, SCS 1; G 21, SNKGM001; G 22, SNKGM004; G 23, TGX 2001 13DM; G 25, TGX 2014 19FM; G 26, Gazala; G 27, JM PI230970 slash PI635999 020 T14 S33; G 28, PI594796; G 29, PI423958; G 30, PI423961A. The right pair lists G 31, JM SCS 1 slash PI605891B 020 T5 S4; G 32, PI471904; G 33, JM PI230970 slash PI635999 020 T14 S37; G 34, JM PI230970 slash PI635999 020 T14 S11; G 35, JM PI230970 slash PI635999 020 T14 S15; G 36, JM PI230970 slash PI635999 020 T14 S18; G 38, JM PI635999 slash F6LG04 5196 LG06 5920 020 T3 S5; G 39, JM PI230970 slash PI635999 020 T14 S26; G 40, JM PI230970 slash PI635999 020 T14 S36; G 41, JM PI230970 slash PI635999 020 T14 S23; G 42, JM PI230970 slash PI635999 020 T14 S16; G 44, JM PI230970 slash PI635999 020 T14 S43; G 45, JM PI230970 slash PI635999 020 T14 S30; G 46, JM PI230970 slash PI635999 020 T14 S20; G 48, JM PI230970 slash PI635999 020 T14 S27; G 49, JM PI230970 slash PI635999 020 T14 S22; G 51, JM PI230970 slash PI635999 020 T14 S10; G 53, Guda; G 54, JM PI230970 slash PI635999 020 T14 S42; G 55, AFGAT; G 56, JM PI230970 slash PI635999 020 T14 S21; G 58, JM PI230970 slash Clark 63K 020 T15 S1; G 61, JM PI230970 slash PI635999 020 T14 S40; G 62, Belesa 95; and G 63, Gishama. Codes are not continuous, with several numbers missing between listed entries.
From each genotype, 50 seeds were randomly selected and weighed to establish initial seed mass. The 50 seeds were placed in plastic Petri dishes (9 cm diameter) and infested using the no-choice test protocol outlined by Somta et al. (Reference Somta, Somta, Tomooka, Ooi, Vaughan and Srinives2008). Each dish received one female and two to three male adult C. chinensis (1–2 days old), with sexes identified based on external morphological characteristics (Farrell et al., Reference Farrell, Brier and Colins2015). The experiment followed a randomised complete block design with two replications per genotype. Infesting adults were removed after 10 days to prevent overlapping generations and ensure consistent pest pressure (Kananji, Reference Kananji2007).
Data collection and resistance indices
On the 11th day following infestation, the number of eggs deposited on the seeds was recorded, following the procedure outlined by Kananji (Reference Kananji2007). Emerged adult insects were subsequently counted and removed daily until no emergence was observed for 5 consecutive days, as described by Lephale et al. (Reference Lephale, Addo-Bediako and Ayodele2012). Following the final emergence assessment, the remaining seeds in each Petri dish were weighed to determine post-infestation weight:
a. Grain weight loss percentage (GWL%): This represents the economic loss due to insect damage and was calculated using the formula proposed by Amusa et al. (Reference Amusa, Ogunkanmi, Adetunbi, Akinyosoye, Bolarinwa and Ogundipe2014):
 ${\text{GWL}}\% = \frac{{{\text{IGW}} - {\text{FGW}}}}{{{\text{IGW}}}}{\text{ }} \times {\text{ }}100$, where IGW is the initial grain weight (g) and FGW is the final grain weight (g).
b. Growth index (GI): This reflects the suitability of each genotype for the development of C. chinensis, based on the formula by Régnière et al. (Reference Régnière, Powell, Bentz and Nealis2012):
 \begin{equation*}{\text{GI = }}\frac{{\% {\text{Adult emergence}}}}{{{\text{Median development period}}}}\end{equation*}
The median development period (MDP) was defined as the number of days elapsed from the fifth day after oviposition to the emergence of the first adult, following Kananji (Reference Kananji2007).
c. Dobie’s susceptibility index (DSI): This quantifies the susceptibility of seed samples to bruchid damage, incorporating both the number of emerged adults and the MDP, as defined by Dobie (Reference Dobie1974):
 \begin{equation*}{\text{DSI}} = {\text{ }}\frac{{{\text{Lo}}{{\text{g}}_{\text{e}}}\left( {{\text{Total adults emerged}}} \right){\text{ }} \times {\text{ }}100}}{{{\text{MDP}}}}\end{equation*}
A DSI score of 0 was assigned if no adult insects emerged (Derera et al., Reference Derera, Giga and Pixley2001). Based on DSI values, soybean genotypes were classified into susceptibility categories as follows (Kananji, Reference Kananji2007; Radha and Susheela, Reference Radha and Susheela2014): resistant when DSI = 0–1, moderately resistant (DSI = 2–3), susceptible (DSI = 4–5), and highly susceptible (DSI = 6–9).
Data analysis
Statistical analyses were conducted to evaluate genotypic variation in resistance traits using a randomised complete block design model across 2 years as follows:
 \begin{equation*}{y_{ijk}} = \mu + {Y_i} + {B_{j\left( i \right)}} + {G_k} + {\left( {GY} \right)_{ik}} + {\varepsilon _{ijk}},\end{equation*}
where  ${y_{ijk}}$ is the observed resistance trait,
 $\mu {\text{ }}$is the overall mean,
 ${Y_i}$ is the fixed effect of year i,
 ${B_{j\left( i \right)}}{\text{ }}$is the effect of replication j nested within year i,
 ${G_k}$ is the fixed effect of genotype k,
 ${\left( {GY} \right)_{ik}}$ is the genotype × year interaction, and εijk is the random error. Analysis of variance was performed in R Statistical software (R Core Team, 2023) to determine the significance of differences among soybean genotypes for each resistance parameter. Treatment means were separated using Tukey’s Honestly Significant Difference (HSD) at a 5% probability level. Based on the mean values of DSI, genotypes were classified into distinct resistance categories. To further investigate the relationships among measured traits, such as grain weight loss, adult emergence, MDP, and GI, regression and Pearson’s correlation analyses were conducted, following the approach of Amusa et al. (Reference Amusa, Ogunkanmi, Bolarinwa and Ojobo2013).
Results
Oviposition preference
This study revealed substantial genotypic variation in response to C. chinensis oviposition and infestation dynamics. Egg counts ranged from 24.50 to 77.25 across genotypes (table 2), with Gishama (G-63) – a widely cultivated variety in Assosa – recording the highest oviposition. In contrast, genotypes SCS-1 (G-20), TGX 2001-13DM (G-23), JM-PI230970/PI635999-020-T14-S43 (G-44), and JM-PI635999/F6LG04-5196-LG06-5920-020-T3-S5 (G-38) demonstrated significantly lower egg deposition, indicating resistance.
Soybean genotypes’ response to C. chinensis in Assosa, Ethiopia (2023–2024)

Table 1 Long description
Soybean genotypes G-2 through G-63 are compared across five measures: No. of eggs, MDP in days, Growth index with letter groups, No. of adults emerged, and percent Adult emerged with letter groups. No. of eggs ranges from 24.25 for G-41 and 25.50 for G-20 up to 77.25 for G-63 and 75.50 for G-49. MDP ranges from 48.00 for G-53 and 49.25 for G-55 up to 69.50 for G-21 and 63.25 for G-42. Growth index values range from 0.14 for G-44 with letter c to 1.39 for G-3 with letter a, with 1.12 for G-15 labeled ab and several genotypes at 0.15 to 0.20 labeled bc. No. of adults emerged ranges from 2.25 for G-38 and 2.25 for G-44 up to 34.00 for G-63 and 32.75 for G-34. Percent Adult emerged ranges from 7.33 for G-44 with letter d and 8.61 for G-38 with letter cd up to 57.71 for G-15 with letter a and 54.30 for G-13 with letter ab; other higher values include 52.28 for G-22 with letter abc and 48.29 for G-3 with letter abcd. Summary rows report Mean values of 46.61 eggs, 56.14 days MDP, 0.52 growth index, 14.34 adults emerged, and 28.10 percent adult emerged, plus Tukeys HSD, CV, and P value entries for each numeric column.
CV is the coefficient of variance (%); HSD is the Tukey’s minimum significant difference; P value is a probability value; and means with the same alphabet were not statistically different within the column.
Adult emergence
Adult emergence followed a similar trend to egg loads, ranging from 2.25 to 34.00 individuals (table 2). Gishama (G-63) again showed the highest emergence, while JM-PI635999/F6LG04-5196-LG06-5920-020-T3-S5 (G-38) and JM-PI230970/PI635999-020-T14-S43 (G-44) recorded the lowest, reinforcing their resistant profiles. Notably, genotypes G-8 (TGX 2014-49FZ), G-62 (Belesa-95), and G-32 (PI471904) also exhibited reduced emergence percentages, supporting their potential as resistant lines.
Developmental timing
The MDP varied significantly (P < 0.001), spanning from 48.00 to 69.50 days (table 2). Longer development durations were observed in genotypes G-21 (SNKGM001), G-20, G-8, G-62, G-45, G-4, and G-51, suggesting enhanced resistance.
Growth potential
GI values also varied, with G-3 (S1180/5/54) recording the highest (table 2), indicating high susceptibility. Conversely, G-44, G-38, G-8, G-62, and G-32 displayed lower GI values, consistent with their reduced pest proliferation potential.
Weight loss and DSI
Infestation-induced weight loss ranged from 0.12% to 39.04% (P < 0.05). Genotypes G-8, G-32, G-44, and G-5 exhibited the lowest losses, while G-4, G-3, G-36, G-28, G-34, and G-63 showed the highest losses (table 3). Based on DSI classification (table 4), genotypes G-44 and G-38 were classified as resistant. Sixteen genotypes showed moderate resistance, 21 were susceptible, and 11 highly susceptible, underscoring wide genetic variability.
Soybean weight loss due to C. chinensis infestation at Assosa, Ethiopia (2023–2024)

Table 1 Long description
Per cent weight loss is reported for soybean genotypes, with a range and a mean for each genotype, presented in two side by side genotype columns. The lowest mean is 2.78 for G-8 with a range of 2.36 to 3.61, followed by 3.03 for G-32 with a range of 0.91 to 6.00 and 3.24 for G-44 with a range of 0.12 to 6.14. Means in the mid range include 4.34 for G-7 with a range of 2.56 to 7.40, 5.28 for G-17 with a range of 2.17 to 7.45, and 6.95 for G-55 with a range of 4.06 to 11.59. Higher means include 9.88 for G-58 with a range of 7.37 to 11.16, 11.71 for G-36 with a range of 2.56 to 28.88, 12.44 for G-3 with a range of 1.37 to 27.30, and 12.52 for G-4 with a range of 2.00 to 39.04. The widest range shown is for G-4, from 2.00 to 39.04, and another wide range is for G-28, from 2.95 to 32.48 with a mean of 11.07. Summary rows list an overall mean of 6.22, Tukeys HSD of 12.93, CV of 71.26, and P value of 0.05.
CV is the coefficient of variance (%); HSD is the Tukey’s minimum significant difference; P value is a probability value; and means with the same alphabet were not statistically different within the column.
Dobie’s susceptibility indexes and resistance responses of soybean genotypes to C. chinensis infestation in Assosa, Ethiopia (2023–2024)

Table 1 Long description
Two side by side code and genotypes columns list soybean genotype names paired with codes. Left column pairs are: G-2, Pawe 03; G-3, S1180/5/54; G-4, Dundee; G-5, 5002T; G-6, SC STATUS; G-7, JM-CLK/CRFD-15-SD; G-8, TGX 2014-49FZ; G-9, TGX 2021-03FZ; G-11, JM-PI230970/PI635999-020-T14-S45; G-12, Lukanga; G-13, MAKSOY 4N; G-15, MAKSOY 6N; G-16, S1146/5/25; G-17, S1150/5/22; G-19, SC Squire; G-20, SCS-1; G-21, SNKGM001; G-22, SNKGM004; G-23, TGX 2001-13DM; G-25, TGX 2014-19FM; G-26, Gazala; G-27, JM-PI230970/PI635999-020-T14-S33; G-28, PI594796; G-29, PI423958; G-30, PI423961A. Right column pairs are: G-31, JM-SCS-1/PI605891B-020-T5-S4; G-32, PI471904; G-33, JM-PI230970/PI635999-020-T14-S37; G-34, JM-PI230970/PI635999-020-T14-S11; G-35, JM-PI230970/PI635999-020-T14-S15; G-36, JM-PI230970/PI635999-020-T14-S18; G-38, JM-PI635999/F6LG04-5196-LG06-5920-020-T3-S5; G-39, JM-PI230970/PI635999-020-T14-S26; G-40, JM-PI230970/PI635999-020-T14-S36; G-41, JM-PI230970/PI635999-020-T14-S23; G-42, JM-PI230970/PI635999-020-T14-S16; G-44, JM-PI230970/PI635999-020-T14-S43; G-45, JM-PI230970/PI635999-020-T14-S30; G-46, JM-PI230970/PI635999-020-T14-S20; G-48, JM-PI230970/PI635999-020-T14-S27; G-49, JM-PI230970/PI635999-020-T14-S22; G-51, JM-PI230970/PI635999-020-T14-S10; G-53, Guda; G-54, JM-PI230970/PI635999-020-T14-S42; G-55, AFGAT; G-56, JM-PI230970/PI635999-020-T14-S21; G-58, JM-PI230970/Clark-63K-020-T15-S1; G-61, JM-PI230970/PI635999-020-T14-S40; G-62, Belesa-95; G-63, Gishama.
CV is the coefficient of variance (%); HSD is the Tukey’s minimum significant difference; P value is a probability value; means with the same alphabets were not statistically different within the column.
R, resistant; MR, moderately resistant; S, susceptible; HS, highly susceptible.
Association of resistance traits in soybean genotypes
Correlation analysis (table 5) revealed that egg count positively correlated with adult emergence, weight loss, GI, and DSI, indicating that high oviposition contributes to greater infestation severity. Adult emergence was strongly associated with GI (r = 0.57), DSI (r = 0.54), and weight loss (r = 0.62), while negatively correlated with MDP (r = −0.43), reinforcing its importance in pest impact evaluation.
Pearson’s correlation coefficients (r) for experimental traits in C. chinensis no-choice assays

Table 1 Long description
Pearson correlation coefficients are listed among traits labeled NE, per cent adult emergence, number of adults emerged, per cent weight loss, median development period, growth index, and Dobie susceptibility index. NE correlates 0.23 with per cent adult emergence, 0.70 with number of adults emerged, 0.26 with per cent weight loss, minus 0.05 marked ns with median development period, 0.22 with growth index, and 0.64 with Dobie susceptibility index. Per cent adult emergence correlates 0.75 with number of adults emerged, 0.26 with per cent weight loss, minus 0.26 with median development period, 0.91 with growth index, and 0.77 with Dobie susceptibility index. Number of adults emerged correlates 0.62 with per cent weight loss, minus 0.20 with median development period marked with two asterisks, 0.69 with growth index, and 0.81 with Dobie susceptibility index. Per cent weight loss correlates minus 0.05 marked ns with median development period, 0.28 with growth index, and 0.30 with Dobie susceptibility index. Median development period correlates minus 0.40 with growth index and minus 0.42 with Dobie susceptibility index. Growth index correlates 0.75 with Dobie susceptibility index.
ns, not significant; NE, number of eggs; %AE, per cent adult emergence; NAE, number of adults emerged; %WL, per cent weight loss; MDP, median development period; GI, growth index; DSI, Dobie’s susceptibility index.
*** Significant at P < 0.001.
** Significant at P < 0.01.
Weight loss correlated positively with GI (r = 0.28) and DSI (r = −0.30) but showed minimal association with MDP (r = −0.05). MDP, however, negatively correlated with both GI (r = −0.40) and DSI (r = −0.42), affirming the role of delayed development in resistance.
Predictive insights from regression analysis
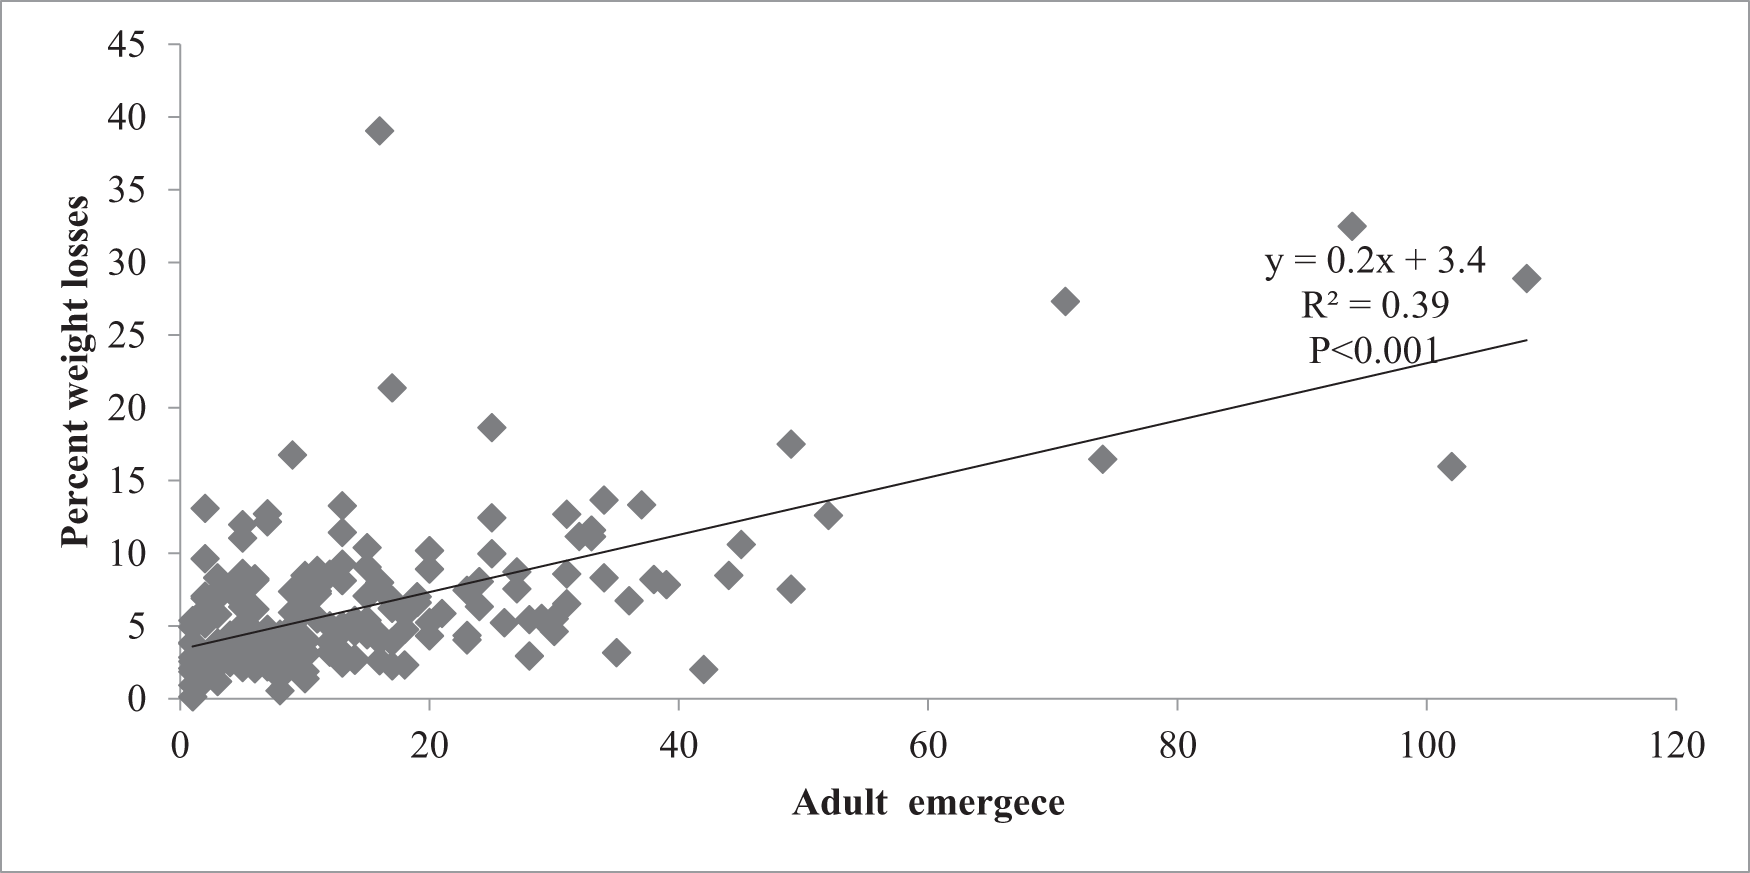
Regression analysis further confirmed adult emergence as a significant predictor of weight loss, accounting for 38.78% of its variation (fig. 3). Each additional emerged adult corresponded to a 0.2% increase in seed weight loss, highlighting the direct contribution of pest survival to post-harvest deterioration.
The most resistant genotype JM-PI230970/PI635999-020-T14-S43 (G-44).

The highly susceptible genotype SNKGM004 (G-22).

Regression of per cent weight loss in soybean seeds against adult bruchid emergence for 50 genotypes.

Discussion
This study revealed substantial variation in oviposition preference, developmental performance, and infestation outcomes of C. chinensis across tested soybean genotypes (table 6). These results are consistent with Msiska et al. (Reference Msiska, Odong, Hailay, Miesho, Kyamanywa, Rubaihayo and Tukamuhabwa2018), who reported genotype-dependent resistance to C. chinensis.
Analysis of variance for key variables assessing soybean resistance to C. chinensis in Assosa, Ethiopia (2023–2024)

Table 6 Long description
Analysis of variance values are listed by source of variation for number of eggs, per cent adult emergence, adult emergence, per cent weight loss, MDP days, GI, and DSI, with degrees of freedom. For year with 1 degree of freedom, values are 710.65 for number of eggs, 1973.12 with two asterisks for per cent adult emergence, 367.21 for adult emergence, 490.86 with three asterisks for per cent weight loss, 112.50 for MDP days, 1.28 with three asterisks for GI, and 4.87 for DSI. For replication year with 2 degrees of freedom, values are 7258.98 with three asterisks for number of eggs, 277.75 for per cent adult emergence, 294.37 for adult emergence, 40.98 for per cent weight loss, 112.45 for MDP days, 0.20 for GI, and 26.58 with three asterisks for DSI. For genotypes with 49 degrees of freedom, values are 650.58 for number of eggs, 618.83 with three asterisks for per cent adult emergence, 296.08 for adult emergence, 27.22 for per cent weight loss, 62.68 with three asterisks for MDP days, 0.28 with three asterisks for GI, and 6.76 with three asterisks for DSI. For genotype by year with 49 degrees of freedom, values are 959.17 for number of eggs, 254.96 for per cent adult emergence, 295.88 for adult emergence, 33.25 with two asterisks for per cent weight loss, 47.75 for MDP days, 0.16 for GI, and 3.52 for DSI. Residuals with 99 degrees of freedom are 753.10 for number of eggs, 235.83 for per cent adult emergence, 252.15 for adult emergence, 19.63 for per cent weight loss, 29.80 for MDP days, 0.11 for GI, and 2.95 for DSI. Summary rows list mean values of 46.61 for number of eggs, 28.10 for per cent adult emergence, 14.34 for adult emergence, 6.22 for per cent weight loss, 56.14 for MDP days, and 0.52 for GI, with no mean shown for DSI; CV values of 58.88, 54.65, 110.77, 71.26, 9.72, and 63.29 are shown for the same columns, with no CV shown for DSI. Tukeys HSD values are 80.09 for number of eggs, 44.82 for per cent adult emergence, 46.35 for adult emergence, 12.93 for per cent weight loss, 15.93 for MDP days, 0.97 for GI, and 5.01 for DSI.
DF, degrees of freedom; DSI, Dobie’s susceptibility index; GI, growth index; MDP, median development period (days).
*** Significant at P < 0.001.
** Significant at P < 0.01.
Oviposition preference
Genotype Gishama (G-63), a widely cultivated variety in Assosa, exhibited the highest oviposition rates, indicating high susceptibility. This preference is likely due to physical traits such as large seed size, smooth surface texture, and thin seed coats (Msiska et al., Reference Msiska, Odong, Hailay, Miesho, Kyamanywa, Rubaihayo and Tukamuhabwa2018; Elsawy et al., Reference Elsawy, El-Talpanty, Mohamed and Morsy2024), which favour bruchid attachment and egg deposition. The elevated risk of pest outbreak associated with Gishama highlights the need for targeted management in regions where this variety dominates. In contrast, genotypes JM-PI230970/PI635999-020-T14-S23 (G-41), SCS-1 (G-20), JM-PI230970/PI635999-020-T14-S43 (G-44), and JM-PI635999/F6LG04-5196-LG06-5920-020-T3-S5 (G-38) recorded significantly lower egg loads, suggesting resistance traits. These may be attributed to defensive compounds, such as tannins and antioxidants (Cope and Fox, Reference Cope and Fox2003; Sharma and Thakur, Reference Sharma and Thakur2014; Msiska et al., Reference Msiska, Odong, Hailay, Miesho, Kyamanywa, Rubaihayo and Tukamuhabwa2018), or physical barriers like thicker seed coats (Naseri et al., Reference Naseri, Ebadollahi and Hamzavi2022; Ventury et al., Reference Ventury, Ferreira, De Moura Rocha, Do Amaral Gravina, Da Silva Ferreira, Perales, Fernandes and Oliveira2022).
Adult emergence
Gishama (G-63) also recorded the highest adult emergence (34.00), aligning with its oviposition rates and confirming its susceptibility (Msiska et al., Reference Msiska, Odong, Hailay, Miesho, Kyamanywa, Rubaihayo and Tukamuhabwa2018; Mukuze et al., Reference Mukuze, Msiska, Badji, Obua, Kweyu, Nghituwamhata, Rono, Maphosa, Kasule and Tukamuhabwa2023). Conversely, G-38 and G-44 exhibited the lowest emergence (2.25), reinforcing their resistance to bruchids. Resistant varieties typically possess traits such as tough or rough seed coats, which impair larval development and survival (Pessu and Umeozor, Reference Pessu and Umeozor2004; Vishwakarma, Reference Vishwakarma2013).
Developmental timing
Significant differences in MDP among genotypes indicate varied resistance levels. Eight genotypes exhibited extended MDPs, likely due to harder seed textures and elevated tannin and antioxidant levels, which suppress larval progression and reduce emergence (Msiska et al., Reference Msiska, Odong, Hailay, Miesho, Kyamanywa, Rubaihayo and Tukamuhabwa2018; Mukuze et al., Reference Mukuze, Msiska, Badji, Obua, Kweyu, Nghituwamhata, Rono, Maphosa, Kasule and Tukamuhabwa2023). The observed influence on MDP and GI points to underlying biochemical variation, specifically, reduced flavonoid concentrations and increased defensive compounds (Msiska et al., Reference Msiska, Odong, Hailay, Miesho, Kyamanywa, Rubaihayo and Tukamuhabwa2018). Negative correlations between MDP, GI, and DSI (table 4) further affirm that prolonged pest development is associated with enhanced resistance.
Growth potential
Lower GI values were observed in genotypes JM-PI230970/PI635999-020-T14-S43 (G-44), JM-PI635999/F6LG04-5196-LG06-5920-020-T3-S5 (G-38), TGX-2014-49FZ (G-8), Belesa-95 (G-62), and PI471904 (G-32), indicating limited support for C. chinensis population growth (Ouedraogo et al., Reference Ouedraogo, Sou, Sanon, Monge, Huignard, Tran and Credland1996; Msiska et al., Reference Msiska, Odong, Hailay, Miesho, Kyamanywa, Rubaihayo and Tukamuhabwa2018; Mukuze et al., Reference Mukuze, Msiska, Badji, Obua, Kweyu, Nghituwamhata, Rono, Maphosa, Kasule and Tukamuhabwa2023). These genotypes likely lack nutritional or structural characteristics conducive to rapid pest proliferation and represent strong candidates for resistance breeding.
Weight loss and DSI
Weight loss variation among genotypes was considerable, with G-8, G-32, G-44, and G-5 showing the lowest mean values, reflecting superior resistance (Msiska et al., Reference Msiska, Odong, Hailay, Miesho, Kyamanywa, Rubaihayo and Tukamuhabwa2018; Msiska, Reference Msiska2019; Mukuze et al., Reference Mukuze, Msiska, Badji, Obua, Kweyu, Nghituwamhata, Rono, Maphosa, Kasule and Tukamuhabwa2023). Genotypes such as G-3, G-21, G-26, G-28, and G-36 exhibited broader ranges (1.37–39.40%), suggesting underlying genetic diversity and environmental effects on pest susceptibility (Maharjan et al., Reference Maharjan, Yi, Ahn, Roh, Park, Yoon, Jang, Baek, Kim and Bae2019; Singha and Rajkumari, Reference Singha and Rajkumari2021). However, the consistent performance of G-8, G-32, and G-44 across conditions underscores their stability and value for bruchid-resistant breeding. DSI analysis identified G-44 as the most resistant genotype, followed closely by G-38. These entries likely possess elevated levels of defensive compounds or physical barriers (Mukuze et al., Reference Mukuze, Msiska, Badji, Obua, Kweyu, Nghituwamhata, Rono, Maphosa, Kasule and Tukamuhabwa2023). Their consistent performance across infestation metrics affirms their suitability for incorporation into breeding programmes aimed at mitigating bruchid damage and enhancing the sustainability of soybean production in vulnerable regions.
Association of resistance traits in soybean genotypes
Correlation analysis revealed strong positive relationships among oviposition rate, adult emergence, GI, DSI, and seed weight loss (table 5). Genotypes with higher egg counts exhibited greater adult emergence, which in turn was associated with raised GI and DSI values. These ultimately resulted in elevated seed weight loss, indicating the direct link between reproductive success and storage damage (Vishwakarma, Reference Vishwakarma2013; Adams et al., Reference Adams, Osekre and Amoah2018; Msiska et al., Reference Msiska, Odong, Hailay, Miesho, Kyamanywa, Rubaihayo and Tukamuhabwa2018; Singha and Rajkumari, Reference Singha and Rajkumari2021; Mukuze et al., Reference Mukuze, Msiska, Badji, Obua, Kweyu, Nghituwamhata, Rono, Maphosa, Kasule and Tukamuhabwa2023; Elsawy et al., Reference Elsawy, El-Talpanty, Mohamed and Morsy2024). Furthermore, the MDP exhibited negative correlations with both DSI and GI. Genotypes with longer MDP tended to show reduced seed damage and slow population growth. This inverse relationship suggests that delayed development functions as a resistance mechanism, likely mediated by biochemical defences or physical barriers such as seed coat thickness and hardness (Msiska et al., Reference Msiska, Odong, Hailay, Miesho, Kyamanywa, Rubaihayo and Tukamuhabwa2018; Naseri et al., Reference Naseri, Ebadollahi and Hamzavi2022; Ventury et al., Reference Ventury, Ferreira, De Moura Rocha, Do Amaral Gravina, Da Silva Ferreira, Perales, Fernandes and Oliveira2022).
Predictive insights from regression analysis
The regression analysis revealed adult emergence as a statistically significant determinant of seed weight loss, explaining 38.78% of the observed variation. Specifically, each additional emerged adult was associated with an estimated 0.2% increase in weight loss. These findings align with Mphuru (Reference Mphuru1981), who linked higher adult emergence to intensive larval feeding and accelerated seed damage, and with Pessu and Umeozor (Reference Pessu and Umeozor2004), who reported that reproductive success in C. chinensis significantly exacerbates seed vulnerability. This relationship underscores the importance of selecting genotypes that suppress adult emergence through physical and biochemical resistance traits. As noted by Singha and Rajkumari (Reference Singha and Rajkumari2021), smoother seed surfaces and richer nutrient content promote oviposition and larval development, while harder seed textures and elevated tannin levels function as protective barriers (Msiska et al., Reference Msiska, Odong, Hailay, Miesho, Kyamanywa, Rubaihayo and Tukamuhabwa2018; Naseri et al., Reference Naseri, Ebadollahi and Hamzavi2022). Thus, breeding strategies aimed at reducing pest survival, especially emergence rates, hold strong predictive and practical value in mitigating infestation severity.
Conclusions
This study reveals important insights into the variability of resistance to C. chinensis among soybean genotypes. Genotypes JM-PI230970/PI635999-020-T14-S43 (G-44) and JM-PI635999/F6LG04-5196-LG06-5920-020-T3-S5 (G-38) showed resistance against C. chinensis. These resistant genotypes could be ideal candidates for breeding bruchid-resistant soybeans. Moreover, the correlation and regression analyses confirm that adult emergence significantly contributes to storage weight losses, with each additional emerged adult leading to measurable weight loss. Consequently, selecting genotypes with low susceptibility indices is paramount for mitigating losses, enhancing storage potential, and advancing sustainable soybean production. Further work can be conducted to determine the resistance mechanisms in the resistant genotypes and more research to identify additional resistant genotypes against C. chinensis. These can minimise the use of insecticides and provide healthier soybean to consumers.
Acknowledgements
The authors express their gratitude to the Ethiopian Institute of Agricultural Research for financial support and to the Jimma Agricultural Research Center for providing the soybean genotypes used in this study.
Competing interests
All authors declare that they have no conflict of interest.




 Open access

