INTRODUCTION
Biological invasions are among the most important drivers of species extinctions (Simberloff et al. Reference Simberloff, Martin, Genovesi, Maris, Aronson, Courchamp, Galil, García-Berthou, Pascal, Pysek, Sousa, Tabacchi and Vilà2013) and the number of introduced species has been increasing steeply over the last century due to human-mediated transport, such as tourism and commercial exchanges (Butchart & et al. Reference Butchart2010). One group of invasive species that is of particular concern for conservation are ants (Holway et al. Reference Holway, Lach, Suarez, Tsutsui and Case2002; Rabitsch Reference Rabitsch2011); because of their small size, they are easily transported by accident, in particular on fruits or on ornamental plants. Invasive ants have a tremendous impact on local biodiversity (Lach & Hooper-Bui Reference Lach, Hooper-Bui, Lach, Parr and Abbott2010), ecosystem functioning (Holway et al. Reference Holway, Lach, Suarez, Tsutsui and Case2002), economics (Harris & Barker Reference Harris and Barker2007), and even human and domestic animal health (Moreira et al. Reference Moreira, De Morais, Vieira-Da-Motta, Campos-Farinha and Tonhasca2005; Scanlan & Vanderwoude Reference Scanlan and Vanderwoude2006). Once established, invasive ants become very difficult to eradicate (Hoffmann et al. Reference Hoffmann, Abbott, Davis, Lach, Parr and Abbott2010).
Ants can be best controlled during the first phases of the invasion, when the population is still relatively small and confined to relatively small areas. Early detection is essential to prevent ant invasions, in particular through surveillance efforts at ports of entry (airports and maritime ports). The prioritization of surveillance should be based on assessments of the likelihood of establishment of different species. Although it is known that invasion risk depends on numerous biotic and abiotic factors, climate is thought to be the most important factor determining ant distributions at a global scale (Sanders et al. Reference Sanders, Lessard, Fitzpatrick and Dunn2007; Dunn et al. Reference Dunn, Agosti, Andersen, Arnan, Bruhl, Cerdá, Ellison, Fisher, Fitzpatrick, Gibb, Gotelli, Gove, Guenard, Janda, Kaspari, Laurent, Lessard, Longino, Majer, Menke, McGlynn, Parr, Philpott, Pfeiffer, Retana, Suarez, Vasconcelos, Weiser and Sanders2009; Jenkins et al. Reference Jenkins, Sanders, Andersen, Arnan, Brühl, Cerda, Ellison, Fisher, Fitzpatrick, Gotelli, Gove, Guénard, Lattke, Lessard, McGlynn, Menke, Parr, Philpott, Vasconcelos, Weiser and Dunn2011) and the invasion risks by ants (Roura-Pascual et al. Reference Roura-Pascual, Hui, Ikeda, Leday, Richardson, Carpintero, Espadaler, Gomez, Guenard, Hartley, Krushelnycky, Lester, McGeoch, Menke, Pedersen, Pitt, Reyes, Sanders, Suarez, Touyama, Ward, Ward and Worner2011). As ants are ectotherms and particularly sensitive to temperature and humidity, suitable climatic conditions are necessary for their establishment. Therefore, an evaluation of climatic suitability can serve as an important proxy for the invasion risk by ants. Previous studies have modelled the probability of establishment based on mechanistic (degree-day) models (Hartley & Lester Reference Hartley and Lester2003; Hartley et al. Reference Hartley, Krushelnycky and Lester2010) and statistical species distribution models (Roura-Pascual et al. Reference Roura-Pascual, Suarez, Gomez, Pons, Touyama, Wild, Peterson and Gómez2004; Morrison et al. Reference Morrison, Korzukhin and Porter2005; Steiner et al. Reference Steiner, Schlick-Steiner, VanDerWal, Reuther, Christian, Stauffer, Suarez, Williams and Crozier2008; Bertelsmeier et al. Reference Bertelsmeier, Luque and Courchamp2013 a, b). Recently, it has been advocated to move beyond theoretical predictions and to implement practical management advice from species distribution models (Dawson et al. 2011). However, previous studies on potential distributions of invasive ants lack applicability for surveillance prioritization at a regional scale or at ports of entry for three reasons: (1) they make predictions at a global scale, or (2) they are concerned with theoretical questions about modelling methods, and/or (3) they are focused on single species. Therefore, there is a lack of relevant information to inform managers using species distribution models. This can only be achieved with a multi-species (global taxonomic) approach, which concentrates on a particular region and provides a ranking of relative suitability for different species for that region. Here, we provide such an assessment for 14 of the worst invasive ant species (IUCN [International Union for the Conservation of Nature] SSC [Species Survival Commission] ISSG [Invasive Species Specialist Group] 2012). We estimate climatic suitability for these species in France, which is a good model system for several reasons. First, France encompasses several climatic zones (coastal, continental, mountainous and Mediterranean) at a relatively small scale, thereby providing interesting regional differences in suitability. In addition, France is located in a temperate region and climate change is expected to affect the fitness of insects especially at these higher latitudes (Deutsch et al. Reference Deutsch, Tewksbury, Huey, Sheldon, Ghalambor, Haak and Martin2008; but see Diamond et al. Reference Diamond, Sorger, Hulcr, Pelini, Del Toro, Hirsch, Oberg and Dunn2012), thereby potentially enabling tropical and subtropical species to invade. Such an assessment is highly relevant for a country like France that uses a large part (51%) of its landmass for agriculture and plantations (Agreste 2012), and thus could be affected by invasive ants. Further, France occupies a central place for international trade and tourism (DGCIS [Direction Générale de la Compétitivité, de l'Industrie et des Services] 2012). Bordered by three different seas and ocean and by five countries, it is ranked the most popular touristic destination in the world, with 81 million arrivals in 2012 (DGCIS 2012) and the fifth country in terms of the volume of imported goods in 2010 and 2011 (WTO [World Trade Organization] 2011). In addition, France has many overseas departments and territories, including island territories in the Atlantic, Pacific and Indian oceans, as well as French Guiana on the South American coast. Many of these territories are tropical and subtropical and are currently invaded by several species of ants (IUCN SSC ISSG 2012). These territories are characterized by disproportionate volumes of transportation of people and goods, which in addition benefit from facilitated imports under the regulation of the European Union. France also has privileged exchanges with many countries, some of which are former colonies. Consequently, there is an increased likelihood of accidental import of these species from tropical and subtropical regions.
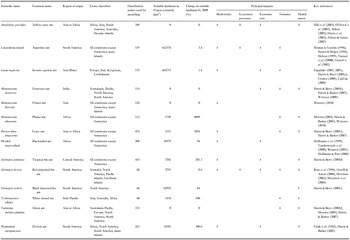
Here, we use species distribution models to assess the amount of suitable landmass in France for 14 globally invasive ant species (Table 1). Of these species, five are on the ISSG's selection of ‘100 of the world's worst invasive alien species’ (Table 1; IUCN SSC ISSG 2012). To our knowledge, only two species (L. humile and L. neglectus) have colonized the mainland of France (living outside greenhouses or similar) (IUCN SSC ISSG 2012). The population of L. humile is part of the European supercolony that spans 6000 km from Portugal to Italy (Giraud et al. Reference Giraud, Pedersen and Keller2002). It was first recorded in southern France in 1906 (Blight et al. Reference Blight, Provost, Renucci, Tirard and Orgeas2010) and its invasion has been thus far limited to the Mediterranean coastline. L. neglectus is a more recent invader; it was described as a new species in 1990 (Cremer et al. Reference Cremer, Ugelvig, Drijfhout, Schlick-Steiner, Steiner, Seifert, Hughes, Schulz, Petersen, Konrad, Stauffer, Kiran, Espadaler, D'Ettorre, Aktac, Eilenberg, Jones, Nash, Pedersen, Boomsma, Aktaç, Dawson, Jackson, House, Prentice and Mace2008) and most French records postdate the year 2000 (Espadaler & Bernal Reference Espadaler and Bernal2011). However, the species has achieved a far larger distribution than L. humile, establishing itself along the Mediterranean coastline and also in south-western France, the Alps (Annecy), Brittany (near Brest) and central France (Paris, Tours) (Espadaler & Bernal Reference Espadaler and Bernal2011). To our knowledge, no systematic eradication programmes have been attempted.
Characteristics of 14 of the worst invasive ant species, and their potential distribution in France.

The aim of this study was to map national and departmental suitability for 14 highly invasive ant species, both currently and under future climate change scenarios. A department is an administrative division of France below the regional level, and there are 96 departments on the French mainland. Using forecasts derived from current climatic conditions, we evaluated climatic suitability at national, departmental and species levels. In addition, we assessed climatic suitability in the future, following six climatic scenarios (based on the combinations of three climatic models and two CO2 emission scenarios), which were pooled into a single consensus forecast for the year 2080. Finally, we developed a suitability ranking for the most important airports and maritime ports of France.
METHODS
Species distribution data
Species distribution models (SDMs) search for a non-random association between environmental predictors and species occurrence data to make spatial predictions of potential distribution. Because our models should consider the full set of climatic conditions under which the target species can exist, we included occurrence points (presence-only data) from both invaded and native habitats (Beaumont et al. Reference Beaumont, Gallagher, Thuiller, Downey, Leishman and Hughes2009). The data were sourced from the globally authoritative IUCN database for invasive species (IUCN SSC ISSG 2012), as well as a database for ant distributions (Harris & Rees Reference Harris and Rees2004). We obtained additional points for M. destructor from Wetterer (Reference Wetterer2009). Data were excluded where the species were present in artificial climatic conditions, such as greenhouses, or when they were collected prior to the second half of the 20th century. In total, we used on average 237 points of occurrence per species to model the species’ distribution. For models requiring absence data, 10 000 pseudo-absence (background) points were generated randomly.
This is a classic procedure because confirmed absence data is difficult to obtain for most species and requires great sampling efforts (Franklin Reference Franklin2009). We constrained the set of random points so that there were no points located at sea or at the poles. It is, however, inadvisable to make too strong assumptions about ‘unsuitable’ habitat because the species are global invaders, present on several continents, and have invaded a wide range of latitudes and habitats. It has been suggested that including background data from beyond the species’ hypothesized potential distribution, or those that are environmentally dissimilar from the presence locations, yield more plausible SDMs, especially if the purpose is to project species invasion or range changes under climate change (Franklin Reference Franklin2009 and references therein).
Climatic predictors
We modelled the species niche based on six of the 19 bioclimatic variables provided by the Worldclim database (Hijmans et al. Reference Hijmans, Cameron, Parra, Jones and Jarvis2005), which were not collinear (pair-wise rPearson < 0.75) (Appendix 1, Table S1, see supplementary material at Journals.cambridge.org/ENC) and contributed most to the maximum entropy (MaxEnt) model for each focal species. These bioclimatic variables were derived from monthly temperature and rainfall values from 1960–1990 (Hijmans et al. Reference Hijmans, Cameron, Parra, Jones and Jarvis2005) and are known to influence species distributions (Root et al. Reference Root, Price and Hall2003). The distribution data came from specimens that had been collected during the second half of the 20th century, which coincided with ‘current’ climatic conditions.
Future climatic data were sourced from the 4th Intergovernmental Panel on Climate Change (IPCC) assessment report (IPCC 2007). The projections were calibrated and statistically downscaled by the IPCC using the WorldClim data for ‘current’ conditions, thus enabling comparisons among the projections. In order to consider a range of possible future climates, we used downscaled climate data from three climate models, namely the CCCMA-GCM2, the CSIRO-MK2 and the HCCPR-HADCM3 global circulation models (IPCC 2007), which are among the most widely used climate models (Bradley et al. Reference Bradley, Wilcove and Oppenheimer2010; Synes & Osborne Reference Synes and Osborne2011). Similarly, we used the two extreme special reports on CO2 emission scenarios: the optimistic B2a and pessimistic A2a scenarios. We used a spatial resolution of 10 arcmin (c. 18.5 × 18.5 km pixel). Predictions based on coarser resolutions are more likely to be controlled by climatic predictors, whereas fine-scale patchy distributions at a smaller scale are more likely to be determined by microtopographic variations or habitat fragmentation (Guisan & Thuiller Reference Guisan and Thuiller2005). More details about the climatic predictors can be found in Bertelsmeier et al. (Reference Bertelsmeier, Luque and Courchamp2013 a, b).
Ecological niche modelling
Five machine learning modelling techniques were used to generate the consensual forecasts: two types of support vector machines (One-class SVMs with parameters: kernel = radial base function, γ = 1, n = 0.05, Two-class SVMs with parameters: kernel = radial base function, γ = 3, cost = 1), artificial neural networks (parameters: type = back propagation artificial neural network, momentum = 0.3, learning rate = 0.1) and classification trees (parameters: type = iterative, number of trials = 5, window size = 10, pruning level = 0.25) and finally the MaxEnt algorithm. Machine learning methods are a set of algorithms that learn the mapping function or classification rule inductively from the input data (Elith et al. Reference Elith, Graham, Anderson and Dudik2006). All models were run using the ModEco platform with default parameters (see Guo & Liu Reference Guo and Liu2010; Bertelsmeier et al. Reference Bertelsmeier, Luque and Courchamp2013 a for additional details on model algorithms).
A clear limitation of modelling is that outputs are dependent on the specifically chosen input settings, in this instance the algorithms, global climate models and scenarios of human development. To minimize potential variation in the results, we conducted consensual forecasts (Araújo & New Reference Araújo and New2007) of combined models using the five different modelling techniques above with each of six future climatic scenarios (based on three climate models and two CO2 emission scenarios). The purpose of consensual forecasts is to separate the signal from the ‘noise’ associated with the errors and uncertainties of individual models, by superimposing the maps based on individual model outputs. Areas where these individual maps overlap are defined as areas of ‘consensual prediction’ (Araújo & New Reference Araújo and New2007). This differs from averaging the individual projections, as the area predicted by the consensual forecast can be smaller than any individual forecast if there is little spatial agreement (or overlap) between individual forecasts.
The contribution of the individual models (namely the spatial prediction of ‘suitable range’) was weighted according to the area under the curve (AUC) of the receiver operating characteristic (ROC) curve in order to enhance contribution of models with higher model performance values (see later). Only binary projections (present or absent) have been combined to generate the consensus model because continuous outputs can have different meanings for different models and cannot be simply added together (Guo & Liu Reference Guo and Liu2010). The combination of the individual forecasts then yields a projection (the consensus model), where the value of pixels varies between 0 and 1 and can be interpreted as a probability of the species being present in each pixel (Araújo & New Reference Araújo and New2007).
The consensus model was generated using all 30 individual projections, each based on a different combination of CO2 scenario × climate models × modelling technique. Consequently, we obtained a single value per consensus model. We also calculated the standard deviation among climatic scenarios in order to show the extent of variation across forecasts.
Model validation
Model robustness was evaluated using the AUC of the ROC curve, which is a nonparametric threshold-independent measure of accuracy commonly used to evaluate species distribution models (see Pearce & Ferrier Reference Pearce and Ferrier2000; Roura-Pascual et al. Reference Roura-Pascual, Brotons, Peterson and Thuiller2009). We used the AUC because it does not depend on the selected classification threshold, and it readily indicates whether a model discriminates correctly between presence and absence points (Pearce & Ferrier Reference Pearce and Ferrier2000). AUC values range from 0 to 1, where a value of 0.5 can be interpreted as a random prediction. An AUC between 0.5 and 0.7 was considered low (poor model performance), a value 0.7–0.9 considered moderate and values > 0.9 were considered high (Franklin Reference Franklin2009, and references therein). For model evaluation, the data needs to be split into a training and a test group. Here, we used 10-fold cross-validation, where the data was split into 10 equal parts, with 9/10 of the observations used to build the models and the remaining 1/10 used to estimate performance; this was repeated ten times and the estimated performance measures were averaged (Fielding & Bell Reference Fielding and Bell1997; Franklin Reference Franklin2009). Bertelsmeier et al. (Reference Bertelsmeier, Luque and Courchamp2013 a, b) provide further details about the ecological niche modelling and model validation.
Assessing climatically suitable areas
Studies with a priori objectives may use a range of different threshold values (Nenzén & Araújo Reference Nenzén and Araújo2011). As this was not the case here, we applied a limit whereby all pixels with a probability of presence exceeding 0.5 were classified as ‘suitable’ areas, as is frequently done for binary classification in species distribution modelling (Franklin Reference Franklin2009; Klamt et al. Reference Klamt, Thompson and Davis2011). Spatial analyses were carried out using DIVA-GIS (Hijmans et al. Reference Hijmans, Cruz and Rojas2001) and Arcgis v.9.3 (http://www.esri.com/software/arcgis).
We analysed which departments had the highest number of potential invaders, based on a simple presence/absence score. If at least one pixel within a department was suitable, the species was counted as a potential invader in that department.
At the species-level, we produced maps of the current potential distribution of all species for which at least one pixel exceeded the classification threshold of 0.5. We calculated the mean suitability per department for all of these species. Mapping relative differences between suitability levels goes beyond the use of binary classification and provides more information on the relative climatic suitability of departments that have been classified as ‘suitable’. The use of this ‘quality’ assessment has been advocated recently, especially in the case of conservation assessments and invasive species (Bertelsmeier et al. Reference Bertelsmeier, Luque and Courchamp2013 a).
Recommendations at ports of entry
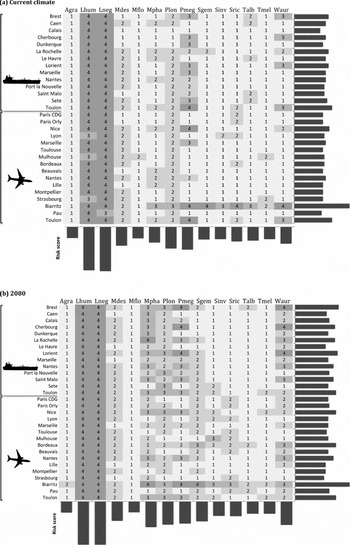
We included in this study all 17 airports in France with more than 500 000 passengers in 2012 (Union des aéroports français 2012) and the 14 major French maritime ports (Benmessaoud Reference Benmessaoud2013). We scored the relative invasion likelihood for each species and port of entry based on climatic suitability: ‘Very low’ suitability (0–0.25) was assigned a score of 1, ‘low’ suitability (0.25–0.5) was 2, ‘high’ suitability (0.5–0.75) was 3 and, finally, ‘very high’ suitability’ (0.75–1) was 4. We then calculated the total climatic suitability score for each port of entry (by summing the climatic suitability scores of all species of the port of entry) and for each species (by summing the species’ scores for all ports of entry).
RESULTS
All AUC values were between 0.787 and 0.998 (mean 0.921, standard deviation [SD] 0.053), indicating an overall good to excellent ability to predict the species’ presence based on the consensus models.
Current potential distribution
Under current climatic conditions, almost the entire landmass in mainland France presented suitable climatic conditions for 10 out of 14 invasive ant species. The highest proportion of landmass was suitable for L. neglectus and L. humile, followed by S. richteri, P. megacephala and W. auropunctata (Table 1). For the four major global invaders included in this analysis, A. gracilipes, M. destructor, M. floricola and T. melanocephalum, France did not present suitable climatic conditions.
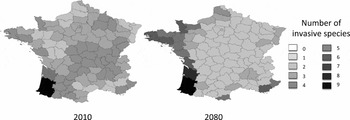
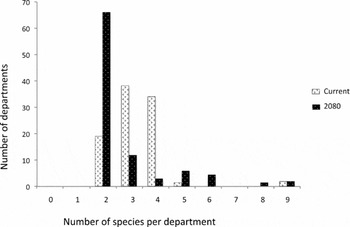
All of the French mainland departments had at least two potential invaders (L. neglectus and L. humile), but most were suitable for three (38 departments) or four (34 departments) invasive ants (Fig. 1 a). For example, Ile-de-France presents suitable climatic conditions for three invasive species. At the other extreme, the departments Pyrénées-Atlantiques and Landes in the south-west could each be invaded by nine ant species (Fig. 2).
Number of potentially invasive ant species in France per department. The scale indicates the possible number of potential invasive species.

Number of departments potentially invaded by 0 to 9 invasive ant species.

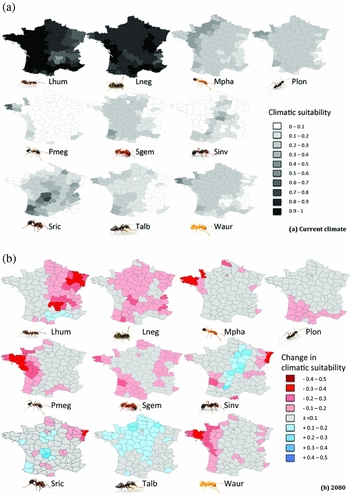
At the species-level, there were important regional differences concerning the location of the most suitable climatic conditions. Overall, the absence of an expected north-south division was striking for most species. Rather, most species showed an east-west gradient of climatic suitability, the most suitable departments being located on the west coast (Fig. 3 a). An exception to this pattern is L. neglectus, which had highly suitable conditions across the whole of France. Several species found highly suitable conditions in Brittany or Normandy (M. pharaonis, T. albipes, P. longicornis, P. megacephala and W. auropunctata). As opposed to most other species, two species (S. invicta and S. richteri) did not have suitable conditions near coastal regions, but rather inland.
(a) Current mean climatic suitability within each of the 95 French metropolitan departments for 10 potential invasive species (four species for which areas in France were entirely unsuitable were excluded from this figure). (b) Change in mean climatic suitability within each department by 2080. Lhum = L. humile, Lneg = L. neglectus, Mpha = M. pharaonis, Plon = P. longicornis, Pmeg = P. megacephala, Sgem = S. geminata, Sinv = S. invicta, Sric = S. richteri, Talb = T. albipes, Waur = W. auropunctata. Ant pictures ©Alex Wild, used by permission

The ports of entry with the highest suitability score were Biarritz airport (42, out of a total of 56), followed by Toulon Hyères airport (29), Toulon maritime port (29), Nice airport (27) and the maritime ports of Brest, La Rochelle and Lorient (26 each) (Fig. 4 a). Species with the overall highest suitability score at ports of entry in France were L. neglectus (119, out of a total of 120) and L. humile (117), followed by P. megacephala (61) and P. longicornis (58).
Climatic suitability scores for all major maritime ports and airports (a) under current climatic conditions, (b) under future climate change (2080). Lhum = L. humile, Lneg = L. neglectus, Mpha = M. pharaonis, Plon = P. longicornis, Pmeg = P. megacephala, Sgem = S. geminata, Sinv = S. invicta, Sric = S. richteri, Talb = T. albipes, Waur = W. auropunctata.

Impacts of climate change on ant invasions
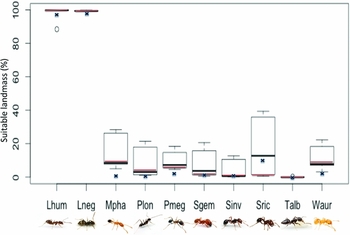
The four species that had no climatically suitable areas in France under current climatic conditions (A. gracilipes, M. destructor, M. floricola, T. melanocephalum) continued to have no suitable areas under modelled climate change conditions. Among the ten species that could potentially invade France under current conditions, potential distribution areas within France increased for eight species under climate change conditions (Fig. 5). The largest increase in suitable areas was found for M. pharaonis, followed by W. auropunctata, P. megacephala and P. longicornis (Table 1). Potential distributions decreased only for S. richteri and T. albipes (Table 1).
Suitable landmass (%) under current climatic conditions (blue crosses) and the consensus model (red line). The box plot shows variation in prediction of future suitable landmass across the six climatic scenarios (mean ± standard deviation). Lhum = L. humile, Lneg = L. neglectus, Mpha = M. pharaonis, Plon = P. longicornis, Pmeg = P. megacephala, Sgem = S. geminata, Sinv = S. invicta, Sric = S. richteri, Talb = T. albipes, Waur = W. auropunctata. Ant pictures ©Alex Wild, used by permission.

The locations with the highest concentration of potential ant invaders shifted spatially with climate change (Fig. 1 b). By 2080, the whole western coastline of France had a greater number of invasive ant species than inland areas. In the climate change models, the number of departments suitable for only two invasive species increased to 66. There was a parallel increase in the number of departments suitable for more than four species to 13 (Fig. 2).
With climate change, the suitability scores of many departments (Fig. 3 b) and ports of entry (Fig. 4 b) increased, especially along the western coastline. The greatest increases in relative suitability were found for L. humile (mostly in the east of France, which was slightly less favourable under current conditions), M. pharaonis, P. megacephala and W. auropunctata (greatest increase in Brittany) (Fig. 3 b). Climate change models indicated that the highest suitability score was still to be found at Biarritz airport (41), followed by several ports that generated suitability scores exceeding 30: Brest port (33), Lorient port (32), Toulon port (31), Nice airport (31), Bordeaux Mérignac airport (31) and Toulon airport (31). The highest relative increases in suitability scores per species were found for M. pharaonis (+29), S. geminata (+21) and W. auropunctata (+20).
DISCUSSION
Our consensus models predicted that France had suitable climatic conditions for 10 out of 14 of the worst invasive ant species, including four that are on the world's 100 worst invasive alien species list of the IUCN (Lowe et al. Reference Lowe, Browne, Boudjelas and De Poorter2000). Areas with the highest concentration of potential invaders are mainly located along the coastline, especially in the south-west of France, but all departments appear climatically suitable for at least two species. Among potential ports of entry, the airport at Biarritz is by far the most at-risk, and almost all species should be closely monitored for there. Several species were at high-risk of interception in many ports of entry, including the Argentine ant and garden ants, which both scored the highest possible climatic suitability on our scale. With climate change, the potential distribution was predicted to increase for eight out of 10 species in France. The most suitable area by 2080 extended along the western coastline, from the Pyrenees to northern France. However, inland departments were predicted to receive a lower number of invasive species than under current climatic conditions.
Our models had good to excellent performance (AUC) but nevertheless they share a certain number of underlying assumptions common to all species distribution models (Guisan & Thuiller Reference Guisan and Thuiller2005; Sinclair et al. Reference Sinclair, White and Newell2010). For example, they require niche conservation, thus species requirements have to remain the same in space and time. Although it is known that this is not always the case for invasive species, niche shifts remain relatively rare (Petitpierre et al. Reference Petitpierre, Kueffer, Broennimann, Randin, Daehler and Guisan2012). Furthermore, these models do not take into account biotic interactions or microclimatic conditions, which may determine at a very local scale whether or not a particular invasive species ultimately becomes established in a given area. In addition, the model outputs only show the climatically suitable areas, but the actual distribution and spread of the invasive ants depends mostly on human-mediated transport, as most of the species form new colonies by budding (Holway et al. Reference Holway, Lach, Suarez, Tsutsui and Case2002). This strongly limits the initial colonization to areas adjacent to points of introduction (Holway et al. Reference Holway, Lach, Suarez, Tsutsui and Case2002). An important exception is S. invicta, which occurs both as a monogyne and a polygyne form; winged queens of the monogyne colonies are capable of travelling several kilometres distant from their natal nest (Tschinkel Reference Tschinkel2006). But for most invasive ants, the distance to human infrastructures is an important factor determining actual invasion risk. The association of invasive ants with urban ecosystems is especially relevant at a local scale (Roura-Pascual et al. Reference Roura-Pascual, Hui, Ikeda, Leday, Richardson, Carpintero, Espadaler, Gomez, Guenard, Hartley, Krushelnycky, Lester, McGeoch, Menke, Pedersen, Pitt, Reyes, Sanders, Suarez, Touyama, Ward, Ward and Worner2011). Nevertheless, species distribution models can reveal general patterns and deliver useful approximations, which are important for ranking species according to their potential to invade a given area (Araujo & Peterson Reference Araujo and Peterson2012; Warren Reference Warren2012). Any particular modelling algorithm has its own set of assumptions. This is why we did not base our conclusions on the results of a single modelling method, however widespread its use may be, but combined a range of different forecasts in a single consensus model (Araújo & New Reference Araújo and New2007). Climatic suitability is a necessary precondition for successful establishment of an invasive species, even though it may eventually be hindered by other biotic or abiotic factors. The comparison of relative suitability (or ‘quality’) of areas in different departments for different species may serve as an indicator of which species need to be most monitored, and where (Bertelsmeier et al. Reference Bertelsmeier, Luque and Courchamp2013 a). For example, relative climatic suitability has probably played a role in the recent displacement of Argentine ants by a newly invasive ant species from areas that the Argentine ant had invaded and dominated for several years. This presumably arose because these areas were situated in the range margins of the climatic niche of the Argentine ant and the relative climatic suitability was greater for the other species, Pachycondyla chinensis (Rice & Silverman Reference Rice and Silverman2013). Information on relative suitability of different species, such as the assessment that we provide here, can serve as a basis for the prioritization of management efforts.
Once invasive ants become established in a climatically suitable area, it is extremely difficult to control or eradicate them. A range of commercialized products exists, but no universal bait exists because of differences in dietary preferences among species (Hoffmann et al. Reference Hoffmann, Abbott, Davis, Lach, Parr and Abbott2010). These products differ in their environmental acceptability, but always have negative impacts on native taxa to some extent. In some cases, these measures can be complemented by habitat modification, such as fire (Hoffmann & O'Connor Reference Hoffmann and O'Connor2004) or drainage restriction (Holway & Suarez Reference Holway and Suarez2006), but these modifications can negatively impact the ecosystem on their own by creating disturbance. The greater the extent of an invasion, the higher the environmental impacts of management attempts and the greater the difficulty of achieving successful eradication, provided this is still feasible (Simberloff Reference Simberloff2003). In general, reactive programmes have proved far more expensive than proactive programmes (Kaiser & Burnett Reference Kaiser and Burnett2010). However, species-specific protocols are needed before taking action (Hoffmann et al. Reference Hoffmann, Abbott, Davis, Lach, Parr and Abbott2010). Ill-conceived treatments can even have an adverse effect, for example the extent of the invasion of S. invicta in the southern USA seems to have actually increased following chemical treatment (Tschinkel Reference Tschinkel2006).
Yet, historically, ant management has been reactive, only starting after the detection of an incursion, in spite of the advocation of a proactive approach (Hoffmann et al. Reference Hoffmann, Abbott, Davis, Lach, Parr and Abbott2010). The first step of such an approach is to carry out risk analyses of the target species that may become established, or even better, of any species that may become established within a target region. Our study may serve as the basis for a proactive ant management plan in France, based on privileged surveillance of certain species according to the department and the port of entry. These steps require increased detection protocols at ports-of entry, which is now standard within New Zealand since the detection of S. invicta at Auckland International Airport in 2001 (Hoffmann et al. Reference Hoffmann, Abbott, Davis, Lach, Parr and Abbott2010). The numerous intercepted ant species in the USA demonstrate that the likelihood of introducing ants inadvertently is high if no surveillance measures are taken (Suarez et al. Reference Suarez, Holway and Ward2005). In countries with well-developed monitoring programmes for invasive species, government departments responsible for food-production industries or environmental issues have the expertise to conduct invasive ant control programmes, as do some non-governmental entities such as local land management organizations (Hoffmann et al. Reference Hoffmann, Abbott, Davis, Lach, Parr and Abbott2010). Developing invasive species monitoring programmes is especially important for a country like France, which has a great amount of commercial and touristic exchanges (WTO 2011; DGCIS 2012). Further, immediate treatment options have to be planned for the species most at risk of becoming invasive, in order to act quickly as soon as an incursion is detected. Immediate action increases the chances of successful eradication enormously (Simberloff Reference Simberloff2003), lowering its cost and reducing the extent of collateral impact on native fauna. Public education can be important for increasing acceptance of management actions and encouraging the public to signal early detection of the target species (Hoffmann et al. Reference Hoffmann, Abbott, Davis, Lach, Parr and Abbott2010). A useful first step would be to develop identification tools for at-risk species (species determination keys and profiles) that may be distributed at ports of entries or to increase surveillance efficiency by raising public awareness. Lastly, actions may require permits and registrations for poison use, and it is recommended these obstacles be removed prior to incursions in order to eliminate delays in management actions (Hoffmann et al. Reference Hoffmann, Abbott, Davis, Lach, Parr and Abbott2010).
CONCLUSION
The regional approach used here can serve as a good basis to forecast the potential distribution of known global invaders, listed by the IUCN. However, future research should aim at developing predictive tools to identify additional potential invasive species, in order to achieve a more exhaustive assessment for a taxonomic group. For example, this might be based on traits associated with invasiveness, which could be combined with an assessment of geographic likelihood of establishment, such as provided here.
Our models identify several potential invasive ant species for France and highlight regions with a high risk of multiple invasions. We strongly recommend such spatialized ranking of species and areas be used to prioritize surveillance efforts and proactive management options.
ACKNOWLEDGEMENTS
We thank Benjamin D. Hoffmann for checking all ant occurrence data for spurious or missing records and Alex Wild for the ant pictures. This paper was supported by Région Ile-de-France (03-2010/GV-DIM ASTREA) and ANR (2009 PEXT 010 01) grants.