The rise in Colombian export activity during the era of economic globalization from 1850 to 1912 paled in comparison with the rise in exports in the rest of Latin America.Footnote 1 Colombia's export growth of 3.5 percent per year during the period was below the average of 3.9 percent for Latin America as a whole. In 1913 Colombia's exports of $6 per capita were among the lowest in Latin America, well below the Latin American average of $24.Footnote 2 The traditional view states that Colombia exhibited high vulnerability to cycles in world demand and was one of the Latin American countries in which the export gains prompted by booms were almost completely annulled during busts.Footnote 3 Because Colombia did not become an important supplier of raw material for European manufacturing industries, she was not attractive to immigrants or foreign investors, which in consequence reinforced her exporting backwardness. We offer a supply-side complement to that explanation. The weakness of land property rights and consequent conflict over the rights made it difficult for Colombia to take advantage of the export opportunities available to them.
On a de jure basis, national legislation on public land allocation adapted to the boom in world demand for primary products with a goal of facilitating land titling and protecting the peasant settlers from large landowners’ encroachments. However, the de facto power of the large landowners and the high transaction costs of titling land prevented all but a few peasant settlers from acquiring formal property titles. The lack of formal property rights on the frontier together with opportunities for higher revenue from exports of primary goods caused the emergence of land conflicts at the turn of the twentieth century.Footnote 4 The property rights disputes between peasant settlers and landowners, in turn, led to a level of exportable production much lower than its potential.Footnote 5
LAND SUPPLY AND PROPERTY RIGHTS AT THE FRONTIER
The institutions of the post-Independence Colombian economy in the first half of the nineteenth century were deeply rooted in its colonial past and inherited most of its features.Footnote 6 The structures of taxation, foreign and domestic trade, and the labor force in the nineteenth century were quite similar to those of the Borbonic period at the end of the eighteenth century. Nearly 80 percent of exports were precious metals whose revenues were used to import mainly consumption goods, which were taxed to provide most of the government's income. Thus, public finances were weak and depended mainly on customs that made up more than 50 percent of public revenue.Footnote 7 Only a small percentage of workers were free, and those workers were primarily located in urban centers. The rest worked in the haciendas under nonwage arrangements as sharecroppers, tenants, peons, or domestic laborers.Footnote 8
In the middle of the nineteenth century, the Colombian economy started to break free from its colonial structure. Foreign trade expanded and diversified. Precious metals as a share of exports fell, as exports of new products, including tobacco, coffee, quinine, indigo, and leather, grew. Between 1850 and 1880 exports grew on average 4 percent per year, prompting the expansion of river navigation and shipping, road construction, and banking.Footnote 9 However, only coffee became a sustainable export product, rising as a share of exports from 8 percent in 1850 to 12 percent in 1885 to 50 percent in 1900 and 79 percent in 1929.
Population growth from two to five million people between 1851 and 1913 prompted the occupation of the vacant lands (baldios) in agrarian frontier areas. Before the 1870s property rights in these frontier lands were in general weakly defined, as informal agreements established the boundaries of the settlers’ terrains. Little more was needed because the frontier land was abundant and economic opportunities from land were limited. However, the expansion of world markets after 1870 offered new economic prospects to producers of primary goods in the periphery. The rising population moved into the western and southern parts of Colombia along the paths followed in Map 1 and stimulated demand for land, which led to increases in land prices. The notary data on land sales for the Department of Cundinamarca show that the price per fanegada (0.66 hectares) rose by more than 200 percent between the 1850s and the end of the century.Footnote 10 As the demand for land rose, agrarian producers sought more formal property rights that would allow them to take full advantage of the opportunities offered by the world markets.
PRESENCE OF COFFEE PRODUCTION IN 1851, 1892, AND 1925

Peasant settlers faced many obstacles to establishing formal title to the land they occupied. Titling was costly since it involved establishing fencing and hiring lawyers and surveyors. Further, local large landowners (terratenientes) were powerful and used every tool at their disposal to prevent land titling to peasants.Footnote 11 On many occasions, big landowners successfully claimed the terrain already occupied by peasants. The peasants responded by trying to remain on the land and farming it themselves. These conflicts were stimulated by the weakness and instability of formal property rights in the frontier in a context of expected higher land returns.Footnote 12
According to Catherine LeGrand, there were two phases of legislation on public land allocation during the nineteenth century. During the first phase from 1820 to 1873, the government sought primarily to cover the expenses of the War of Independence.Footnote 13 The central government issued bonds that were exchanged for or redeemable in public lands.Footnote 14 This policy meant that most of the public lands were allocated to rich businessmen and big landowners. After 1873 land titling policy was redirected to bring it more in line with the economic changes ignited by the growth in the export economy. Thus, Law 61 of 1874 and Law 48 of 1882 established that settlers who occupied terrains for five years or more and made productive use of them would be awarded property titles.Footnote 15 The legislation also limited the concentration and unproductive use of the land. For instance, Law 48 of 1882 established that the maximum allocation would be 5,000 hectares. In 1912 it was reduced to 2,500. The law also determined that if the land remained unproductive for more than ten years, it would return to the government's hands.Footnote 16 However, the titling process typically involved surveyors and lawyers’ fees, headed paper, stamps, charges, and property registration, and the central government was not effective at enforcing land laws at the local level.Footnote 17 As a result, many settlers on the frontier decided not to pay the high transactions costs and did not establish formal property rights to the land they settled.Footnote 18 In an environment of growing economic opportunities for agricultural activities, the interaction between the settlers’ informal rights and the increase in the land returns and export prices led to land conflicts.Footnote 19
Policies to liberalize access to land during the second half of the nineteenth century were implemented by the liberal party administrations as part of a series of new policies to promote economic progress. The liberal government established a Federal Republic named the United States of Colombia, eliminated slavery, abolished a wide range of taxes, and promoted free trade. Further, the government expanded the land available for economic exploitation by granting or selling public lands (baldios), disentailing (expropriating and selling) church goods and land, and dissolving indigenous territories or communal lands (resguardos).Footnote 20 Between 1850 and 1930 the new land policies were used to distribute nearly 6 percent of the inhabited Colombian territory that belonged to the state to private owners.Footnote 21
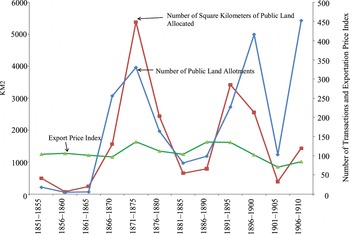
The titling of public land followed the cycles in export prices as shown in Figure 1. Before 1850 only about 20 square kilometers per year were titled.Footnote 22 The titling rose to 90 square kilometers from 1850 to 1865 as the export economy grew and export prices rose. During the quinine and tobacco export booms of the 1870s, land granting skyrocketed to nearly 4,000 square kilometers per year as the export price index rose from 300 to over 400. After a reduction in titling in the early 1880s, a new rise of over 50 percent in coffee export prices and export growth led titling to a new peak of 3,000 square kilometers in 1891–1895.
EXPORT PRICE INDEX, NUMBER OF TRANSACTIONS, AND SQUARE KILOMETERS OF PUBLIC LANDS TITLED, 1850–1910 (in five-year periods)

The combination of a drop in coffee prices between 1896 and 1900 and the Thousand Days War between Liberals and Conservatives between 1898 and 1902 caused exports to drop sharply. Land titling dropped to a low in 1901–1905, before rising sharply to its highest levels during the early 1920s.
Figure 1 also presents the number of public land grants, which did not always follow the pattern for land titling. Before 1900 the rise of the number of titles coincided with the increase of the amount of land titled. In contrast, between 1900 and 1915 as the number of land titles increased, the quantity of land titled grew at a slower pace, implying a reduction in the size of the lots titled.
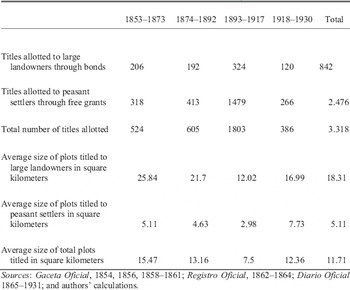
According to Table 1, between 1853 and 1873 61 percent (318) of the titling allotments were comprised of land granted to peasant settlers (a titulo de cultivador) and 39 percent (206) to public land sales through bonds to big landowners. The average of 25.8 square kilometers (around 6,400 acres) of land per title for the land acquired by bonds was much higher than the 5.1 average (around 1,260 acres) for titles allotted to peasants (cultivadores) through free grants. The peasant allotments seem rather large, which may suggest that those who decided to obtain formal titles were relatively well off and willing to pay the high transaction costs the process involved. From 1874 to 1892, when legislation was more favorable to squatters, 68 percent of land allotments were granted to them, but the average amount of land per title was smaller at 4.6 square kilometers. Hence, despite national government policies intended to favor and to attract those who would occupy small parcels, most of the land titled ended up in large private buyers’ hands.
LAND ALLOCATION BY TYPE OF TITLING, 1853–1930

Sources:
Gaceta Oficial, 1854, 1856, 1858–1861; Registro Oficial, 1862–1864; Diario Oficial 1865–1931; and authors’ calculations.
From 1893 to 1917 the titling activity intensified. Peasant settlers obtained 82 percent of the 1,803 allotments granted. In addition, the average size of the plots in square kilometers diminished for large landowners from 21.7 to 12 and for peasant settlers from 4.6 to 2.9. The declines resulted because of compliance with the law that limited the maximum lot size to 25. From 1918 to 1930 titling was relatively moderate, although the average lot size rose. It was precisely during the late nineteenth and the early twentieth centuries when export agriculture experienced a vast geographical expansion as the number of coffee municipalities jumped from 200 in 1892 to 387 in 1925, while the number of coffee trees grew tenfold from 35 to 350 million.
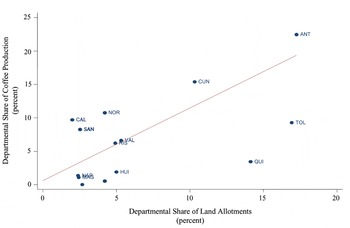
The largest part of the export agriculture, particularly coffee, located itself in the frontier areas. Figure 2 shows a high correlation at the departmental (state) level between the 1925 coffee production and the share of public land allotments.Footnote 23 Antioquia, Valle, and Norte de Santander were the leading coffee producers, and these departments received the highest proportion of public lands allotments during the late nineteenth and early twentieth centuries.
DEPARTMENTAL SHARE OF LAND ALLOTMENTS UP THROUGH 1925 AND COFFEE PRODUCTION IN 1925

LAND CONFLICTS
The land conflicts arose as a consequence of a slow titling process of public lands occupied by peasant settlers in an environment of increasing opportunities for primary exports. As land values went up with the rise in export opportunities, peasant settlers demanded more formal property rights over the land they settled, but the government was slow to supply the titles. Meanwhile, large landowners increasingly sought to usurp the land occupied by squatters on the frontier. Between 1827 and 1869 just one agrarian conflict was registered. The number of conflicts then rose to 69 between 1870 and 1900, while coffee increased its share of exports and large landowners sought to expand their land where they already had properties.Footnote 24 A steep rise in coffee prices from 7 to 25.9 U.S. cents between 1900 and 1929 coincided with a rise in land conflicts to 137 between 1901 and 1917 and 241 from 1918 to 1931.Footnote 25
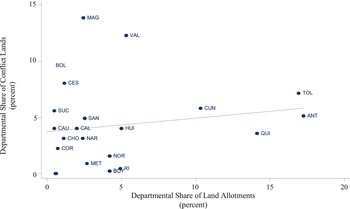
Figure 3 depicts the relationship between the department's shares in the total numbers of land conflicts during 1850–1917 and in the total amount of public land allotments indicating that frontier expansion and agrarian conflicts are positively correlated. We argue that the land conflicts were driven by two factors that impeded the spread of formal property rights among squatters: the high cost of titling and the central government's low capacity to enforce land laws and to effectively provide titles at the local level. These factors facilitated large landowners who sought to appropriate for themselves the squatters’ terrains.Footnote 26 The inadequate specification of property rights led to land conflict, which, in turn, would have reduced export activity.
DEPARTMENTAL SHARE OF LAND ALLOTMENTS AND CONFLICTS LANDS UP THROUGH 1925

EMPIRICAL MODEL
To show the impact of land conflict on export activity, we perform two cross-sectional analyses. We start with ordinary least squares (OLS) regressions that also control for other factors that might have influenced export activity. To examine these relationships, we start with the following estimating equation:

where Yi is the dependent variable measured in two ways: the natural logarithm of per capita value of exports in pesos of 1892 in municipality (county) i, or the number of per capita coffee trees in municipality i in 1925. For 1892 the value of per capita exports is calculated by multiplying the production of each export product—tobacco, coffee, sugar, cacao, and plantain—by their domestic average price.
PhysicalGeographyi is a vector that includes measures of altitude, soil fertility, precipitation, the size of the river network in kilometers, temperature, humidity, distances to the Pacific and Atlantic oceans, and the distance to the Cauca River. DistancetoMarketsi is the distance of each county to Bogota as the main administrative and economic center of Colombia.
Landsupplyi is a vector of variables describing the extent to which dissolution of indigenous communal lands took place during the eighteenth century, church land disentailments occurred between 1864 and 1884 and public land titling occurred from 1830 to 1892 and from 1893 to 1925. The title granting variable indicates that frontier expansion indeed occurred there. In fact, the first squatters may have settled years and even decades before the first titling process occurred. The three types of land supply expansion not only influenced the production of exports in the county where they happened, but also in the neighboring ones. Since most of the production of exports was located in counties with public land allotments, it is expected that some spillovers of the cropping know-how for the new exports may have been transmitted to the neighboring counties. On the other hand, if the agricultural know-how was associated with traditional crops usually grown in the former indigenous lands, the spillover effect on agricultural exports might have been zero or negative. In order to observe these spatial spillovers, we calculated spillover versions of three variables: “public land influence, 1850–1892” and “public land influence, 1893–1925,” “disentailment influence” and “dissolution of communal land influence.” Each variable takes the value of one in a county where their existence is reported and zero if the county is located more than 100 kilometers away from any county that had that type of land expansion. If the county did not report that type of land expansion and is located within 100 kilometers of a county that did have that type of expansion, it is given a value of ((100 – distance)/100)Footnote 2, where distance is the number of kilometers to the nearest county that reported the type of expansion was assigned to it.Footnote 27
Production1851i is a vector of dummy variables for the production of sugar, tobacco, cacao, plantain, and coffee in county i in 1851. We include this vector as it is expected that a county that in the past had produced exports products was more likely to produce them again if new market opportunities would arise. Because Colombia exported more tobacco than plantain or sugar in the counties with tobacco crops in 1851, the primary benefit in those areas would have come from better knowledge of the export business, rather than from knowledge about production of coffee.
LandConflicti takes a value of one if a land conflict was first reported in a municipality (county) between 1827 and 1892 and zero if not conflicts were reported in the 1892 regression. It takes focuses on the period between 1893 and 1925 for the 1925 regression. Conflict is defined as any petition of protection of property rights over land made to a judicial or to any other government authority—either local, departmental, or national. The authorities that received these petitions were local judges, police chiefs and mayors, departmental governors and courts, the minister of finance, the general attorney of the country, and even the country's Congress. Once a petition was received, the recipient authority either started the process or sent it to the office in charge of dealing with the matter. Those petitions came from peasant settlers, their representatives, municipal authorities, landlords, and private individuals.Footnote 28 The peasant settlers’ petitions could involve a single squatter but often did more than 10. Some petitions were made even in behalf of more than 500 peasant settlers.
We are interested in measuring the causal effect of land conflict on export production, but there is a potential problem with endogeneity because land conflict itself was likely to rise in response to higher expected land returns associated with expanded production of exportable goods. This will impart a positive bias to the coefficient for land conflict in the OLS regression that will cause the coefficient to underestimate the negative effect of land conflict on export activity. To control for potential endogeneity bias, we use an instrumental variable method with “closeness to colonial institutions” as the identifying instrument. Thus, the first-stage equation for land conflicts takes the following form:

where ClosenessColonialInstitutionsi is a measure of the central government's influence in county i.Footnote 29 In the counties where colonial institutions existed, the central government authority at the end of the nineteenth century was stronger, and it could better enforce the land laws and property rights at the local level there than in counties where such authority was weak or did not exist at all. To create the variable, we determined the location of the encomiendas in 1560 and the places with more than 20 slaves in 1800.Footnote 30 We then constructed a distance measure with value one if a county had both an encomienda in 1560 and slaves in 1800. The value is zero if the county was more than 100 kilometers distant from both the closest encomienda and the closest slave area. To obtain the value for the remaining locations, we calculated the distance to the nearest encomienda and the distance to the nearest slave area and then used the following formula:Footnote 31

There is evidence that the power of the central government in the 1800s was stronger and its ability to provide land formal titles more effective in locations where encomiendas in 1560 and slaves in 1800 were located. Further, the effectiveness of enforcing property rights was reduced as the distance from these colonial locations increased. The locations with encomiendas and slave populations had long histories of close monitoring by central authorities. During the conquest of Latin America, the Spaniards settled in places where the indigenous labor force was relatively abundant. In order to allocate this labor force in mining and agriculture in the early 1500s, the crown created the encomienda, which commended or entrusted a Spaniard and his heirs with the right to extract tribute goods from a group of indigenous Colombians. The Spaniard was obliged to Christianize the indigenous group and to pay taxes to the crown on the goods extracted. To monitor the proper functioning of the arrangement, the Spanish Crown sent visitors and judges to determine the taxes to be paid and to enforce the legislation for the protection of indigenous population. Hence, in the areas where encomiendas existed compliance with the law was indeed stronger.Footnote 32
Similarly, in zones with slaves descendant from Africans, the Spanish Crown granted privileges to exploit mining deposits and also limited and controlled the miners’ usage rights of deposits and nearby water sources. The authority regulated the mining technology to be employed. Likewise, the Reales de Minas—villages inhabited by mining slaves—were constantly visited by the crown's officers who verified the observance of laws and regulations regarding those settlements.Footnote 33 In both of these regions, the Spanish Crown or the local cabildos granted land titles and enforced property rights. In particular, the central government discouraged the encroachment onto peasant settlers’ lands by landowners, reducing the existence of conflicts. Since the types of exports in 1892 and 1925 were dramatically different from those in 1560 with the encomienda or in mining with slaves in 1800, we believe that these variables are uncorrelated with the error term in the final stage export production equation.
EMPIRICAL RESULTS
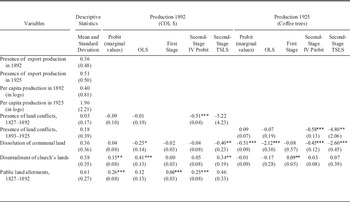
Table 2 shows the results from the estimation. We use probit and instrumental variable probit (IV Probit) models to explain the presence of export production and coffee production in 1892 and ordinary least squares (OLS) and two-stage least squares (TSLS) models to explain the per capita levels of 1892 production of exports and of 1925 coffee production. The expectation is that both the presence of export activity and level of export production would be reduced by the presence of more land conflicts. The probit and OLS results in Table 2 for both time periods imply small effects that are statistically insignificant.
ECONOMETRIC RESULTS DEPENDENT VARIABLES: EXPORTABLE PRODUCTION

* = Significant at 10 percent, ** = Significant at 5 percent, *** = Significant at 1 percent.
Notes:
Standard errors for the coefficients are in brackets below the coefficients. The table reports the probit and OLS and the first- and second-stage of the IV Probit and TSLS using the existence and log of the export production per capita in 1892 and 1925 log of coffee trees as the dependent variable. The number of counties with conflicts is 23 for 1892 and 143 for 1925. The regressions only include the departments with export production in each year. The instrumental variable is described in the text. Other controls (not reported) are altitude, soil fertility, rain precipitation, kilometers of rivers, temperature, distance to the Cauca River, distance to Barranquilla, distance to Cali, areas of public land allotments, presence of more than 80 slaves in 1800, and presence of coffee production in 1851. Critical values for the Stock and Yogo weak instrument test (5 percent significance) based on TSLS size with exact identification are 16.38, 8.96, 6.66, and 5.53, for the 10 percent, 15 percent, 20 percent, and 25 percent sizes respectively.
The absence of a negative effect might well be the result of a positive endogeneity bias because increased export activity likely increased the probability of land disputes. Table 2 also contains the first- and second-stage equation estimates in the IVProbit and TSLS procedures used to correct for the endogeneity bias. The results from the first-stage equations suggest that the instruments for land conflicts from 1827 to 1892 and from 1893 to 1925 are strong. Columns 5 and 9 show that the coefficient of the instrument for land conflicts “closeness to colonial institutions” is statistically significant and negative.Footnote 34 This is the expected sign because counties with colonial institutions or those closer to counties with colonial institutions were places where the central government could more strongly enforce the land laws and deter landowners’ encroachments. The strength of the instrument is shown by the Stock-Yogo test for the Cragg-Donald F-statistic, which rejects the hypothesis of weak instruments at the 10 percent level if one is willing to accept a maximum weak instrument bias of 20 percent for 1892 and 10 percent for 1925.
Columns 6, 7, 10, and 11 of the same table exhibit the second-stage results for presence and level of export production in 1892 presence and level of coffee production in 1925. In the four models, the coefficient of land conflicts is negative. In fact, the IV Probit coefficient for land conflicts, which is statistically significant at the 1 percent level, indicates that the presence of land conflicts in a particular county reduced the probability of having export production in 1892 by 50 percent. The negative impact of the early twentieth century land conflicts was even stronger, as the presence of land conflicts in a particular county reduced the likelihood of coffee production in 1925 by 58 percent. Thus, weakness of property rights impeded a more rapid expansion of the export agriculture.
In the analysis of the levels of export production, the TSLS coefficients are both negative and significant at the 19 percent level for the 1892 equation and at the 2 percent level for the 1925 equations.Footnote 35 The effects of land conflicts on export production were considerable. To get an estimate of the size of the effects, we calculated the predicted values of the dependent variables with and without the presence of land disputes both for 1892 and 1925. The means for the other correlates were used in the predictions. If no land conflicts had occurred, per capita exportable production would have been 48 percent higher in 1892 and 169 percent higher in 1925 respectively. Hence, this means that land conflicts had limited impact before 1892 and a much stronger one in the 1900s. Thus it appears that land conflicts, which likely arose from the problems with defining effective property rights, contributed a great deal to the poor performance of the export economy and hence to the meager integration of Colombia in the international markets at the end of the nineteenth and early twentieth centuries.
As for the effects of other variables, the presence of public land allotments in a county was associated with greater export production of 0.43 log points (0.52 standard deviations) in 1892 and in 3.32 log points (1.5 standard deviations) of coffee production in 1925. In contrast, the dissolution of communal (indigenous) lands during the eighteenth century was associated with substantially lower coffee production in 1925 (–1.2 standard deviations), as those lands had been turned into haciendas strongly oriented to cattle raising and foodstuff crops for the domestic market.Footnote 36 Disentailment of church land was negatively related to export production in 1892 (0.13 standard deviations), but did not have a statistically significant relationship with coffee production in 1925.
CONCLUSIONS
The analysis confirms the hypothesis that export production in Colombia was slowed by land conflict that likely arose from the weakness of property rights on the agrarian frontier. The results show that in the absence of land conflict, export production might well have doubled. The peasant settlers’ lack of land titles fed their fear of encroachment, which may have inhibited them from sowing or increasing productivity to their highest potential. The limited transformation of informal property rights into formal ones, more in line with the economic opportunities of globalization, was one of the factors that contributed heavily to delay export development. We see this as one of a number of examples of how the lack of well-defined property rights institutions can slow economic performance.Footnote 37
Appendix 1: Data Sources
Production of exportable products per capita (Log 1892) is the logarithm of the value of the production of exportable products that includes coffee, cacao, sugar, plantain, and tobacco in 1892 prices. The data were provided by Boletín Trimestral de la Estadística Nacional, 1894.
Coffee production per capita (Log 1925) is the logarithm of the quantity of coffee trees in existence in 1925. The data were provided by Monsalve, Colombia Cafetera.
Distance from colonial institutions is calculated as the normalization of the average distance (between zero and one) of a county with respect to the nearest counties where there were encomiendas in 1560 and more than 20 slaves in 1800. It takes a value of one in the counties where there were both institutions and zero if there was neither institution in the counties at a maximum of 100 km distance. The data were provided by Tovar, No Hay Caciques, and Duque and Sánchez, “Instituciones.”
Distance from disentailments is calculated by taking into account the distance between the county in question and the nearest county with disentailed church properties. It takes a value of one when the county had disentailed properties and zero if the nearest county with this institution was at more than 100 kilometers distance. For those counties within the 100-kilometer range, a value of between zero and one was calculated, depending on the distance to the nearest county that reported this institution. The data were collected from the Archivo General de la Nación (AGN), Sección República, Fondo de Bienes Desamortizados (Rolls 1 to 30), Registro Oficial 1862–1864 and Diario Oficial 1865–1884.
Distance from public lands is calculated by taking into account the distance between the county in question and the nearest county with public land concessions. It takes a value of one when the county had public land concessions and zero if the nearest county with this institution was at more than 100 kilometers distance. For those counties within the 100 kilometer range, a value of between zero and one was calculated, depending on the distance to the nearest county that reported this institution. Data were collected from the Registro Oficial, 1862–1864 and Diario Oficial, 1865–1931.
Distance from dissolution of communal lands in eighteenth century is calculated by taking into account the distance between the county in question and the nearest county with dissolution of communal lands in the eighteenth century. It takes a value of one when the county had dissolution of protection in the eighteenth century, and zero if the nearest county with this institution was at more than 100 kilometers distance. For those counties within the 100 kilometer range, a value of between zero and one was calculated, depending on the distance to the nearest county that reported this institution. The data were provided by Tovar, Grandes Empresas and No Hay Caciques.
Dummy conflict 1827–1892 and 1893–1925 takes a value of one if the county had land conflict between 1827 and 1892 and between 1893 and 1925, respectively and zero if there were no conflicts. The data were extracted from Archivo de General de la Nación, Fondo de Tierras Baldías, and from LeGrand, Frontier Expansion.
Dummy production 1851 a matrix of variables for the production of sugar, tobacco, cacao, plantain, and coffee that take a value of one if the product was produced in the county in 1851 and zero if not. Information was obtained from Geografía Física y Política de la Confederación Granadina, volumes I, II, III, IV, and V, directed by General Agustín Codazzi.
Geographical Variables include altitude in meters above sea level; a fertility index reflecting the aptitude of the land for agricultural activities (drainage, erosion, natural slopes, sodium contents, and so on.); average precipitation in cubic centimeters; an index for the extension of primary, secondary, and tertiary rivers that run through the area of a county; average temperature in centigrade in the county; and measures of the minimum distance of the county from the Cauca River, from Bogotá, from Barranquilla on the Atlantic Ocean, and from Buenaventura on the Pacific Ocean. All the data were provided by Sánchez and Nuñez, “La Geografía.”