1. Introduction
Turbulence interactions with a free-surface are a main driver in the exchange of mass and momentum for a variety of situations. For example, in oceanic flows a proper understanding of aeration is needed to evaluate gas transfer between the ocean and the atmosphere (Kraus & Businger Reference Kraus and Businger1994; Chanson Reference Chanson1995; Herlina & Wissink Reference Herlina and Wissink2019; Farsoiya et al. Reference Farsoiya, Magdelaine, Antkowiak, Popinet and Deike2023). Near the hull of a ship, entrained air interacts with its components and propulsor to produce a bubbly wake that is critical for hydrodynamic performance (Masnadi et al. Reference Masnadi, Erinin, Washuta, Nasiri, Balaras and Duncan2020). These types of flow are very complex, with turbulence interacting with both phases, and current two-phase Reynolds-averaged Navier–Stokes approaches that are routinely used in engineering applications have to be modified from their single-phase formulations to account for different mechanisms in turbulent kinetic energy (TKE) transport and dissipation (Salvetti et al. Reference Salvetti, Zang, Street and Banerjee1997; Frederix et al. Reference Frederix, Mathur, Dovizio, Geurts and Komen2018; Draheim & Kornev Reference Draheim and Kornev2024; Yuan et al. Reference Yuan, Li, Carrica, Hendrickson and Yue2024).
Dimensionless numbers that are relevant to characterise these flows are the Reynolds (
 ${\textit{Re}}$
), Froude (
 ${\textit{Fr}}$
) and Weber (
 ${\textit{We}}$
) numbers, with defining velocity and length scales typically associated with the bulk turbulence. A qualitative map for different regimes based on
 ${\textit{Fr}}$
and
 ${\textit{We}}$
numbers is proposed by Brocchini & Peregrine (Reference Brocchini and Peregrine2001b
). In cases where both
 ${\textit{Fr}}$
and
 ${\textit{We}}$
are low, the gravitational and surface tension forces are large enough to minimise the deformation of the free-surface. This is the case for weak free-surface turbulence (FST), where the eddies under the surface play a role in the diffusion of gas through the interface, with distinct cases depending on the amount of shear due to the gas velocity above the liquid (Hunt Reference Hunt1984). A relationship between gas-transfer velocity and free-surface divergence is established in McKenna & McGillis (Reference McKenna and McGillis2004). For strong free-surface turbulence, both
 ${\textit{Fr}}$
and
 ${\textit{We}}$
are large, the free-surface then becomes notably wavy, with ‘scars’ and entraining the air above (Flack, Kveisengen & Nath Reference Flack, Kveisengen and Nath1961; Brocchini & Peregrine Reference Brocchini and Peregrine2001b
; Calado & Balaras Reference Calado and Balaras2024b
). Oceanic aeration is a clear example of strong FST, with dense bubble populations over a wide range of scales. At more moderate FST, air entrainment may still occur, however, with more disperse bubbles. The case of turbulent bulk shear flow below the free-surface with air entrainment has been studied both experimentally by André & Bardet (Reference André and Bardet2017) and through direct numerical simulations (DNS) by Yu et al. (Reference Yu, Hendrickson, Campbell and Yue2019).
Early DNS of low
 ${\textit{Fr}}$
turbulence interactions with a free-surface by Shen et al. (Reference Shen, Zhang, Yue and Triantafyllou1999) identified a thin viscous layer
 $(\delta _v \sim Re^{-1/2})$
, and a thicker blockage/source layer of the order of the integral length scale
 $(\delta _s \sim \ell )$
, where turbulent stress components are redistributed (vertical fluctuations dampened). Experiments in turbulent open-channel flow show that the submerged turbulence drives the low wavenumber footprint of the free-surface (such as the integral length scale), whereas for high wavenumbers, the capillary-gravity waves dominate (Savelsberg & van de Water Reference Savelsberg and van de Water2008). Similar observations were made by Guo & Shen (Reference Guo and Shen2010) using DNS to study the interaction between a free-surface and underlying homogeneous isotropic turbulence (HIT) at a Taylor microscale Reynolds number
 ${\textit{Re}}_{\lambda } \sim 30$
using nonlinear boundary conditions. Spectral analysis of the surface deformation showed propagating waves and turbulence induced roughness, where low wavenumbers correspond to travelling waves, while turbulent roughness appears in all wavenumbers. The relative importance of gravity and surface tension is a function of the critical wavenumber
 $\tilde {k}_{cr} = \sqrt {\textit{We}/{{\textit{Fr}}^{2}}}$
. By examining the TKE budgets they concluded that energy is primarily exchanged through free-surface upwelling and downwelling events. Flores, Riley & Horner-Devine (Reference Flores, Riley and Horner-Devine2017) performed spectral analysis of decaying turbulence close to a flat stress-free-surface, where an inertial subrange is seen for horizontal velocity components, and roughly one integral length scale from the surface the flow tends toward isotropy.
Sarpkaya (Reference Sarpkaya1996) commented that for the case of submerged HIT below a free-surface, there is a transfer of TKE from the vertical component to the horizontal directions (quasi-two-dimensional turbulence), and that the free-surface acts as an ‘imperfect mirror’ with some vortices attaching to the interface, while others flatten with the axis parallel to it. Merging of same sign vortices and cancellation of opposite sign vortices can skew the eddy size distribution towards larger ones, and produce a reverse energy cascade. This effect was termed the free-surface anisotropy dynamo. In DNS of open-channel flow with a flat free-surface, Lovecchio, Zonta & Soldati (Reference Lovecchio, Zonta and Soldati2015) observed upscale energy transfer and dual cascade associated with large scales. Recent experiments by Ruth & Coletti (Reference Ruth and Coletti2024) of submerged HIT up to
 ${\textit{Re}}_{\lambda } \approx 590$
, in a gravity dominated regime (low
 ${\textit{Fr}}$
, quasi-flat surface) showed that vertical and horizontal components of TKE follow predictions of the rapid distortion theory (RDT) of Hunt & Graham (Reference Hunt and Graham1978), with the integral scale of horizontal fluctuations growing as the surface is approached. Along horizontal separations the direct energy cascade of horizontal fluctuations is reduced, with a reverse cascade for vertical energy.
Overall for cases of moderate or strong FST, where the interface is highly disturbed, the stretched interface extracts energy from the underlying turbulence. However, there is limited understanding of the length scales at which energy can be returned back into the flow, and how this process depends on
 ${\textit{Fr}}$
and
 ${\textit{We}}$
numbers. Recent studies focusing on interfacial energy exchange have found that for disperse droplets or equal density two-phase flows in HIT, surface tension has a scale-dependent effect leading to an enhancement of TKE at high wavenumbers and dampening at low wavenumbers (see Dodd & Ferrante Reference Dodd and Ferrante2016; Vela-Martín & Avila Reference Vela-Martín and Avila2021; Crialesi-Esposito, Chibbaro & Brandt Reference Crialesi-Esposito, Chibbaro and Brandt2023; Saeedipour Reference Saeedipour2023). Currently most free-surface DNS assume very large or infinite
 ${\textit{We}}$
and limited
 ${\textit{Re}}$
numbers due to computational cost limitations (Yu et al. Reference Yu, Hendrickson, Campbell and Yue2019; Gaylo, Hendrickson & Yue Reference Gaylo, Hendrickson and Yue2024), or simply ignore the air phase by assuming a flat slip wall or free-surface boundary conditions (Guo & Shen Reference Guo and Shen2010; Lovecchio et al. Reference Lovecchio, Zonta and Soldati2015; Flores et al. Reference Flores, Riley and Horner-Devine2017). On the other hand, experimental studies are limited by the Earth’s gravitational environment and working fluid properties to very low
 ${\textit{Fr}}$
and
 ${\textit{We}}$
numbers (McKenna & McGillis Reference McKenna and McGillis2004; Variano & Cowen Reference Variano and Cowen2008; Ruth & Coletti Reference Ruth and Coletti2024; Jamin, Berhanu & Falcon Reference Jamin, Berhanu and Falcon2025). Additional challenges arise from entrained air bubbles and the complexity of measuring stresses and other local variables.
In the present work we perform high-fidelity DNS data of two-phase FST at a large density ratio (air–water) with significant interface deformation, including cases with air entrainment. We achieve closer matching of dimensionless numbers between DNS and available experiments by exploiting computational efficiencies from our in-house solver. The main goal is to assess the effect of
 ${\textit{Fr}}$
from low to moderate values (keeping
 ${\textit{Re}}$
and
 ${\textit{We}}$
high) on the Reynolds stress components and interfacial energy exchange from submerged HIT. In addition, we make use of data-driven tools such as discrete wavelet transforms (DWTs), which have only begun to be applied for the spectral analysis of two-phase flows (Freund & Ferrante Reference Freund and Ferrante2019; Calado & Balaras Reference Calado and Balaras2024a
). Flow topology near the interface is also investigated to clarify the behaviour of the turbulent dissipation rate. This work underscores the need for advanced analytical tools that allow for localisation in both physical and spectral domains to further elucidate the complex energy transfer mechanisms in FST.
2. Computational methodology
2.1. Two-phase solver
We use our in-house DNS code to solve the Navier–Stokes equations for incompressible, isothermal flow in dimensionless form, with variable properties
 \begin{align}&\qquad\qquad\qquad\qquad\qquad \boldsymbol{\nabla }\boldsymbol{\cdot }\boldsymbol{u} = 0, \end{align}
 \begin{align}& \frac {\partial \boldsymbol{u}}{\partial t} + \boldsymbol{u} \boldsymbol{\cdot }\boldsymbol{\nabla }\boldsymbol{u} = - \frac {\boldsymbol{\nabla \!}p}{\rho '} + \frac{1}{\rho' \textit{Re}} \nabla \boldsymbol{\cdot} \mu' \big( \nabla \boldsymbol{u} + \nabla \boldsymbol{u}^{\top} \big) {- \frac {\boldsymbol{e_z}}{\textit{Fr}^2}} + \boldsymbol{f}^T, \\[6pt] \nonumber \end{align}
where
 $\boldsymbol{u} = (u,v,w)^\top$
is the velocity vector,
 $p$
the pressure,
 $\boldsymbol{e_z}$
the unit vector in the vertical direction and
 $t$
is time;
 $\rho ' = \rho _i / \rho _2$
and
 $\mu ' = \mu _i / \mu _2$
are the ratios of density and dynamic viscosity, respectively, of the local fluid phase
 $(i=1,2)$
, with respect to the reference denser phase. An additional source term
 $\boldsymbol{f^T}$
is added to sustain turbulence and is described in § 2.2. The Reynolds, Weber and Froude numbers are hence defined as
 \begin{equation} Re = \frac {\rho _2 \tilde {U} \tilde {L}}{\mu _2}, \qquad \textit{We} = \frac {\rho _2 \tilde {U}^2 \tilde {L}}{\sigma }, \qquad \textit{Fr} = \frac {\tilde {U}}{\sqrt {g \tilde {L}}}, \end{equation}
where
 $\tilde {U}$
,
 $\tilde {L}$
,
 $g$
,
 $\sigma$
are the characteristic values for velocity, length, gravity and the surface tension coefficient. A staggered arrangement of the flow variables is adopted on a structured Cartesian grid, with all spatial derivatives approximated by second-order finite differences. A fractional step method is used to advance the Navier–Stokes equations in time, where all terms are computed in an explicit fashion using a second-order Adams–Bashforth (AB2) scheme. The pressure jump across the interface due to surface tension uses a variant of the ghost fluid method by Fedkiw et al. (Reference Fedkiw, Aslam, Merriman and Osher1999). The implementation details are discussed in Dhruv et al. (Reference Dhruv, Balaras, Riaz and Kim2019). The Poisson equation for pressure is written in a constant coefficient form, based on the splitting procedure introduced by Dodd & Ferrante (Reference Dodd and Ferrante2014).
The interface between the liquid and gas phase is tracked via conservative level-set approach. The level-set function,
 $\phi$
, corresponds to a signed distance function from the interface such that
 $\phi \gt 0$
indicates fluid 1 (gas) and
 $\phi \lt 0$
fluid 2 (liquid). A sharp interface approach is used to compute fluid properties and surface tension force. The unit normal vector,
 $\boldsymbol{n} = \boldsymbol{\nabla }\phi / |\boldsymbol{\nabla }\phi |$
, and interface curvature,
 $\kappa =\boldsymbol{\nabla }\boldsymbol{\cdot }\boldsymbol{n}$
, are computed directly from the level-set function. The advection equation for the level-set is discretised in space using a fifth-order weighted essentially non-oscillatory (WENO-5) scheme (Jiang & Peng Reference Jiang and Peng2000) and advanced in time with a third-order total variation diminishing Runge–Kutta scheme (Shu & Osher Reference Shu and Osher1988). A dual-redistancing approach is used at every time step to ensure the level-set remains a signed distance function while maintaining the global mass conservation of each phase (Chang et al. Reference Chang, Hou, Merriman and Osher1996; Zhang, Zheng & Hou Reference Zhang, Zheng and Hou1998; Calado, Yildiran & Balaras Reference Calado, Yildiran and Balaras2025).
2.2. Problem formulation
Statistically stationary HIT is sustained at a certain depth below the free-surface. Following previous studies by Guo & Shen (Reference Guo and Shen2009, Reference Guo and Shen2010) a bulk HIT forcing region with total height
 $2l_b$
is in between two symmetric damping regions of size
 $l_d$
. We similarly define the ratios
 $l_b / L = 0.75$
and
 $l_d / L = 0.25$
, with
 $L=5$
being the horizontal domain size imposed by the forcing scheme by Rosales & Meneveau (Reference Rosales and Meneveau2005). In order to preserve the isotropic nature of the turbulence, there must be sufficient length for both the bulk and damping regions (see Guo & Shen Reference Guo and Shen2009). From the top damping region the distance between mean free-surface is also
 $0.25 L$
. As such, no active forcing is present surrounding the intermittent free-surface. The boundary conditions are periodic on the horizontal (
 $xy$
) plane, with slip boundaries on the top and bottom (
 $z$
). The spatial forcing function,
 $f(z_p)$
, depends on the vertical distance to the centre of the bulk region,
 $z_p=|z-z_c|$
, and is given by
 \begin{equation} f(z_p)=\left \{ \begin{array}{@{}ll@{}} 1, & z_p \leqslant l_b, \\[4pt] \dfrac {1}{2} \left (1 - \text{cos}\left [ \dfrac {\pi }{l_d} \left (z_p-(l_b+l_d) \right ) \right ] \right )\!, & z_p \leqslant l_b+l_d,\\[4pt] 0, & z_p \gt l_b+l_d. \end{array}\right . \end{equation}
A schematic view of the domain and
 $f(z_p)$
is shown in figure 1(a). The instantaneous spatial average of the TKE,
 $k_b(t)$
, within the bulk region is used to modulate the forcing coefficient on the right-hand side of the momentum equation:
 \begin{equation} \boldsymbol{f}^T = f(z_p) a_0 \frac {k_0}{ k_b(t) } \boldsymbol{u}. \end{equation}
Here
 $a_0=1/3$
and
 $k_0 =3/2$
(Lundgren Reference Lundgren2003; Carroll & Blanquart Reference Carroll and Blanquart2013). The reference length scale is the integral scale of the generated turbulence,
 $\ell = u_0^3 / \varepsilon$
, where the reference velocity is the root-mean-square (r.m.s.) velocity,
 $u_0$
, and
 $\varepsilon$
is the turbulent dissipation rate. The total vertical domain height is
 $L_z = 3L = 15\ell$
, with a height of air above the free-surface equal to
 $2.5 \ell$
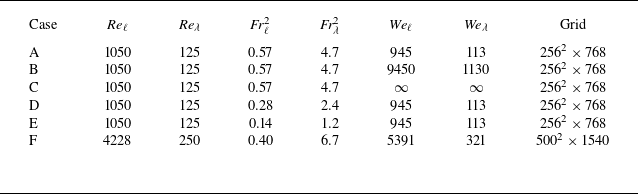
. The dimensionless parameters of the simulations relative to the integral and Taylor microscale (
 $\lambda$
) within the bulk forcing region are given in table 1 since those parameters are controlled. Given the nature of HIT, the r.m.s. velocity decays from the bulk to
 $z=-1.25 \ell$
by roughly 70 % (see Appendix A), where forcing is zero. The Taylor microscale is found to remain nearly constant with depth, hence, the Taylor scale Froude number near the free-surface is still of order unity, and can be considered moderate FST. For all cases, the density and viscosity ratios of air–water are considered:
 $\rho _2 / \rho _1 = 833.3$
,
 $\mu _2 / \mu _1 = 55.2$
. The grid is uniform and is of the same order of magnitude as the Kolmogorov scale
 $\eta = (\nu ^3 / \varepsilon )^{1/4}$
. The baseline grid has
 $256^2 \times 768$
points, with a refined grid in case F where
 ${\textit{Re}}$
is increased. While the variation in
 ${\textit{Re}}$
is limited due to computational costs, to the author’s knowledge the present DNS are the highest
 ${\textit{Re}}$
number isotropic FST flow to date with a deformable interface and air entrainment. The grid sizes are sufficient to capture all the relevant scales of turbulence and velocity gradients that reach the free-surface, from different metrics shown in the following sections. Statistics on entrained bubbles are shown in § 3, showing good agreement with expected scalings. The grid Weber number,
 ${\textit{We}}_{\Delta h}=(\rho _1+\rho _2)|u|^2\Delta h /(4 \pi \sigma )$
(Popinet Reference Popinet2018), for all cases except C (
 ${\textit{We}}=\infty$
) is calculated to be of order 1 or less, with a local velocity scale evaluated at
 $z=0$
. A snapshot rendering from the DNS showing the turbulent free-surface can be seen in figure 1(b).
Summary of free-surface turbulence DNS cases.

(a) Schematic view of the domain for the subsurface turbulence generation showing damping and bulk forcing regions. Mean free-surface is at
 $z=0$
. The profile on the right represents the spatial forcing function
 $f(z_p)$
. (b) Direct numerical simulation rendering of the turbulent free-surface.

For the analysis of the flow field data, we perform ensemble averaging over uncorrelated snapshots in time (one large eddy turnover time apart). A total of 10 snapshots are used, once the flow has reached a statistical steady state. Sensitivity of the number of snapshots used in the ensemble averaging has been verified in previous works (see Calado et al. Reference Calado, Yildiran and Balaras2025) and is shown in Appendix A. Unless otherwise specified, we define the averaging operator
 $\langle \boldsymbol{\cdot }\rangle$
as denoting ensemble averages over the horizontal plane in the water phase. As proposed by Brocchini & Peregrine (Reference Brocchini and Peregrine2001a
), we can define an intermittency function
 $\gamma$
based on the average volume fraction of water. We first define the Eulerian phase function,
 $I(\boldsymbol{x},t)$
,
 \begin{equation} I(\boldsymbol{x},t)=\left \{ \begin{array}{@{}ll@{}} 1 & \textrm {in water}, \\ 0 & \textrm {in air}, \\ \end{array}\right . \end{equation}
and through the averaging operator we obtain
 $\gamma (z) = \langle I(z) \rangle$
, as well as the intermittency layer,
 $\delta _i$
, where
 $0 \lt \gamma \lt 1$
.
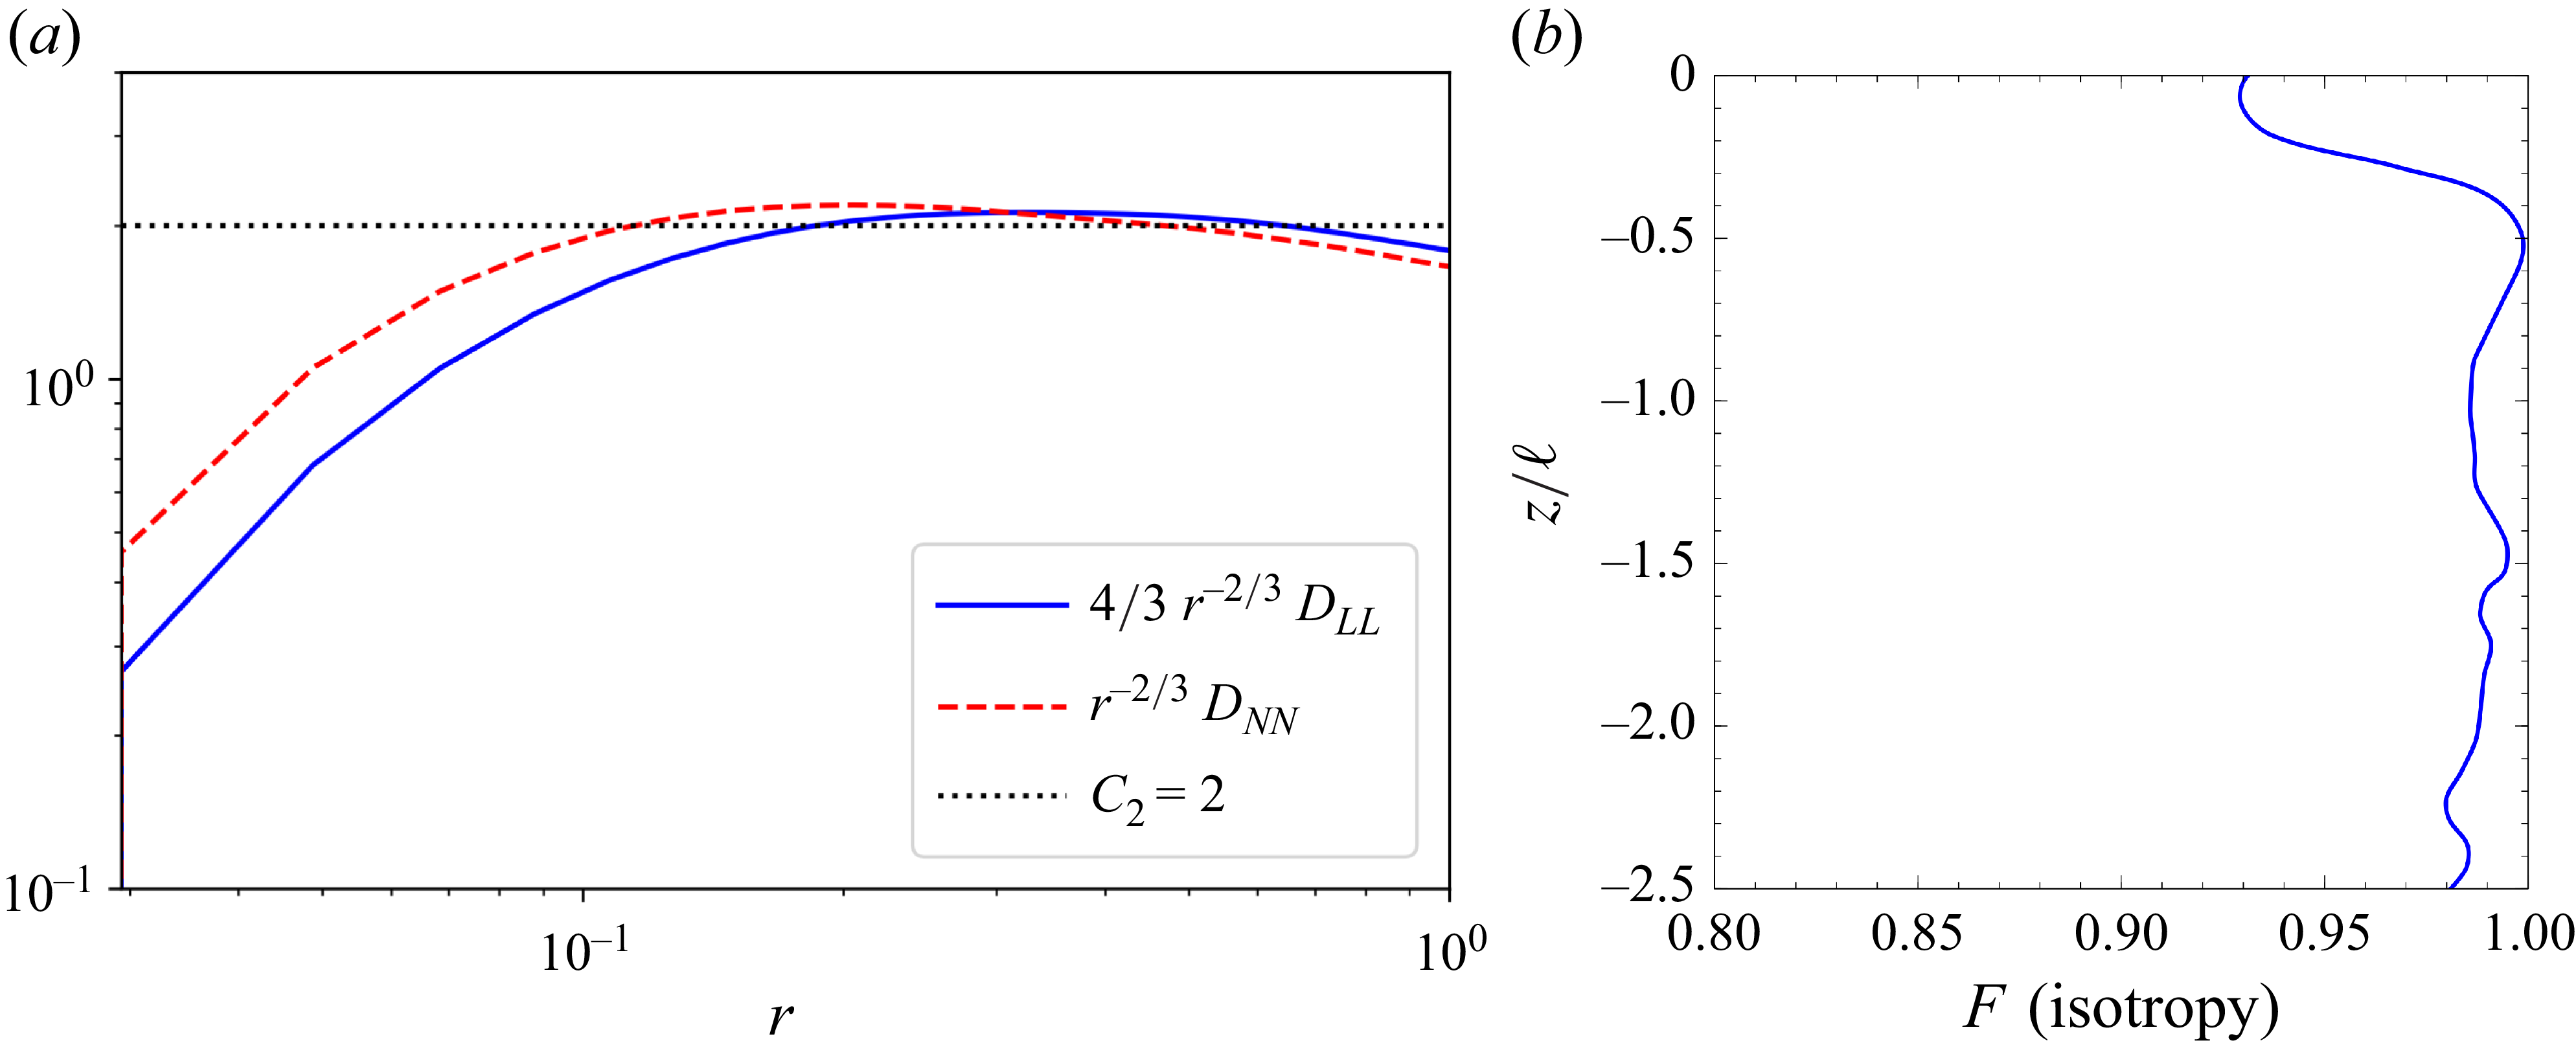
The generated turbulence in the bulk is verified to be isotropic by analysing different metrics: in figure 2(a) we plot the pre-multiplied longitudinal and transverse second-order structure functions (
 $D_{\textit{LL}}$
and
 $D_{\textit{NN}}$
), which exhibit a plateau around the constant
 $C_2 = 2.0$
in the inertial range (Pope Reference Pope2000). In addition, the level of isotropy as a function of the depth,
 $z$
, is quantified in figure 2(b) with the isotropy scalar,
 $F$
, which is bounded between 0 and 1 (pure isotropy):
 \begin{equation} F(z) = \frac {27 \langle u'^2 \rangle \langle v'^2 \rangle \langle w'^2 \rangle }{( \langle u'^2 \rangle + \langle v'^2 \rangle + \langle w'^2 \rangle )^3}. \end{equation}
We observe that the turbulence is indeed isotropic, with
 $F \gt 0.9$
within the bulk and damping regions,
 $z/\ell \lt -1.25$
, and for the selected case A, it remains isotropic until almost
 $z=0$
.
(a) Pre-multiplied longitudinal and transverse second-order structure functions in the bulk turbulence region. (b) Phase-averaged isotropy scalar
 $F$
as a function of depth. Data are for case A.

3. Entrained bubble statistics
For the higher
 ${\textit{Fr}}$
number cases (A, B, C and F), the simulated conditions are found to result in air entrainment, with numerous air bubbles below the free-surface. Furthermore, this range of
 ${\textit{Fr}}$
numbers are similar to those of Yu et al. (Reference Yu, Hendrickson, Campbell and Yue2019) when appropriately converting from shear-driven turbulence to HIT. In terms of entrained volume, we estimated that for all such cases
 $V_{e} / V_{i} \sim 10^{-4}$
, where
 $V_{i}=\delta _i L^2$
and
 $V_{e}$
is the total volume of entrained air at a given time. These cases included hundreds of bubbles for sampling, while case E showed no entrainment and case D was at the onset of entrainment, with only a few entrained bubbles. From these simulations we intend to investigate the effects of
 ${\textit{We}}$
number on the bubble sizes and their sphericity,
 $\alpha$
, defined as the ratio between the surface area of the volume equivalent sphere and their actual area (Clift, Grace & Weber Reference Clift, Grace and Weber2005). The values for
 $\alpha$
range between 0 and 1, where a higher value indicates closer resemblance to a spherical shape.
(a) The PDF of the equivalent bubble radius, and (b) the PDF of bubble sphericity,
 $\alpha$
(mean values shown as vertical dashed lines). Note that only cases with significant air entrainment are shown.

The approach to compute bubble surface area and volume is detailed in other work (Calado et al. Reference Calado, Yildiran and Balaras2025) and described here briefly. The algorithm amounts to first defining the interface contour from the level-set function (
 $\phi =0$
) as a 3-D triangulated surface. A connectivity filter is then applied to tag each bubble/surface with a unique region identifier. Looping over each bubble, we identify its centroid and compute the signed tetrahedral volume defined from each surface triangle and the region centroid (Lien & Kajiya Reference Lien and Kajiya1984). The surface area is simply computed by the sum of individual triangle areas. Note that the smallest bubbles with a volume below
 $(2 \Delta h)^3$
are considered under-resolved and are thus excluded from the statistics.
The probability density function (PDF) for the equivalent bubble radius is shown in figure 3(a), where values for the different cases collapse rather well. The distinct slopes of
 $-10/3$
and
 $-3/2$
are observed for super- and sub-Hinze sizes, respectively (Garrett, Li & Farmer Reference Garrett, Li and Farmer2000; Deane & Stokes Reference Deane and Stokes2002; Yu et al. Reference Yu, Hendrickson, Campbell and Yue2019). The influence of
 ${\textit{We}}$
number on the bubble size for the tested range appears to be negligible. The distribution is also unaffected by the increase in the
 ${\textit{Re}}$
number (case F), although the increased grid resolution is able to capture smaller bubble sizes that align with the
 $-3/2$
slope. In figure 3(b) we plot the PDF sphericity
 $\alpha$
for the same cases, along with their means (vertical dashed lines). We observe that the mean sphericity decreases as
 ${\textit{We}}$
increases, with only minor differences between cases B (
 ${\textit{We}}_\lambda =1130$
) and C (
 ${\textit{We}}_\lambda =\infty$
). Case F at the higher
 ${\textit{Re}}$
number exhibits the lowest average sphericity. These results are somewhat intuitive, since with the increase of
 ${\textit{We}}$
or
 ${\textit{Re}}$
we anticipate higher deformation from the submerged turbulence and weaker restorative forces from surface tension. Note that a lower sphericity also implies greater surface area (compared to a spherical bubble), which has implications when trying to account for the total interfacial area. For example, for an average sphericity of
 $\alpha = 0.75$
, this equates to a total surface area that is
 $ \sim\! 33 \%$
larger than that of a sphere of equivalent volume. Furthermore, the bubble shape and deformability can affect its rise velocity and modulate the surrounding turbulence (Ni Reference Ni2024). We remark that the Bond number (
 $Bo=\textit{We}/ \textit{Fr}^2$
) based on the entrained bubble sizes and velocity scales near the surface is small, and can play a role on the sphericity and deformation metrics.
Snapshot visualisation of interface (top view) for decreasing
 ${\textit{Fr}}^2$
(from left to right:
 ${\textit{Fr}}^2_{\lambda }=4.7, 2.4, 1.2$
). The interface is coloured by the
 $z$
coordinate. (a) Case A. (b) Case D. (c) Case E.

4. Free-surface characterisation
4.1. Surface deformation
In the case of a quasi-flat free-surface, a linear dependency of the vertical velocity component is expected around
 $z=0$
such that
 $w(z) \sim z \partial _z w$
(McKenna & McGillis Reference McKenna and McGillis2004; Lovecchio et al. Reference Lovecchio, Zonta and Soldati2015). This also implies that the surface divergence can be evaluated as
 $\boldsymbol{\nabla \!} _\bot \boldsymbol{\cdot }\boldsymbol{u} = \partial _x u + \partial _y v = - \partial _z w$
, and the local sign and magnitude can indicate the presence of upwelling or downwelling structures (Longuet-Higgins Reference Longuet-Higgins1996; Babiker et al. Reference Babiker, Bjerkebaek, Xuan, Shen and Ellingsen2023). This definition however is not valid for larger
 ${\textit{Fr}}$
and
 ${\textit{We}}$
where surface deformations are appreciable (nonlinear), as seen, for example, in figure 4. The orientation of the free-surface is quantified by plotting the distribution of its normal vector components in figure 5(a) for the lowest
 ${\textit{Fr}}$
number case (E): it is evident that the
 $x$
and
 $y$
components are symmetrically distributed around zero and that
 $n_z$
is dominant. Comparing the vertical component
 $n_z$
for the different
 ${\textit{Fr}}$
we considered (see figure 5
b), we observe that even though
 $n_z \approx 1$
is most common, the distribution tends to be flatter indicating that the horizontal components become more relevant as the free-surface becomes increasingly deformed. Hence, we propose that the surface divergence be evaluated using the 3-D normal vector as
 \begin{equation} \boldsymbol{\nabla \!} _\bot \boldsymbol{\cdot }\boldsymbol{u} = n_x \partial _x u + n_y \partial _y v + n_z \partial _z w. \end{equation}
(a) The PDF of free-surface normal components for case E, (b) PDF of
 $n_z$
for different
 ${\textit{Fr}}$
, and (c) PDF of
 $(\boldsymbol{\nabla \!} _\bot \boldsymbol{\cdot }\boldsymbol{u})^2$
and
 $\omega _z^2$
, scaled by r.m.s., for case E.

An alternative metric indicative of the deformation of the interface is related to the net stretching of the interface by the strain rate tensor
 $\boldsymbol{S}=(\boldsymbol{\nabla }\boldsymbol{u}+ \boldsymbol{\nabla }\boldsymbol{u}^{\top })/2$
introduced by Vela-Martín & Avila (Reference Vela-Martín and Avila2021), and written out in Cartesian coordinates as
 \begin{align} {\vartheta } &= -\boldsymbol{n}^\top \boldsymbol{\cdot }\boldsymbol{S} \boldsymbol{\cdot }\boldsymbol{n} \nonumber\\ &= n_x^2 \partial _x u + n_y^2 \partial _v + n_z^2 \partial _z w + n_x n_y (\partial _y u + \partial _x v) + n_x n_z (\partial _x w + \partial _z u) + n_y n_z (\partial _y w + \partial _z v) .\end{align}
This surface energy increase from net stretching
 $\vartheta \gt 0$
(or
 $\vartheta \lt 0$
in the case of compression) is scaled by the surface tension coefficient or
 ${\textit{We}}$
number as
 $\hat {\vartheta } = \vartheta / \textit{We}$
. The total energy being absorbed or released from the interface is thus proportional to
 $\varPsi _\sigma \propto - \int _\varGamma \hat {\vartheta } d\varGamma$
and can also be related to the rate of change of total interfacial area (see Dodd & Ferrante Reference Dodd and Ferrante2016; Calado & Balaras Reference Calado and Balaras2024a
). The resemblance between (4.1) and (4.2) is clear, although
 $\vartheta$
is introduced in the more general context of surface energy calculation for multiphase flows. In figure 5(c) we also observe that
 $(\boldsymbol{\nabla \!} _\bot \boldsymbol{\cdot }\boldsymbol{u})^2$
and
 $\omega _z^2$
at the free-surface exhibit a power law tail for small values, attributed to a chi-squared type distribution where small velocity gradients acts as random variables, highlighted in the experiments of Qi, Li & Coletti (Reference Qi, Li and Coletti2025). These variables involve a single squared term, resulting in
 $\beta = 1$
degrees of freedom, and a
 $\beta /2-1=-1/2$
scaling.
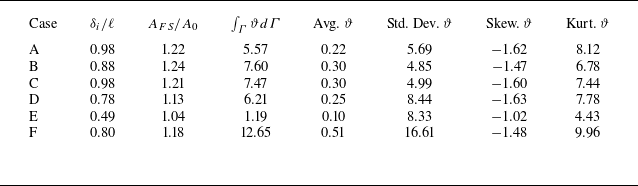
Ensemble-averaged statistics for the free-surface are presented in table 2. We compute different quantities that reflect the extent of deformation experienced by the free-surface for the different cases. These include the intermittency layer
 $\delta _i$
, the ratio of total free-surface area
 $A_{FS}$
with initial flat surface area
 $A_0 = L^2$
and the surface integral
 $\int _{\varGamma } \vartheta d\varGamma$
indicating the net stretching effect. The PDF for
 $\vartheta$
is characterised in terms of the mean, standard deviation, skewness and kurtosis.
Ensemble statistics for free-surface deformation.

Comparison of free-surface contours for different surface deformation metrics for a snapshot of case E. Results are shown for (a)
 $- \partial _z w$
, (b)
 $\boldsymbol{\nabla \!} _\bot \boldsymbol{\cdot }\boldsymbol{u}$
and (c)
 $\vartheta$
.

We observe that the free-surface statistics are comparable between cases A, B and C, with a relative increase in surface area around
 $\sim\! 20 \,\%$
and weakly dependent on
 ${\textit{We}}$
. Note that, for this problem, since
 ${\textit{Fr}}^2 \ll \textit{We}$
, it is gravity that dominates the interfacial dynamics at larger scales, even though these three cases are considered to be in the moderate FST regime
 $(\textit{Fr}^2_{\lambda } \sim \mathcal{O}(1))$
as shown in figure 4(a), with air entrainment. The intermittency layer is found to be of the order of the integral length scale
 $\delta _i \sim \ell$
, although decreasing with
 ${\textit{Fr}}$
. Decreasing
 ${\textit{Fr}}$
in cases D and E shows a reduction in the total surface area and net stretching effect from
 $\vartheta$
, since the gravity force increases that stabilises any disruptions from the free-surface. Finally, for the high-
 ${\textit{Re}}$
case F, the total surface area is comparable to cases A and D, given the similar integral scale
 ${\textit{Fr}}^2_{\ell }$
, which determines the large-scale deformation. On the other hand, the statistics for the mean and variance of
 $\vartheta$
are much higher, indicative of higher velocity gradients at the interface, and smaller
 $\lambda$
.
Finally, we comment on the fact that all cases show a negative skewness and high kurtosis (super-Gaussian) for
 $\vartheta$
, which indicate large tails, with more extreme values of
 $\vartheta \lt 0$
, or compression. These are associated with the ridges seen in figure 6 that are thin and elongated, compared to regions of upwelling where
 $\vartheta \gt 0$
. As also observed by Longuet-Higgins (Reference Longuet-Higgins1996), the regions of downwelling have signature steeper waves and they surround smoother regions of upwelling. This can be tied to the upwelling versus downwelling events and their energy. Ruth & Coletti (Reference Ruth and Coletti2024) pointed out that downwellings compress energy to small scales and are less energetic compared to upwellings, which are associated with larger scales. Our results for the TKE exchange near the free-surface are presented in § 5.
4.2. Two-dimensional compressibility
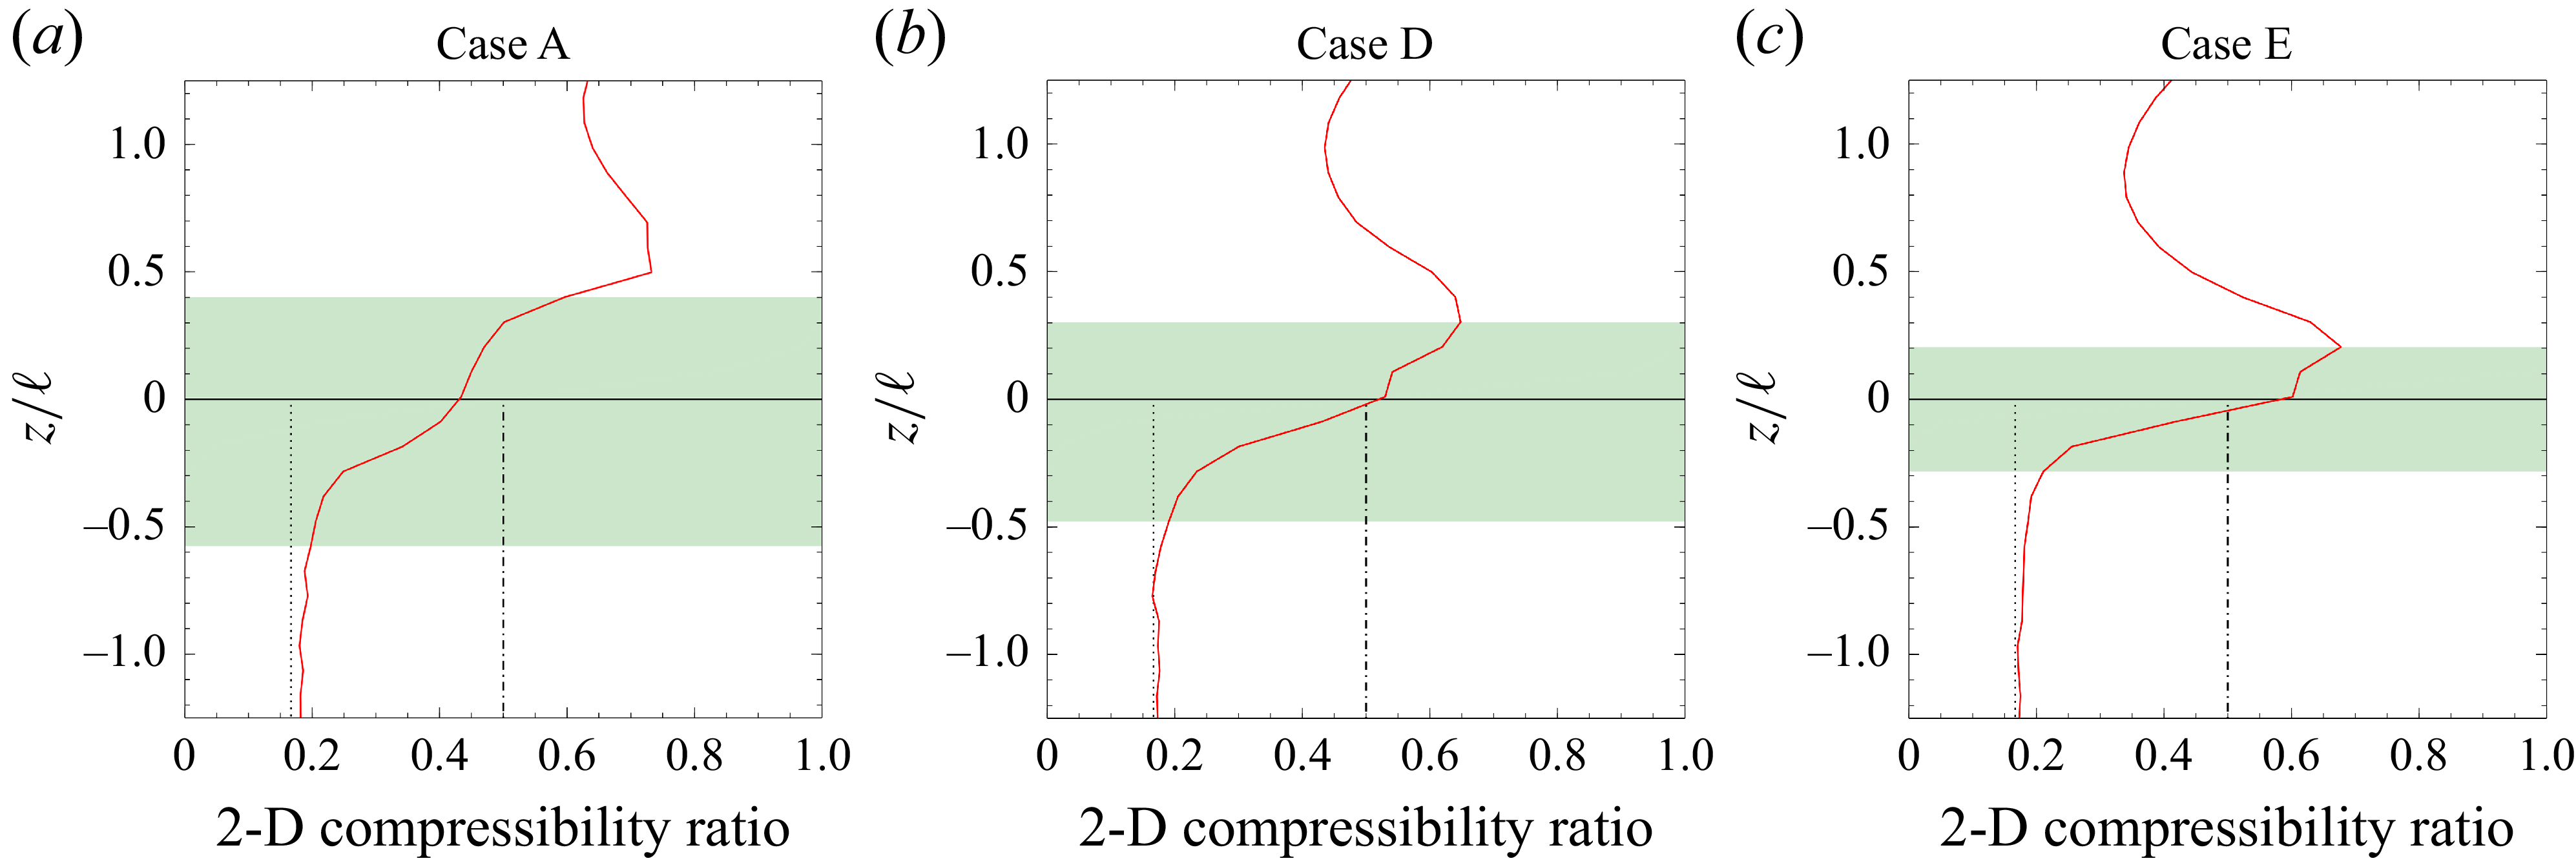
Another measure of the free-surface dynamics is the Eulerian compressibility ratio that can take values between 0 and 1. The compressibility effect can be linked to the directionality of the energy transfer (Chertkov, Kolokolov & Vergassola Reference Chertkov, Kolokolov and Vergassola1998; Lovecchio et al. Reference Lovecchio, Zonta and Soldati2015) and in free-surface flows results in Lagrangian particle clustering (Boffetta et al. Reference Boffetta, Davoudi, Eckhardt and Schumacher2004). By definition this factor is zero in three-dimensional (3-D) incompressible flows, however, in the case of homogeneous flow in the plane, this ratio can be computed in two dimensions as
 \begin{equation} \mathcal{C} = \frac {\left\langle (\boldsymbol{\nabla}_{\kern-1.5pt \textit{xy}} \boldsymbol{\cdot }\boldsymbol{u})^2 \right\rangle }{\langle |\boldsymbol{\nabla}_{\kern-1.5pt \textit{xy}} \boldsymbol{u}|^2 \rangle } = \frac {\left\langle (\partial _x u + \partial _y v)^2 \right\rangle }{ \left\langle (\partial _x u)^2 + (\partial _x v)^2 + (\partial _y u)^2 + (\partial _y v)^2 \right\rangle }. \end{equation}
Note that in this definition we consider a continuous velocity field and ignore phase distribution. A two-dimensional (2-D) cut through 3-D HIT results in an asymptotic value of
 $\mathcal{C} = 1/6$
, while values close to
 $1/2$
are observed near the free-surface in low
 ${\textit{Fr}}$
number experiments and DNS with a slip wall boundary condition (Cressman et al. Reference Cressman, Davoudi, Goldburg and Schumacher2004; Lovecchio et al. Reference Lovecchio, Zonta and Soldati2015). The value of
 $\mathcal{C}=1/2$
is also the theoretical limit for compressible 2-D Kraichnan flow (Chertkov et al. Reference Chertkov, Kolokolov and Vergassola1998) and also implies a null cross-correlation for
 $\langle \partial _xu \, \partial _y v \rangle$
(Boffetta et al. Reference Boffetta, Davoudi, Eckhardt and Schumacher2004). Results from our DNS are given in figure 7 for different
 ${\textit{Fr}}$
numbers. We observe a similar behaviour to previous studies, with an increasing value of
 $\mathcal{C}$
from
 $1/6$
in the pure water depths to
 $\mathcal{C} \approx 1/2$
at
 $z=0$
. Since data from the air side is also available, we plot the values for
 $z\gt 0$
, indicating a continued increase until the upper limit of
 $\delta _i$
is reached. As the
 ${\textit{Fr}}$
number is decreased, the value of
 $\mathcal{C}$
at
 $z=0$
decreases, with a stronger inflection for the highest
 ${\textit{Fr}}$
case. This shows that as turbulence becomes stronger, the apparent 2-D compressibility drops in magnitude while
 $\delta _i$
grows.
Two-dimensional compressibility ratio
 $\mathcal{C}$
as a function of depth. The green shaded region indicates the intermittency layer
 $\delta _i$
; vertical lines are shown for
 $\mathcal{C}=1/6$
(dotted) and
 $\mathcal{C}=1/2$
(dash-dotted). (a) Case A (b) Case D (c) Case E.

4.3. Vorticity alignment
In an incompressible interfacial flow, the only mechanism to generate vorticity is the inviscid relative acceleration between fluids due to tangential pressure gradients or body forces (see Terrington et al. Reference Terrington, Hourigan and Thompson2022b ). Surface normal vorticity can appear either from advection across the interface or from viscous diffusion of tangential vorticity. This leads to the attachment of vortex filaments to the free-surface, such that the kinematic condition is satisfied (vortex filaments do not end inside a fluid). The no-slip condition between two fluids imposes the normal vorticity component to be continuous, while the tangential components are related to the interface curvature (Dopazo, Lozano & Barreras Reference Dopazo, Lozano and Barreras2000).
Ignoring the absolute value in the sign of vorticity, we compute the averages of squared vorticity components,
 $\langle \omega _i^2 \rangle$
, and plot them in figure 8(a) for case A. Note that these averages are not phase averaged. The vorticity is seen to be isotropic below
 $z/\ell \lt -0.5$
, with a change in behaviour approaching
 $z=0$
, with an inflection for all components, and a stronger increase in horizontal components. This was seen consistently in all cases, although as
 ${\textit{Fr}}$
decreases, the increase in the vertical component
 $\omega _z$
is negligible. The vorticity alignment with the free-surface can be evaluated using the dot product between the vorticity
 $\boldsymbol{\omega } = \boldsymbol{\nabla }\times \boldsymbol{u}$
and the normal vector (Mukherjee et al. Reference Mukherjee, Safdari, Shardt, Kenjereš and Akker2019; Vela-Martín & Avila Reference Vela-Martín and Avila2021; Cannon, Soligo & Rosti Reference Cannon, Soligo and Rosti2024):
 \begin{equation} \textrm {cos}(\theta _{\omega }) = \frac {\boldsymbol{n}\boldsymbol{\cdot }\boldsymbol{\omega }}{|| \boldsymbol{\omega } ||}. \end{equation}
Plotting the PDF of this function shows a symmetric distribution around
 $\textrm {cos}(\theta _\omega ) = 0$
that can be approximated by a Laplacian distribution
 $\mathcal{L} (x|s) = \textrm {exp}( - |x|/s)/(2s)$
with scale parameter
 $s=0.3$
, as seen in figure 8(b). Using this model, Laplacian distribution equates to
 $\sim\! 80 \,\%$
probability for the angle
 $\theta _\omega$
being greater than
 $60^\circ$
. This distribution was also found to be weakly dependent on
 ${\textit{Fr}}$
and
 ${\textit{We}}$
. These results indicate that the vorticity is mainly oriented parallel to the free-surface, in agreement with other works for free-surface and disperse two-phase flows (Sarpkaya Reference Sarpkaya1996; André & Bardet Reference André and Bardet2017; Yu et al. Reference Yu, Hendrickson, Campbell and Yue2019; Masnadi et al. Reference Masnadi, Erinin, Washuta, Nasiri, Balaras and Duncan2020; Vela-Martín & Avila Reference Vela-Martín and Avila2021; Calado & Balaras Reference Calado and Balaras2024a
). We observe that the case with the lowest
 ${\textit{Fr}}$
number has some differences at the tails, indicating a higher likelihood for vortices to connect normal to the interface due to stronger gravity and a flatter interface.
(a) Squared vorticity components (non-phase averaged) normalised by values at
 $z/\ell =-1.25$
for case A, (b) PDF of
 $\textrm {cos}(\theta _\omega )$
for different
 ${\textit{Fr}}$
and Laplacian distribution.

Comparing the plots of the absolute value for interface curvature
 $| \kappa _\varGamma |$
and the vorticity magnitude
 $|| \boldsymbol{\omega }||$
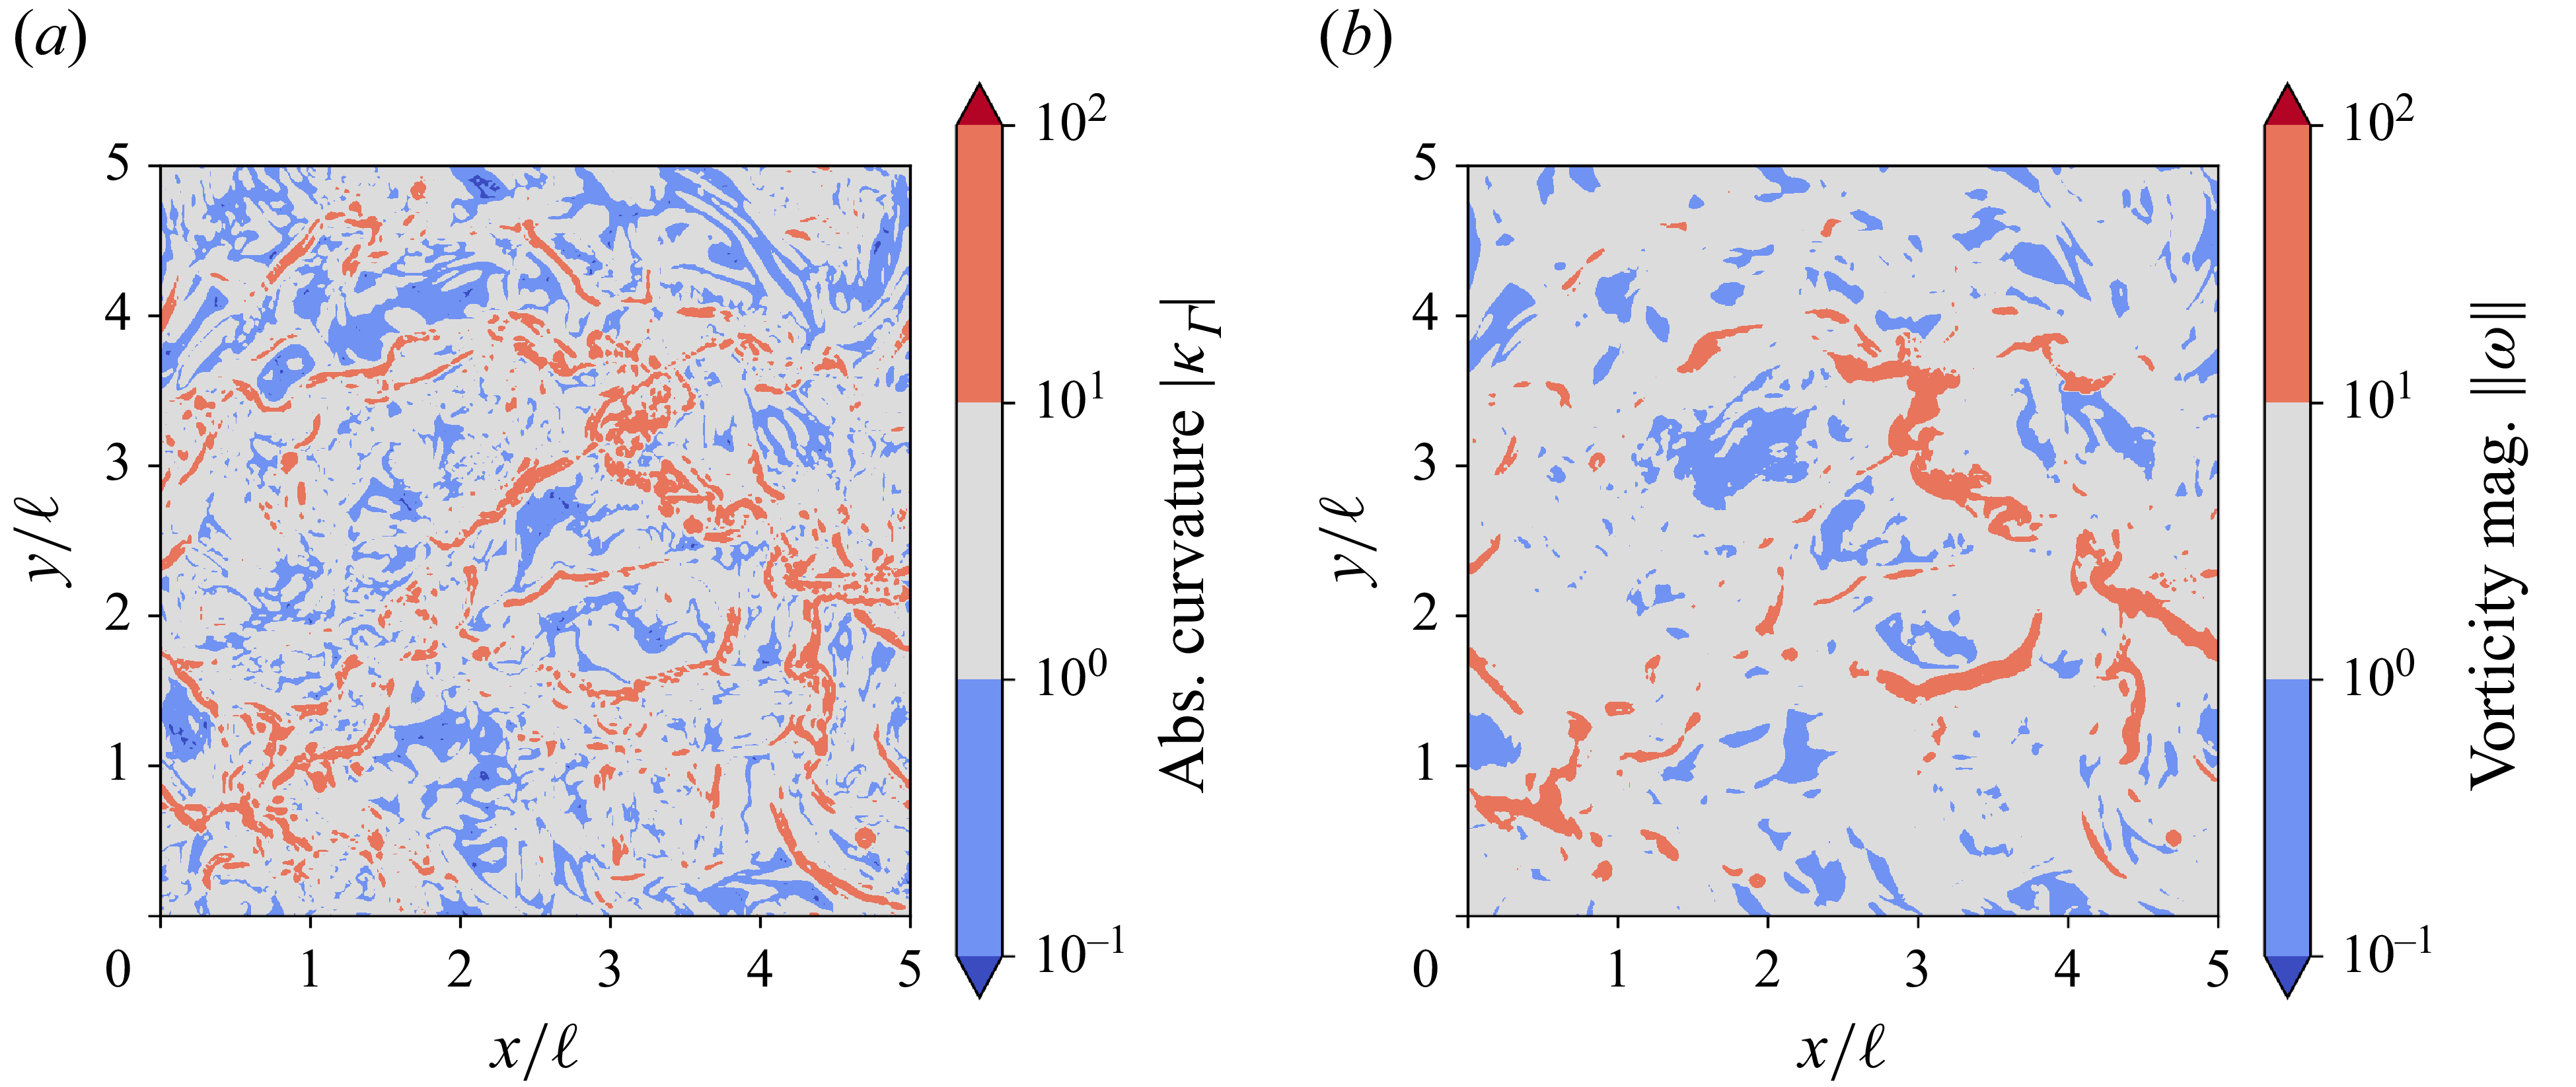
on a logarithmic scale in figure 9, we can observe that regions of high curvature form continuous streaks or scars, which is a characteristic signature of free-surface flows (Brocchini & Peregrine Reference Brocchini and Peregrine2001b
). The vorticity magnitude is seen to be highly correlated with the absolute value of curvature. From these plots and the observed distributions of
 $\theta _\omega$
, we can infer that most of the vorticity flux across the free-surface is attributed to the viscous diffusion of tangential vorticity (Dopazo et al. Reference Dopazo, Lozano and Barreras2000; Terrington et al. Reference Terrington, Hourigan and Thompson2022a
, Reference Terrington, Hourigan and Thompson2022b
). This is clearly visualised in figure 10 by plotting
 $Q = (||\boldsymbol{\varOmega }||^2_F - ||\boldsymbol{S}||^2_F)/2$
criterion (
 $Q\gt 0$
) isosurfaces near the free-surface, where
 $\boldsymbol{\varOmega }=(\boldsymbol{\nabla }\boldsymbol{u}- \boldsymbol{\nabla }\boldsymbol{u}^{\top })/2$
is the rotation rate tensor and
 $|| \boldsymbol{\cdot }||^2_F$
is the Frobenius norm squared. We choose case F specifically for this visualisation given the greater grid resolution, although results are similar for other cases. Within roughly one integral length scale (blockage layer), the vortices transition from randomly oriented in the bulk, towards being parallel to the free-surface.
Snapshot contour maps of the free-surface on a log scale for (a) the absolute interface curvature and (b) the vorticity magnitude. Data refers to case A.

The
 $Q$
criterion isosurfaces above
 $z/\ell \gt -1.25$
, coloured by distance to the interface for case F. Only a limited number of the largest structures are shown for clarity.

5. Kinetic energy exchange
5.1. Reynolds stresses
First we look at the Reynolds stress components near the free-surface and how they are modulated by the
 ${\textit{Fr}}$
number. In figure 11 we compare the vertical fluctuating velocities for different
 ${\textit{Fr}}$
numbers to RDT predictions. Note that
 $\langle w^{\prime}_{\textit{rms}} \rangle \propto (|z| + \delta _v)^{1/3}$
, with
 $\delta _v \approx 4 Re_{\ell }^{-1/2}$
(Hunt & Graham Reference Hunt and Graham1978; Variano & Cowen Reference Variano and Cowen2008). The vertical component
 $\langle w^{\prime}_{\textit{rms}}\rangle$
is seen to agree well with the trend from RDT at lower
 ${\textit{Fr}}$
numbers. Potential discrepancies here can be tied to the moderate
 ${\textit{Re}}$
number, since RDT is based on the inviscid assumption (see Ruth & Coletti Reference Ruth and Coletti2024). The horizontal components are seen to remain higher than vertical components, particularly for the lower
 ${\textit{Fr}}$
numbers where blockage effects are increased. We also note an inflection point above the viscous layer
 $\delta _v$
.
The r.m.s. velocities for different
 ${\textit{Fr}}$
numbers for the (a) vertical component and (b) horizontal component. Data normalised by values at
 $z/\ell =-1.25$
.

Lumley triangle plot for case A (red circles) and case E (blue triangles) for
 $-1.25 \leqslant z \leqslant 0$
. The darker hue of the crosses corresponds to depths approaching
 $z=0$
.

The variation in Reynolds stress components can alternatively be visualised by plotting the Lumley triangle as a function of depth (Pope Reference Pope2000; Yu et al. Reference Yu, Hendrickson, Campbell and Yue2019). Starting from the normalised anisotropy tensor
 $b_{\textit{ij}} = {\langle u_i u_j \rangle } / {\langle u_k u_k \rangle }- 1/3 \delta _{\textit{ij}}$
we compute the two independent tensor invariants
 $\chi$
and
 $\xi$
, defined as
 $ \chi = (b_{\textit{ij}}b_{\textit{ji}} / 6)^{1/2}$
and
 $\xi = (b_{\textit{ij}}b_{jk}b_{ki} / 6)^{1/3}$
. The cases of lowest and highest
 ${\textit{Fr}}$
numbers (A and E) are plotted in figure 12 for depths between
 $z/\ell =-1.25$
and
 $z=0$
. The isolines of
 $F=0.6$
and
 $F=0.9$
are also plotted for reference. We clearly see that in case A (higher
 ${\textit{Fr}}$
), the isotropy is maintained as the depth is decreased, with
 $F\gt 0.9$
. However, as
 ${\textit{Fr}}$
is decreased in case E, the turbulence is modulated from isotropic to two-component axisymmetric, due to the increase in horizontal energy at the expense of vertical fluctuations. These results oppose the postulation by Sarpkaya (Reference Sarpkaya1996) that any turbulence field approaching a free-surface becomes two dimensional. While this is certainly the case for lower
 ${\textit{Fr}}$
numbers, the turbulence tends to remain isotropic with higher
 ${\textit{Fr}}$
since there is a reduced blockage effect.
Instantaneous horizontal slice of
 $w'|w'|$
for depths
 $z/\ell =-2.5$
(a) and
 $z/\ell =-1$
(b) for case A. Conditionally averaged statistics for vertical kinetic energy based on sign, normalised by values at
 $z/\ell =-2.5$
for case A (c); ratio of upwelling to downwelling energy for cases A and E (d).

Another relevant question investigated by Ruth & Coletti (Reference Ruth and Coletti2024) is the relative roll of upwellings versus downwellings in transporting vertical kinetic energy. In the low
 ${\textit{Fr}}$
number cases investigated in their work, they found that upwellings carry more vertical energy, while downwellings move more horizontal energy due to compressive effects from the free-surface. We investigate these statistics by conditionally averaging the vertical energy,
 $\langle w'^2 \rangle$
, based on its sign:
 $w' \gt 0$
for upwellings and
 $w' \lt 0$
for downwellings. An instantaneous snapshot of
 $w'|w'|$
on horizontal slices at depths of
 $z/\ell =-2.5$
and
 $z/\ell =-1$
in figures 13(a) and 13(b), respectively, also support this fact (
 $w'|w'|$
indicates both the magnitude of kinetic energy and its relative motion). Quantitative results are given in figure 13(c) on a semi-log scale and show qualitative agreement with the experiments of Ruth & Coletti (Reference Ruth and Coletti2024). In figure 13(d) we compute the ratio of upwelling energy to downwelling energy
 $\langle w'^2\rangle ^{+} / \langle w'^2\rangle ^{-}$
for cases A and E, showing a higher ratio for larger
 ${\textit{Fr}}$
at depths within the blockage layer. For greater depths, the turbulence does not sense the influence of the free-surface, and kinetic energy is transported equally in both vertical directions, while within the blockage layer,
 $\delta _s$
, the upwellings bring the necessary energy to stretch out the free-surface. Within the viscous layer
 $\delta _v$
this ceases to be true and vertical energy tends to recover isotropy.
5.2. Presence of upscale transfer
The third-order structure function is useful to determine the cascading direction of TKE. In particular, its sign indicates either a forward (
 $-$
) or reverse (
 $+$
) energy cascade at the specific length scale
 $r$
(Lovecchio et al. Reference Lovecchio, Zonta and Soldati2015; Ruth & Coletti Reference Ruth and Coletti2024). According to the Kolmogorov
 $4/5$
law, the archetypal cascade for HIT compresses energy from large to small scales within the inertial subrange, reflected in a negative third-order structure function (Pope Reference Pope2000). Following Ruth & Coletti (Reference Ruth and Coletti2024) we define the TKE in the
 $i$
component of velocity difference between two points
 $q_i = \Delta u_i (\boldsymbol{x},\boldsymbol{r})^2 = [u_i(\boldsymbol{x}+\boldsymbol{r})-u_i(\boldsymbol{x})]^2$
. The compression or stretching of energy is thus given by
 $q_i (\boldsymbol{x},\boldsymbol{r}) \Delta u_j (\boldsymbol{x},\boldsymbol{r})$
. By ensemble averaging in time and along the homogeneous horizontal direction (
 $j=x,y$
), we can define the inter-scale energy transfer rate for a separation length
 $r$
as a function of the vertical coordinate
 $\langle q_i \Delta u_j \rangle (z,r)$
. For horizontal velocity differences,
 $\langle q_x \Delta u_x \rangle$
equates to the longitudinal third-order structure function
 $D_{LLL}$
(Pope Reference Pope2000). In figure 14 we plot
 $\langle q_x \Delta u_x \rangle$
and
 $\langle q_z \Delta u_x \rangle$
for depths above
 $z/\ell =-1.25$
for different
 ${\textit{Fr}}$
numbers (cases A, D and E). Note that these statistics are computed considering the water phase only and are normalised by
 $\langle k \rangle ^{3/2}$
at the same depth. As a reference, we also plot the same functions for case A within the bulk HIT region.
Within the single-phase bulk region we observe the typical forward cascade (negative sign) and
 $\langle q_x \Delta u_x \rangle \propto -r$
within the inertial range (Pope Reference Pope2000). For case A, the difference between horizontal and vertical energy fluxes are smaller compared to lower
 ${\textit{Fr}}$
numbers. At greater depths the flux is still mostly negative (forward) for small scales, but much smaller in magnitude compared to the bulk. As we approach the free-surface there is evidence of upscale energy transfer above
 $r/\ell \sim 0.1-0.2$
and below which the flux is close to zero, indicative of a bi-directional energy transfer (i.e. forward and reverse). Pan & Banerjee (Reference Pan and Banerjee1995) also investigated the inter-scale energy transfer from spectral analysis and verified that at large scales both significant forward and reverse transfer can occur (although net forward), while for smaller scales (high wavenumbers), magnitudes are comparable, yielding roughly net zero exchange. For cases D and E, with the reduction in
 ${\textit{Fr}}$
the upscale energy exchange is only evident for the vertical component,
 $\langle q_z \Delta u_x \rangle$
. Results for the lowest
 ${\textit{Fr}}$
case show qualitative agreement with Ruth & Coletti (Reference Ruth and Coletti2024), which also showed
 $\langle q_z \Delta u_x \rangle \gt 0$
near the free-surface, as evidence of the upscale transfer effect. Finally, we plot both
 $\langle q_x \Delta u_x \rangle$
and
 $\langle q_z \Delta u_x \rangle$
as a function of depth for
 $r/\ell =0.5$
. We also indicate
 $\delta _i$
in the shaded green region, where
 $\gamma$
drops rapidly from 1 to
 $0.5$
at
 $z=0$
, potentially affecting the phase-averaged statistics in this layer. The trends are consistent across cases in that the vertical motions are more prone to an upscale energy transfer at these larger scales, relative to horizontal ones. The presence of the free-surface inhibits the forward/downscale transfer by limiting compression and favouring horizontal stretching due to the more energetic upwellings. Statistics for the inter-scale energy transfer function were found to be similar between cases A and F at higher
 ${\textit{Re}}$
. Note that these metrics are relative to specific components of the kinetic energy along the horizontal direction and that net TKE flux at the same depth can still remain downscale as described in Pan & Banerjee (Reference Pan and Banerjee1995). While these functions indicate upscale energy transfer at larger scales near the interface, this does not necessarily demonstrate scale locality for a cascade process, where energy would transfer gradually between adjacent scales. Vortex mergers may contribute to non-local effects and future work is needed to quantify the degree of locality in these flows. We also observe that entrained bubbles have a radius below
 $r/\ell \lt 0.1$
, where a downscale transfer is observed.
Inter-scale energy transfer as a function of depth and horizontal separation: (ac) horizontal TKE and (df) vertical TKE; (gi) vertical and horizontal components for
 $r=0.5 \ell$
, with
 $\delta _i$
shaded in green. Cases are A, D and E from left to right (decreasing
 ${\textit{Fr}}$
). The red solid line represents transfer in the bulk HIT region for reference.

5.3. Energy spectra
To complement the quantitative analysis of the different components of TKE and at which length scales they are present, we compute the traditional one-dimensional (1-D) Fourier spectra at a fixed depth in the water phase. In figure 15 we compare the horizontal
 $(E_{uu})$
and vertical
 $(E_{ww})$
velocity power spectral density (PSD) for cases A and E at different
 ${\textit{Fr}}$
numbers at the same
 $z/ \ell =-0.25$
. Similar to the results from the Lumley plot (figure 12), we observe that case A has higher isotropy since the PSDs are comparable, and follow the
 $\tilde {k}^{-5/3}$
law characteristic of the inertial subrange. Case E (lower
 ${\textit{Fr}}$
) shows a higher magnitude for
 $E_{uu}$
relative to
 $E_{ww}$
for the lowest wavenumbers that are the most energetic. For mid and high wavenumbers, the PSD is comparable, indicating that anisotropy is mostly associated with the largest scales. In addition, a steeper decay in energy is noted for the lower
 ${\textit{Fr}}$
case (E) relative to case A; similar trends are also reported in the literature (Yu et al. Reference Yu, Hendrickson, Campbell and Yue2019; Jamin et al. Reference Jamin, Berhanu and Falcon2025). A transition from a −5/3 to −3 slope is observed in case A, which is also reported in the DNS and experiments of Pan & Banerjee (Reference Pan and Banerjee1995) and Kumar & Banerjee (Reference Kumar and Banerjee1998) and is attributed to a quasi-2-D behaviour and reverse energy cascade. While the change in slope for the energy spectrum is also observed for bubble-induced turbulence (see Lance & Bataille Reference Lance and Bataille1991; Bunner & Tryggvason Reference Bunner and Tryggvason2002; Roghair et al. Reference Roghair, Mercado, Annaland, Kuipers, Sun and Lohse2011; Prakash et al. Reference Prakash, Mercado, Wijngaarden, Mancilla, Tagawa, Lohse and Sun2016) in our case, the underlying physics are quite different. For instance, in case E there are no entrained air bubbles below the surface.
Fourier PSD of kinetic energy components of the water phase at
 $z/\ell =-0.25$
for different
 ${\textit{Fr}}$
. (a) Case A (b) Case E.

A limitation of the traditionally used 1-D spectral analysis is that it does not differentiate between phases if used naively, and is agnostic of interface proximity. Even though the velocity field is continuous across the interface, mismatching viscosities imposes discontinuous velocity gradients that can contribute to additional energy content in the higher wavenumbers. One alternative that offers local information based on the phase or distance to the interface uses wavelets to compute the spectral energy. This is known as a phase-based wavelet analysis and has been used in recent works by Freund & Ferrante (Reference Freund and Ferrante2019) and Calado & Balaras (Reference Calado and Balaras2024a
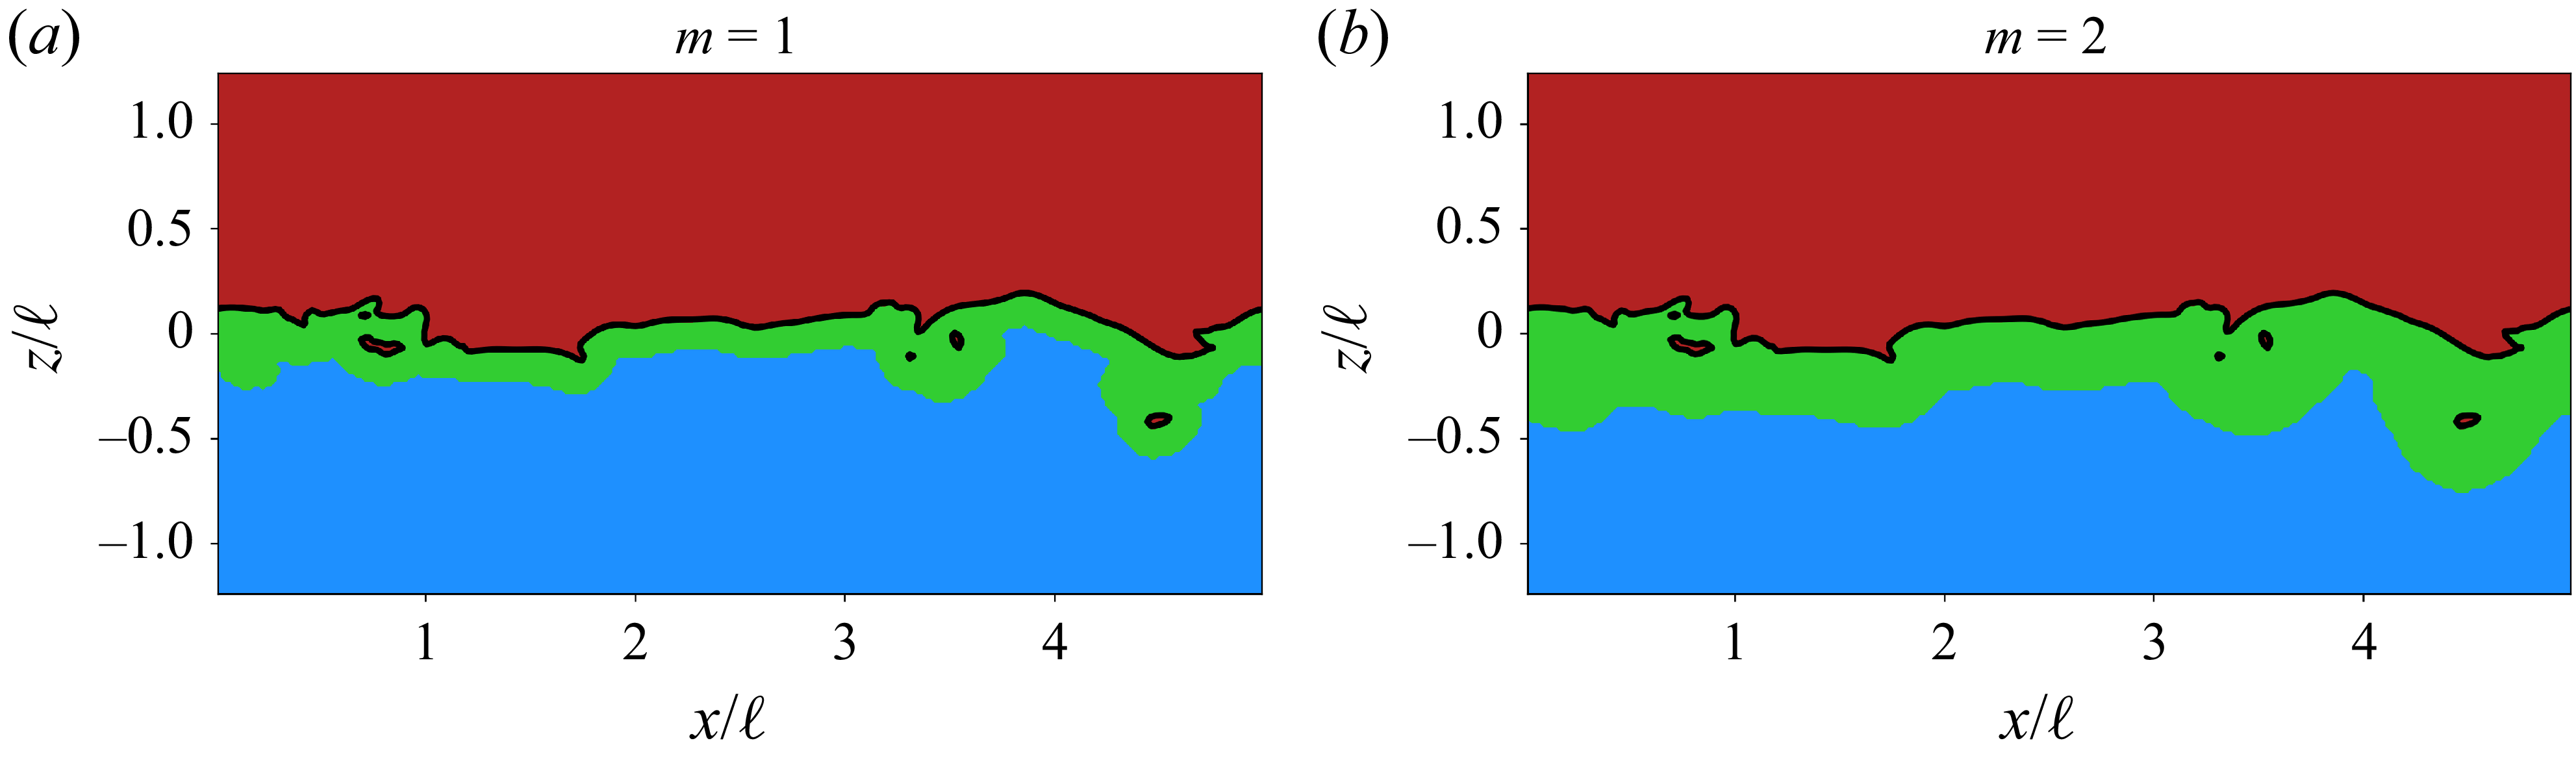
). For the sake of completeness, we include a brief description of this approach and refer to the cited references for more details. The method starts by decomposing the physical domain into three subsets based on the distance to the interface,
 $\phi$
, defining liquid, gas and interfacial subsets as
 $\mathcal{D}_L, \mathcal{D}_G$
and
 $\mathcal{D}_I$
, respectively. Due to the high density ratio, the kinetic energy associated with the air phase is negligible, and the interfacial subset only includes the neighbouring region in the water side. A multi-resolution DWT of the 3-D velocity field can be performed for a range of scales
 $1 \leqslant m \leqslant M$
, from smallest
 $(m=1$
) to largest
 $m=M$
. The wavelet order determines the smallest scale and doubles progressively until the largest scale,
 $M=\textrm {log}_2(N)$
, which depends on the domain size. In our case, we take the horizontal domain size
 $L$
. The equivalent wavenumber is given by
 $\tilde {k}_m= 2 \pi / (2^m \Delta h)$
. Following previous works (Freund & Ferrante Reference Freund and Ferrante2019; Calado & Balaras Reference Calado and Balaras2024a
) we use the fourth-order Symlet wavelet family (orthogonal and of compact support), using eight points in each spatial direction for
 $m=1$
. The domain decomposition can be readily performed based on the level-set function
 $\phi$
and the scale-dependent threshold distance. A discrete wavelet family of order
 $p$
has
 $n_p=2p$
points for
 $m=1$
. The threshold distance for each scale is computed as
 $\tilde {\phi }^{(m)} = 2^{(m-1)} n_p \Delta h$
. Hence, the interfacial region
 $\mathcal{D}_I^{(m)}$
is defined for
 $ - \tilde {\phi }^{(m)} \leqslant \phi \leqslant 0$
. An example of this can be seen in figure 16 for scales
 $m=1$
and
 $m=2$
. Note that the interfacial domain will capture the region in the vicinity of the free-surface, as well water droplets and surrounding entrained bubbles for higher
 ${\textit{Fr}}$
number cases. Nonetheless since the total interfacial area is dominated by the free-surface, the influence of disperse bubbles/droplets is negligible for the overall near surface dynamics. The PyWavelets package is used to compute the wavelet coefficients from the DNS data with the spectra being ensemble averaged over the different snapshots in time (Lee et al. Reference Lee, Gommers, Waselewski, Wohlfahrt and O’Leary2019). We note that while comparisons with traditional Fourier spectra could be made, the DWT brings additional degrees of freedom, where in three dimensions it considers all possible combinations of linear, planar and volumetric dilatations (see, for example, Meneveau Reference Meneveau1991). Furthermore, since the wavelet coefficients are averaged over subdomains based on the distance from the interface, it is not restricted to low
 ${\textit{Fr}}$
cases or cases with a small deformation of the free-surface.
Slice view of example snapshot for domain subsets used in the wavelet analysis for the smallest scales. The black line represents the interface
 $(\phi = 0)$
. Coloured regions represent the air (red), interfacial (green) and water (blue) subsets. Data are for case A. Results are shown for (a)
 $m=1$
and (b)
 $m=2$
.

The wavelet spectra for the liquid and interfacial domains for case A are shown in figure 17(a) and are restricted to scales smaller than
 $L/2$
. Case A shows a higher spectral energy in the pure water phase relative to the interfacial one since it includes the bulk forcing region, and a decay approaching the
 $-5/3$
law. The interfacial spectra has a markedly different shape, with a −1 slope in the low frequency range and a
 $-3$
slope for mid-range wavenumbers. The slope changes again towards a less steep decay for the highest wavenumbers that are closest to the interface. The interfacial spectra for cases A, C and E are given in figure 17(b), exhibiting a slightly higher energy content for low wavenumbers in case E (low
 ${\textit{Fr}}$
) and similar trends for mid and high wavenumbers. The weak dependence on
 ${\textit{We}}$
for the current parameter space is also seen here even at the smallest scales. Finally, we compare cases A and F in figure 17(c) with small differences over the wavenumber range, although the change in slope at higher
 $\tilde {k}_m$
is confirmed with the improved grid resolution of case F. This apparent pileup of energy at the smallest scales near the interface was confirmed by plotting the wavelet energy at
 $m=1$
in a contour slice and comparing against the total kinetic energy in figure 18. For all cases, we consistently observe a concentration of high energy at these smallest wavelet scales next to the interface. While surface tension is known to modulate the fluid TKE if the
 ${\textit{We}}$
number is low enough (see, e.g. Dodd & Ferrante Reference Dodd and Ferrante2016; Saeedipour & Schneiderbauer Reference Saeedipour and Schneiderbauer2022), we have shown in our case that the
 ${\textit{We}}$
number is sufficiently large such that these effects would be minimised. This suggests that the higher energy content at small scales stem from the free-surface dynamics. From the change in slope toward
 $-3$
in the spectra we note the transition wavenumber to be around
 $\tilde {k}_m \approx 20$
, which corresponds to a length scale
 $ \sim\! 0.3 \ell$
. The dual energy exchange discussed in § 5.2 likely plays a role in the –3 scaling of energy for scales smaller than this value as postulated by Pan & Banerjee (Reference Pan and Banerjee1995). The upper bound of the –3 slope occurs at
 $\tilde {k}_m \approx 80$
(
 $ 0.078 \ell$
).
Wavelet spectra for case A, comparing pure water and interfacial spectra (a); interfacial spectra comparing cases A, C and E (b); cases A and F (c).

Contour plots for (a) total kinetic energy and (b) the smallest wavelet scale
 $m=1$
near the free-surface. The interface is shown by the solid white line, while the interfacial region for
 $m=1$
is shown by the neighbouring white dashed line. Data are for case A.

The large-scale dynamics is governed by gravitational forces and dampened by the interface (Frederix et al. Reference Frederix, Mathur, Dovizio, Geurts and Komen2018; Freund & Ferrante Reference Freund and Ferrante2019; Saeedipour Reference Saeedipour2023). It is well known in 2-D turbulence that a change in slope from −5/3 to −3 occurs for wavenumbers larger than some forcing wavenumber, associated with a direct/forward cascade of enstrophy (Kraichnan Reference Kraichnan1971; Xiao et al. Reference Xiao, Wan, Chen and Eyink2009). Reverse or split/dual energy cascades exist in a variety of flow configurations (see Alexakis & Biferale Reference Alexakis and Biferale2018 for definitions and different examples). While the 2-D nature is imposed in some configurations, we have demonstrated that turbulence remains three dimensional for the higher
 ${\textit{Fr}}$
cases in the present work. In addition, under stable stratification, gravity will naturally oppose any vertical displacement of fluid, removing kinetic energy and potentially affecting the transfer mechanisms and local dissipation rates, as pointed out by Bolgiano (Reference Bolgiano1959). The PSD of the gravitational potential energy is proportional to
 ${E}_g \propto z^2$
and, for the values of
 ${\textit{Fr}}$
and
 ${\textit{We}}$
used in this work, it makes up almost the entirety of the total potential energy (Guo & Shen Reference Guo and Shen2010). To quantify the spectral energy associated with the free-surface elevation, we perform a mapping of the free-surface
 $z$
coordinate onto a bi-dimensional grid of the same resolution as the DNS. This grid data is then used to compute 1-D Fourier spectra of the elevation to measure
 ${E}_g$
. This is given in figure 19 for cases A, D, E and F, normalising by the energy of the first wavenumber. The data collapses and exhibits a decay with a slope of
 $-7/5$
for a wide range of wavenumbers. The decay however is less steep for high wavenumbers, indicating a different behaviour at small scales, except for the lowest
 ${\textit{Fr}}$
case (case E) that has the lowest deformations. On a relative basis, this indicates that the conversion between gravitational (potential) and kinetic energy around the free-surface is more relevant at the smallest scales.
Power spectral density of the free-surface elevation for different cases, normalised by energy of the smallest wavenumber.

Another potential mechanism for the higher energy content in the vicinity of the interface stems from modulations in the local turbulence dissipation rate
 $\varepsilon$
. In Walker, Leighton & Garza-Rios (Reference Walker, Leighton and Garza-Rios1996) a decrease in dissipation is observed from the elimination of tangential vorticity fluctuations in a flat free-surface. While this is also the case in the local tangential directions for the deformable free-surface simulations of Guo & Shen (Reference Guo and Shen2010), they do not observe a substantial change in the dissipation rate near the interface. The behaviour in vorticity is markedly different between a flat free-surface (slip wall) and two-fluid interfaces (quasi-free-surface) as shown in § 4.3 and in Terrington et al. (Reference Terrington, Hourigan and Thompson2022a
). We analyse the depth-averaged dissipation rate
 $\langle \varepsilon \rangle$
in figure 20(a), along with a single-phase simulation for comparison at
 ${\textit{Re}}_{\lambda } = 125$
. While the decay in dissipation rate is monotonic in a single-phase case outside of the forcing region, all two-phase cases show an inflection around
 $z/\ell \approx -0.5$
. The higher
 ${\textit{Fr}}$
in case A shows less dissipation, and a similar trend is verified for case F. A snapshot of the local dissipation rate is plotted in figure 20(b) for case F, showing a sudden decay in
 $\varepsilon$
within the blockage layer, with local areas of higher dissipation just below the interface. This analysis of
 $\langle \varepsilon \rangle$
,
 $E_g$
and wavelet spectra shows that small scales within this distance from the interface are unable to effectively dissipate their energy from viscosity.
(a) Average turbulent dissipation rate
 $\langle \varepsilon \rangle$
in the water phase for cases A, E, F and single-phase (SP) simulation at
 ${\textit{Re}}_{\lambda }=125$
for reference; data normalised by values at
 $z/\ell = -2.5$
; (b) instantaneous contour slice (log scale) of
 $\varepsilon$
for case F.

The PDF of the flow topology parameter
 $\varSigma$
for increasing distances from the interface
 $\tilde {\phi }$
and associated dissipation rate
 $\tilde {\varepsilon }$
(a); instantaneous contour plot of
 $\varSigma$
: top view
 $\phi =0$
(b), bottom view
 $\phi =0.08\ell$
(c), slice view (d).

To further characterise the flow near the interface and explore the dissipation regime, we introduce the topology parameter
 $ \varSigma = (||\boldsymbol{S}||^2_F - ||\boldsymbol{\varOmega }||^2_F) / (||\boldsymbol{S}||^2_F + ||\boldsymbol{\varOmega }||^2_F )$
used in Cannon et al. (Reference Cannon, Soligo and Rosti2024). This scalar parameter is bounded between
 $\pm 1$
and can describe states of pure rotation (−1), shear strain (0) or extensional strain (+1). We recall that only states outside of pure rotation (
 $\varSigma \neq -1$
) indicate some level of strain in the fluid parcel and contribute toward local dissipation. Focusing on the same scales analysed through the multi-scale wavelet decomposition presented previously, we compute the PDF of
 $\varSigma$
for distances from the interface shorter than
 $\sim\! \ell$
for case F (see figure 21
a). The averaged dissipation rates within these same regions were computed and given in the same graph as
 $\tilde {\varepsilon }$
. Through this averaging process we provide additional confirmation of the non-monotonic behaviour of the turbulent dissipation rate near the interface and the impact on the TKE exchange. For scales closest to the interface (within
 $\delta _v$
), the PDF peaks close to
 $\varSigma \approx 1$
, indicating dominance of extensional strain occurring at the interface. This is further confirmed by plotting
 $\varSigma$
and taking a top view from the free-surface (
 $\phi =0$
) in figure 21(b), compared to a view from the bottom at
 $\phi = 0.08 \ell$
shown in figure 21(c): it is evident that within this short distance the flow changes to have regions of pure rotation. The extensional strain stems from the compression/stretching of the interface as observed in § 4.1, with large regions of net stretching and ridges with high compression. As the distance from the interface grows, the PDFs converge and shift toward smaller values of
 $\varSigma$
and a more uniform distribution between shear and extensional strain. Furthermore, we can see the extent of the regions associated with pure rotation and strain to grow from figure 21(d).
6. Conclusions
In this work we present two-phase DNS of FST, where the main governing parameter explored is the
 ${\textit{Fr}}$
number, dictating the interface deformation and onset of bubble entrainment. Both
 ${\textit{Re}}$
and
 ${\textit{We}}$
were kept high, but a more extensive range of variation would be beneficial in future studies. For the range of
 ${\textit{We}}$
numbers in this work, we find that surface tension effects are only visible in the entrained air bubble sphericity, affecting the total surface area associated with the bubbles. On the other hand, the
 ${\textit{Fr}}$
number has a major influence on the free-surface area and deformation statistics, as well as the 2-D Eulerian compressibility factor
 $\mathcal{C}$
. As
 ${\textit{Fr}}$
increases, the total interfacial area increases along with the net strain experienced by the free-surface. From the bulk submerged HIT,
 $\mathcal{C}$
increases from the asymptotic value of
 $1/6$
to values approaching
 $1/2$
as observed in Cressman et al. (Reference Cressman, Davoudi, Goldburg and Schumacher2004), Lovecchio et al. (Reference Lovecchio, Zonta and Soldati2015); a higher
 ${\textit{Fr}}$
number results in a slight reduction in
 $\mathcal{C}$
. The vorticity flux across the free-surface is associated with viscous diffusion of vortices parallel to the interface by analysing the dot product between the surface normal
 $\boldsymbol{n}$
and
 $\boldsymbol{\omega }$
, and maps of interface curvature
 $\kappa _{\varGamma }$
.
The modulation of kinetic energy between horizontal and vertical components is observed for the lower
 ${\textit{Fr}}$
cases, following predictions from RDT, while higher
 ${\textit{Fr}}$
cases preserve isotropy even at the surface. The presence of a dual energy exchange is also shown by analysing the inter-scale energy transfer via third-order statistics at different depths, in agreement with the computations of Pan & Banerjee (Reference Pan and Banerjee1995), Lovecchio et al. (Reference Lovecchio, Zonta and Soldati2015) and recent experiments of Ruth & Coletti (Reference Ruth and Coletti2024). Vertical kinetic energy is also seen to be stronger in upwelling eddies compared to downwellings by conditional averaging.
To complement the spectral analysis, we perform a phase-based DWT of the kinetic energy. We observe different power law scalings of the wavelet energy, with a stronger −3 slope for mid-range wavenumbers and a weaker decay for the smallest scales closest to the interface. The higher energy at the smallest scales near the free-surface results from the conversion of gravitational energy and lower turbulent dissipation rate. The local flow topology was also investigated by quantifying the density of regions under pure rotation, shear or extension at increasing thresholds below the interface. The dissipation rate exhibits a non-monotonic behaviour, with a sudden increase at the interface characterised by a dominance of pure extensional strain. Within the source/blockage layer the flow topology changes rapidly with larger regions of pure rotation, where vortices adjust from a random orientation to become parallel to the free-surface.
These findings have considerable implications for two-phase TKE transport modelling, indicating the strong dependence on scales of the modelled turbulence, as well as their proximity to the interface. We note that studies using spectral analysis of higher
 ${\textit{Fr}}$
are still lacking in the literature and warranted. One potential avenue left for future work is to use a filtering approach (e.g. Xiao et al. Reference Xiao, Wan, Chen and Eyink2009; Lovecchio et al. Reference Lovecchio, Zonta and Soldati2015; Park & Lozano-Duran Reference Park and Lozano-Duran2025) to calculate the inter-scale kinetic energy transfer and identify spatial structures participating in the upscale energy transfer. Furthermore, a decomposition of this quantity as outlined by Johnson (Reference Johnson2021) into its local/non-local vorticity stretching and strain amplification terms can help clarify the physical mechanisms involved in the FST cascade.
Funding
This work was funded by the U.S. Office of Naval Research grant N00014-22-1-2639 under the guidance of Dr. W.-M. Lin. The computational resources were provided through the Department of Defense High Performance Computing Modernization Program.
Declaration of interests
The authors report no conflict of interest.
Appendix A. Sensitivity of ensemble statistics
In order to establish how many uncorrelated snapshots in time were necessary to obtain converged ensemble statistics, we computed the depth-averaged TKE,
 $\langle k \rangle$
, varying the total number of snapshots (
 $N_s$
) between 4 and 10 for case A. The results in figure 22(a) show that with just
 $N_s=4$
the profile is very close to being converged, and negligible differences are observed for more than eight snapshots. The mean squared error for
 $\langle k \rangle$
relative to
 $N_s=12$
is shown in figure 22(b), where the decay is near exponential. Hence, for all reported cases, a total of
 $N_s=10$
are used for purposes of ensemble averaging.
(a) Depth-averaged TKE
 $\langle k \rangle$
, computed with an increasing number of snapshots for ensemble averaging in case A; (b) mean squared error for the
 $\langle k \rangle$
profile relative to
 $N_s=12$
; the dotted line is a decaying exponential shown for reference.